


Abstract
With the increasing use of in vivo imaging in mouse models of disease, there are many interesting applications that demand imaging of organs and tissues with submillimeter resolution. Though there are other contributing factors, the spatial resolution in small-animal PET is still largely determined by the detector pixel dimensions. Methods: In this work, a pair of lutetium oxyorthosilicate (LSO) arrays with 0.5-mm pixels was coupled to multichannel photomultiplier tubes and evaluated for use as high-resolution PET detectors. Results: Flood histograms demonstrated that most crystals were clearly identifiable. Energy resolution varied from 22% to 38%. The coincidence timing resolution was 1.42-ns full width at half maximum (FWHM). The intrinsic spatial resolution was 0.68-mm FWHM as measured with a 30-gauge needle filled with 18F. The improvement in spatial resolution in a tomographic setting is demonstrated using images of a line source phantom reconstructed with filtered backprojection and compared with images obtained from 2 dedicated small-animal PET scanners. Finally, a projection image of the mouse foot is shown to demonstrate the application of these 0.5-mm LSO detectors to a biologic task. Conclusion: A pair of highly pixelated LSO detections has been constructed and characterized for use as high-spatial-resolution PET detectors. It appears that small-animal PET systems capable of a FWHM spatial resolution of 600 μm or less are feasible and should be pursued.
High spatial resolution and sensitivity in PET are important goals, especially for small-animal imaging applications. With the increased use of mouse models as a tool in biomedical research—for example, in the evaluation of new therapeutic strategies—there are many instances in which it is necessary to visualize and accurately measure radiopharmaceutical accumulation in structures that have dimensions of a millimeter or less. Obvious examples include the early detection and evaluation of metastatic disease in mouse models of human cancer and the study of cell trafficking dynamics in relation to the immune system and novel stem cell therapies. Although other considerations, such as tracer-specific activity and the concentration of the biologic target within the animal, are also critical in determining whether a specific signal is measurable by PET, the range of applications for which small-animal PET can be applied will clearly be dictated by the resolution and sensitivity performance of the imaging system. The development of dedicated small-animal PET scanners has led to significantly better spatial resolution and comparable, or even improved, sensitivity relative to clinical scanners.
Most high-resolution PET scanners that are currently in use are based on scintillation detectors. In the majority of these cameras, discrete crystals or some form of block detector (semidiscrete crystals) are coupled to position-sensitive photomultiplier tubes (PMTs) (PSPMTs) or multichannel PMTs (MCPMTs) to provide positional information (1). The spatial resolution performance of these cameras can be directly related to the size of the detector elements. Sizes of detector elements that are used in the latest generation high-resolution animal PET scanners range from 0.8 to 1 mm (2–5).
Despite the contribution of positron range, noncolinearity, and intercrystal scatter, it has been shown that further gains in spatial resolution can be achieved by continuing to decrease the crystal dimensions, provided that individual elements can still be unambiguously decoded (6). In this article, we describe, to our knowledge, the smallest pixel lutetium oxyorthosilicate (LSO) array built to date and characterize its performance in terms of energy, timing, and spatial resolution. We also present planar and tomographic images acquired with these detectors that demonstrate their potential for high-resolution PET applications in small animals.
MATERIALS AND METHODS
Fabrication of LSO Arrays
The fabrication of scintillation crystal arrays becomes increasingly difficult as the size of the elements decrease. Manufacturing and handling of discrete elements is nearly impossible for dimensions less than 1 mm. Therefore, a novel method was used to produce arrays with a pixel size significantly smaller than 1 mm. Agile Engineering followed the method as outlined in the patent by Andreaco et al. to produce the arrays characterized here (7). Briefly, a block of LSO is cut to the desired thickness. The block is cut into LSO slices and polished such that the thickness of the slice equals the desired pixel size. Reflector is inserted between the slices, and the slices are glued together using an optical epoxy (8). The resulting 1-dimensional array is rotated by 90° and the process is repeated by cutting orthogonal to the original slices. This results in a 2-dimensional (2D) pixelated array with reflective material between each crystal element. The reflector used in these arrays was a 64-μm-thick dielectric reflector foil.
This manufacturing method has several benefits over traditional array assembly. One is that no individual element needs to be manufactured or handled during array creation. In addition, the method inserts the reflector between the layers in a repeatable way with minimal dead space (65–70 μm) between crystals and a high packing fraction of 75%.
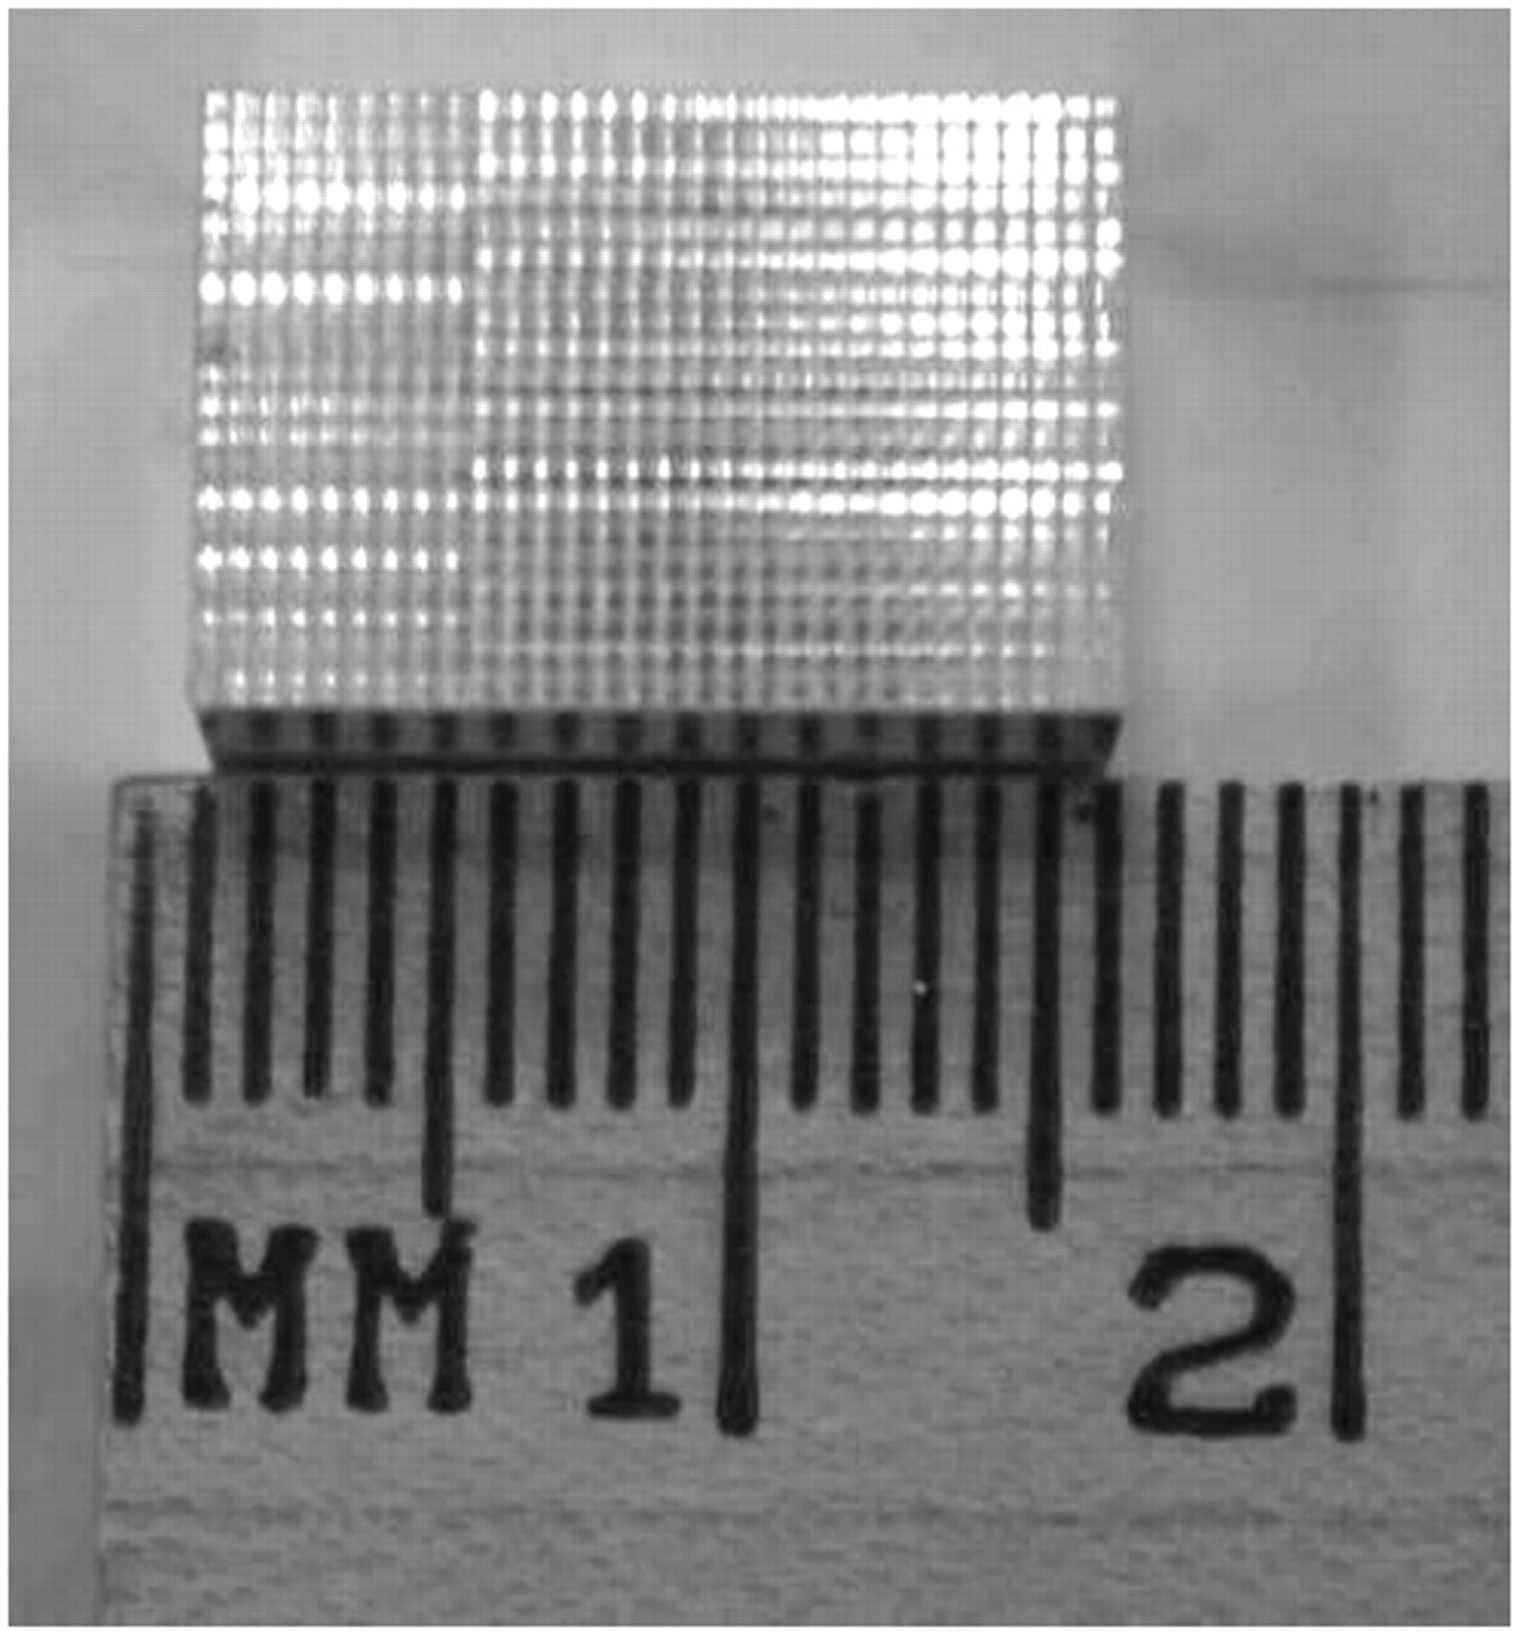
Figure 1 shows a photograph of one of the arrays used in this work. Two 20 × 30 arrays, each with a pixel size of 0.43 × 0.43 × 10 mm3 on a 0.5-mm center-to-center pitch, were fabricated. By choosing 10-mm-thick detectors, efficiency relative to other high-resolution detectors (2–5) has not been compromised.

Photograph of one of two 0.43 × 0.43 × 10 mm LSO arrays fabricated. Each array has 20 × 30 elements.
Detector Module Fabrication
The arrays were coupled to Hamamatsu H7546 MCPMTs (Hamamatsu Corp.) using optical coupling grease (BC-630; Bicron). This PMT has 64 individual channels arranged in an 8 × 8 grid beneath the bialkali photocathode (9). Each MCPMT pixel has a 2 × 2 mm active area on a 2.25-mm pitch. These PMTs are well characterized and have been used previously in our laboratory in the microPET II scanner (10). A simple charge division resistor network is used to multiplex the 64 signals into 4 position-encoding signals, denoted as X+, X−, Y+, and Y− (11). Anger logic can then be used to process these 4 signals to determine the X and Y location corresponding to the centroid of the deposited energy for each event, whereas the sum of the 4 signals is a measure of the total energy deposited.
Detector Module Characterization
The pair of 0.5-mm LSO detectors was characterized using experiments shown in the literature to predict the performance of these detectors in PET imaging. The experimental methods were adapted where necessary to permit meaningful measurements with these very small detectors.
Flood Histograms
Each of the 2 detector modules was uniformly irradiated with a 68Ge source. The PMT signals were shaped using a multichannel spectroscopy amplifier (model N568B; Costruzioni Apparecchiature Elettroniche Nucleari) with a shaping time of 200 ns. The analog signals were then digitized using a custom data acquisition (DAQ) board and software (12). In addition, the 4 PMT signals were summed and fed into a constant fraction discriminator (CFD) (model 584; ORTEC), where the lower threshold was set just above the noise, the fraction was 0.2, and a 2.0-ns delay was used. The CFD output was then fed into a gate and delay generator (model 416A; ORTEC) that produced the trigger signal for the DAQ board. This resulted in the simultaneous sampling of the 4 position signals after a valid event. Anger logic was used to process the 4 position signals to generate X- and Y-position locations. These locations were then histogrammed in 2 dimensions to produce a detector flood histogram. The flood histograms were visually inspected to ensure that the arrays were positioned near the center of the PMT and with minimal rotation.
Crystal Lookup Table Generation
A semiautomated routine was used to create a crystal lookup table for each flood. The routine is based on the watershed algorithm in Matlab (The MathWorks) that was modified by additional presmoothing of the data and user interaction to ensure that all crystals were identified and no erroneous crystals were added by the routine. This lookup table assigned each measured X, Y location to a unique crystal element in the array.
Energy Histograms
Summing the signals from all 4 channels for each event leads to a measure of the total energy deposited from that event. The lookup table described here was used to classify each event to a crystal identification, and an energy histogram for each individual crystal was generated. Energy resolution (%) was measured as the full width at half maximum (FWHM) of the photopeak divided by the photopeak amplitude. The energy resolution was determined for representative crystals at the corner, edges, and center of one of the arrays.
Coincidence Timing Resolution
The 2 detectors were placed in coincidence with a separation of 8 cm between the detector faces and manually aligned. The timing resolution for 2 coincident annihilation photons was measured by running the CFD output signals for both detectors into the start and stop channels of a time-to-amplitude converter (TAC) (model 567; ORTEC). The TAC output was then digitized using a multichannel analyzer. A variable delay was inserted into the stop signal in the TAC to ensure that the stop signal was always the later signal as well as to allow calibration of the time axis. A 68Ge source was positioned centrally between the 2 detectors for this measurement. The timing resolution was measured by irradiating the entire surface area of the detectors and using a lower threshold just above the noise. Counting rates were such that random coincidences were negligible.
Intrinsic Spatial Resolution
The intrinsic spatial resolution of the detectors was measured to determine the spatial resolution achievable without the impact of any data processing or reconstruction effects. The detectors were more carefully aligned by taking a projection image of an ∼2-mm point source. When the detectors are in alignment, the centroid of the point source will project onto the same elements of both arrays. Given that not all of the crystals are easily separated in the flood histogram, only the central 16 × 24 array of crystals was used for alignment. No correction was made for the possible residual rotation of the arrays with respect to each other.
The intrinsic spatial resolution was measured using a 30-gauge needle (outer diameter, 0.3 mm; inner diameter, 0.2 mm) filled with 75–175 MBq of 18F. With this level of activity, no dead time was expected in the system. This needle source was attached to a motor-driven slide and was positioned between the 2 detectors with the needle aligned with the shorter array dimension. This source was then stepped in 75-μm steps across the face of the detector covering a total distance of 1.8 mm, and data were collected for 10 min at each step. The data were then processed to determine the number of coincidence counts between a pair of opposing crystals as a function of the source location, with decay corrections made for the decay of the radionuclide from the first time point. Taking advantage of the source shape, and to improve statistics, counts between multiple crystal pairs within one column of the arrays were summed together. The intrinsic spatial resolution was measured as the FWHM of this profile. For this measurement, the maximum positioning error is estimated to be half a crystal width, or 0.25 mm, which corresponds to a deviation of <0.2° from the perpendicular line joining the 2 detector faces. For this measurement, rotational misalignment is likely present.
The measured FWHM was also compared with Monte Carlo simulation results. Simulations of energy deposition in the LSO were performed using EGSnrc Monte Carlo code (13). Positron range was simulated as a biexponential distribution with appropriate parameters for 18F (14). Noncolinearity was modeled as a gaussian distribution with a FWHM = 0.0022d, where d is the detector separation (15). In addition, the detector pixel was modeled as an ideal square pixel with no gaps between pixels, resulting in the 2D triangular geometric coincidence response function. These components were then convolved together in a linear systems model to predict the overall intrinsic spatial resolution of the 0.5-mm detector pair. See Stickel and Cherry (6) for more detailed methods of the simulations.
Phantom Imaging
A simple hot-spot phantom was created using an array of 0.6-mm-diameter holes with a center-to-center spacing of 1.2 mm. A continuous piece of plastic tubing was threaded through all of the holes to allow filling using a single needle. After filling of the phantom, the ends of the tube were sealed. A rotation stage was placed between the 2 detectors to allow tomographic imaging by rotating the object while keeping the detectors stationary.
The phantom was filled with approximately 14 MBq of 18F solution and tomographically imaged with the high-resolution LSO detectors as well as on the microPET II (4) and microPET Focus (Siemens Preclinical Solutions) (16) scanners. For the microPET scanners, data were collected for 30 min. On the high-resolution LSO detectors, data were collected at 36 angles, 5° apart. To compensate for the decay of 18F, and to ensure uniform statistics, data were collected at each angle for times ranging from 90 to 270 s. The data were then corrected for isotope decay, varying collection times, center-of-rotation offset, crystal efficiencies, and non–uniform sinogram sampling. Crystal efficiencies were estimated using a cylindrical source. One million counts were acquired in singles mode for each detector, and the proportion of events in each crystal was determined and taken as an estimate of the crystal efficiency. The efficiency for each line of response was calculated by the product of the efficiencies of the relevant crystal pair. The time window was set to 8 ns and the detectors were separated by 8 cm. No energy thresholding or correction for randoms was applied. The data were reconstructed on all 3 systems using filtered backprojection with a ramp filter with a cutoff frequency at the Nyquist limit. For the reconstruction of data from the 0.5-mm LSO arrays, direct and cross-plane data were binned into sinograms with a radial step size of 0.25 mm and an angular step size of 0.7°. Data from all crystals were used in creating the sinograms.
Mouse Imaging
To demonstrate the application of these detectors on a more biologically relevant target, a projection image was taken of an ex vivo mouse foot. The mouse foot was chosen for the structural detail in the bones and the small size that would fit completely within the field of view of the 2 detectors. A CD1 mouse that weighed approximately 25 g was injected with 280 MBq of 18F−. The tracer was allowed a 2-h uptake period in the awake mouse. The mouse was then sacrificed and the feet were removed. The foot used for imaging contained 1.1 MBq of activity as measured by a dose calibrator just before imaging. The foot was mounted on a support and placed between the detectors. Data were collected for 4 h. The data were then projected into the midplane between the 2 detectors using only the direct lines of response. By using only the direct lines, the maximum spatial resolution is retained within the image. The time window was set to 8 ns and the detector separation was 6 cm. No energy thresholding was used and no correction was performed for randoms. Tomographic imaging was not performed because of the small amount of activity and the short half-life of the radionuclide. All animal studies were performed with approval of the Institutional Animal Care and Use Committee.
RESULTS
Flood Histograms
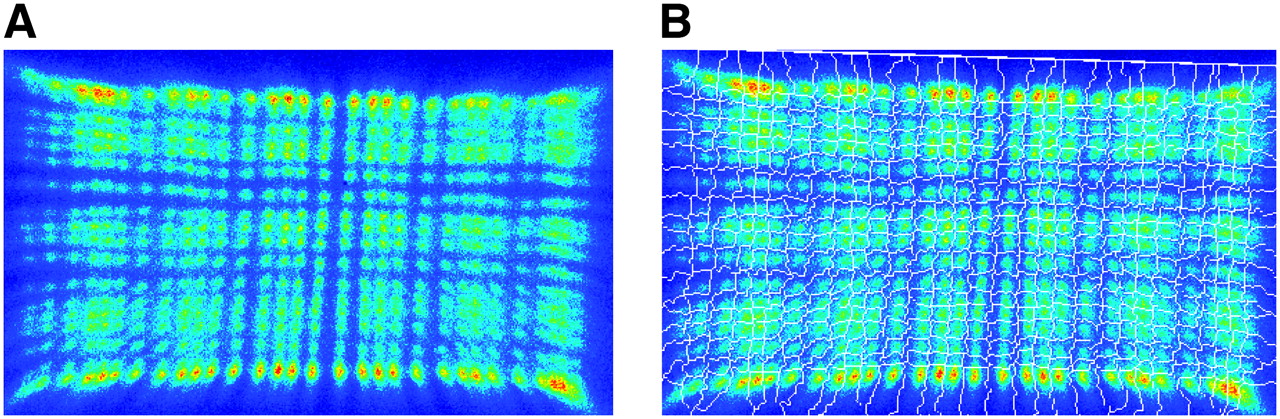
Figure 2A shows the flood histogram obtained from one of the arrays. This image contains ∼5 million counts. The majority of the crystals can be clearly separated and identified, indicating that these small crystals produce sufficient scintillation light for decoding. The crystals that are not easily separated are at the edges of the arrays. This is likely due to a combination of fewer events being positioned in these crystals because of the intercrystal scatter and optical leakage across the reflector that reduces the signal collected at the edges and corners of the array. Additionally, at the left and right edges of the array, the array extends right to the very edge of the PMT active area, where there is some deterioration in response. The decoding quality also varies between the short and long axis of the crystal array. This is due to the manufacturing process used to place the reflector between the layers. In the direction of the second cut, the reflector is continuous, whereas in the opposite direction the reflector is segmented. This allows for preferential optical cross-talk along one axis of the array. Nonetheless, ∼80% of the crystals can clearly be identified. The flood histograms obtained for the second detector were very similar to the results shown in Figure 2A.

(A) Flood histogram obtained by uniform irradiation of one array with a 68Ge source. (B) Crystal lookup table generated from this flood histogram using a semiautomated watershed algorithm. Central crystals are easily separated, whereas edge and corner crystals require some manual estimation of borders.
Crystal Lookup Table Generation
Figure 2B shows the generated crystal lookup table superimposed on the flood histogram. The borders between crystals are shown in gray. This table is used to assign all event locations to a specific crystal in the array. Separate lookup tables were created for both detectors.
Energy Resolution
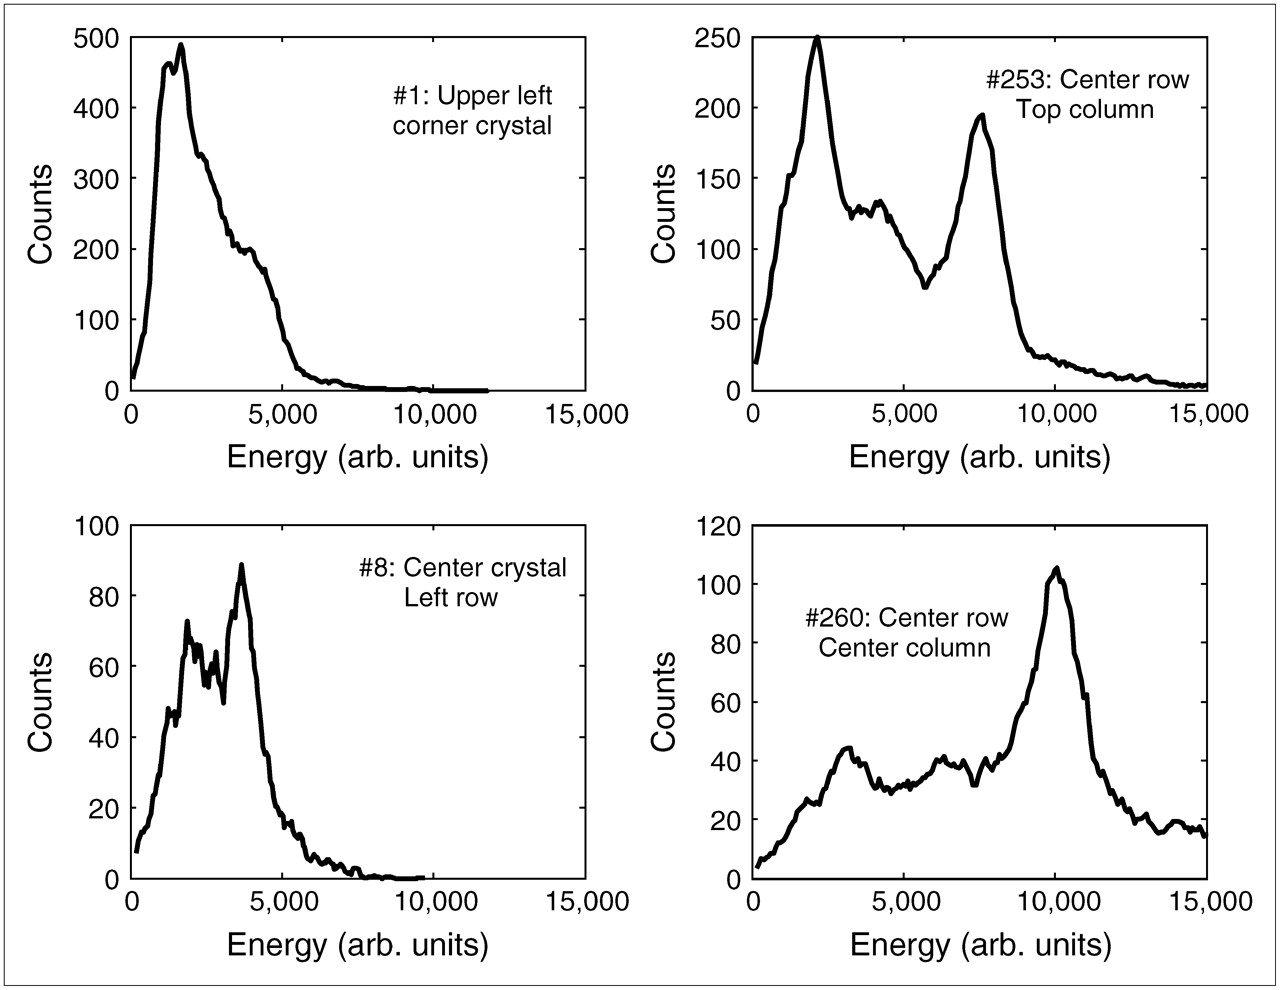
Figure 3 shows 4 representative energy spectra from individual crystals within one of the arrays. The crystals presented here are the upper left corner (crystal 1), the central crystal on the left edge (crystal 8), the central crystal along the top row (crystal 253), and the central crystal in the central row (crystal 260) of the detector shown in Figure 2. These individual crystal energy spectra show that there is a large difference in the location of the photopeak, indicating large variations in light collection. The corner crystal does not have a defined photopeak and, hence, the FWHM resolution cannot be measured. From the other spectra, it is clear that the energy resolution improves for the central crystals as compared with the edge crystals. The energy resolution is directly related to the total amount of light that is collected for a given event. Non-uniformities in the quantum efficiency or photoelectron collection efficiency of the PMT near the edge of the active area, and reflectors that are not completely opaque, would cause the signal from an edge or corner crystal to be smaller than the signal in the center and would lead to a poorer energy resolution in those regions. The measured energy resolutions range from 22% to 38% for the crystals presented here. These energy resolutions are similar or only slightly worse than those of other small-animal scanners despite the smaller crystal size (2,3,16,17).

Energy spectra for 4 representative crystals in the array. The x-axis shows energy in arbitrary units. FWHM energy resolution for crystal 1 is unmeasurable, whereas the others measure 38% (crystal 8), 23% (crystal 260), and 22% (crystal 253).
Coincidence Timing Resolution
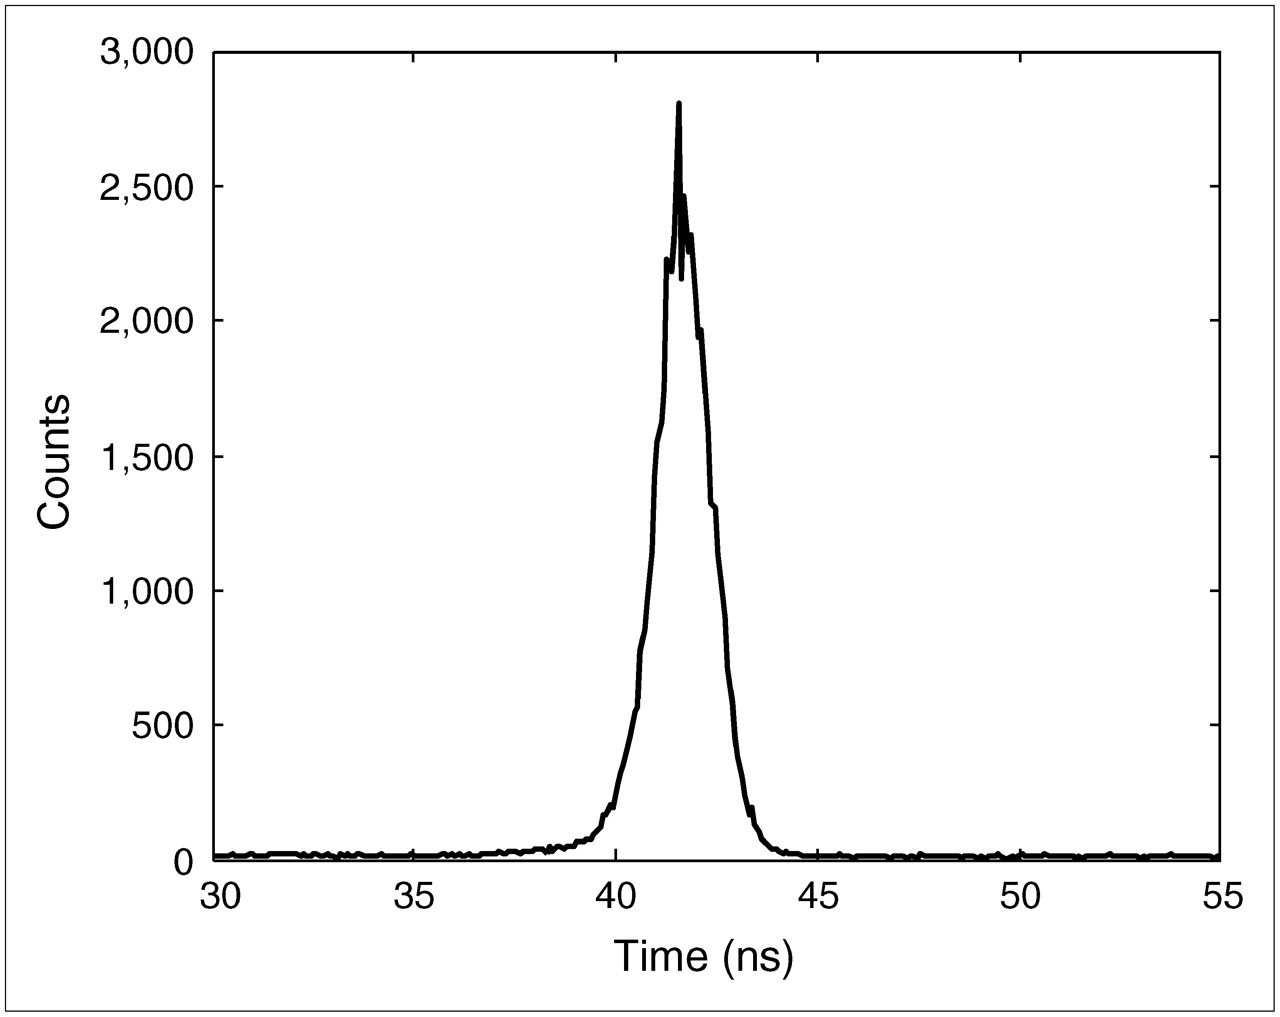
Figure 4 shows the coincidence timing spectrum integrated over the whole detector surface. This spectrum is symmetric, indicating that the CFD settings and other electronics for each detector were well balanced. The FWHM resolution was measured as 1.42 ns and the full width at tenth maximum (FWTM) resolution was 3.12 ns. Crystal-to-crystal variations in timing resolution were not explored; however, it is likely that the timing resolution is worse for the edge crystals (lower light collection efficiency) than that for central crystals. This timing resolution is more than adequate for small-animal imaging applications.

Timing spectrum for the 2 LSO detectors in coincidence. FWHM is 1.42 ns and FWTM is 3.12 ns.
Intrinsic Spatial Resolution
Figure 5 shows the intrinsic spatial resolution profile. The FWHM of the measured response is 0.68 mm. No correction was made for the source dimensions. This profile is the sum of 100 individual crystal pairs between the 2 detectors (10 individual crystals on each detector) that were aligned parallel to the source. The profile in any one pair of detectors is limited by counting statistics due to the small cross-section of the crystals. However, if any misalignments (either rotational or translational) exist between the 2 rows of crystals, the summed profile will be broader compared with the profile of a single aligned detector pair. It can be seen in Figure 5 that there are some asymmetries in the line spread function that can be attributed to slight residual rotational misalignment between the crystal rows that may indicate that the true intrinsic spatial resolution is slightly better than the value reported here. The edge crystals were not used in this resolution measurement because they were not as cleanly separated in the flood histogram and there is an increased likelihood of mispositioned events. This resolution is a significant improvement over the intrinsic spatial resolution measured with current small-animal PET scanners.
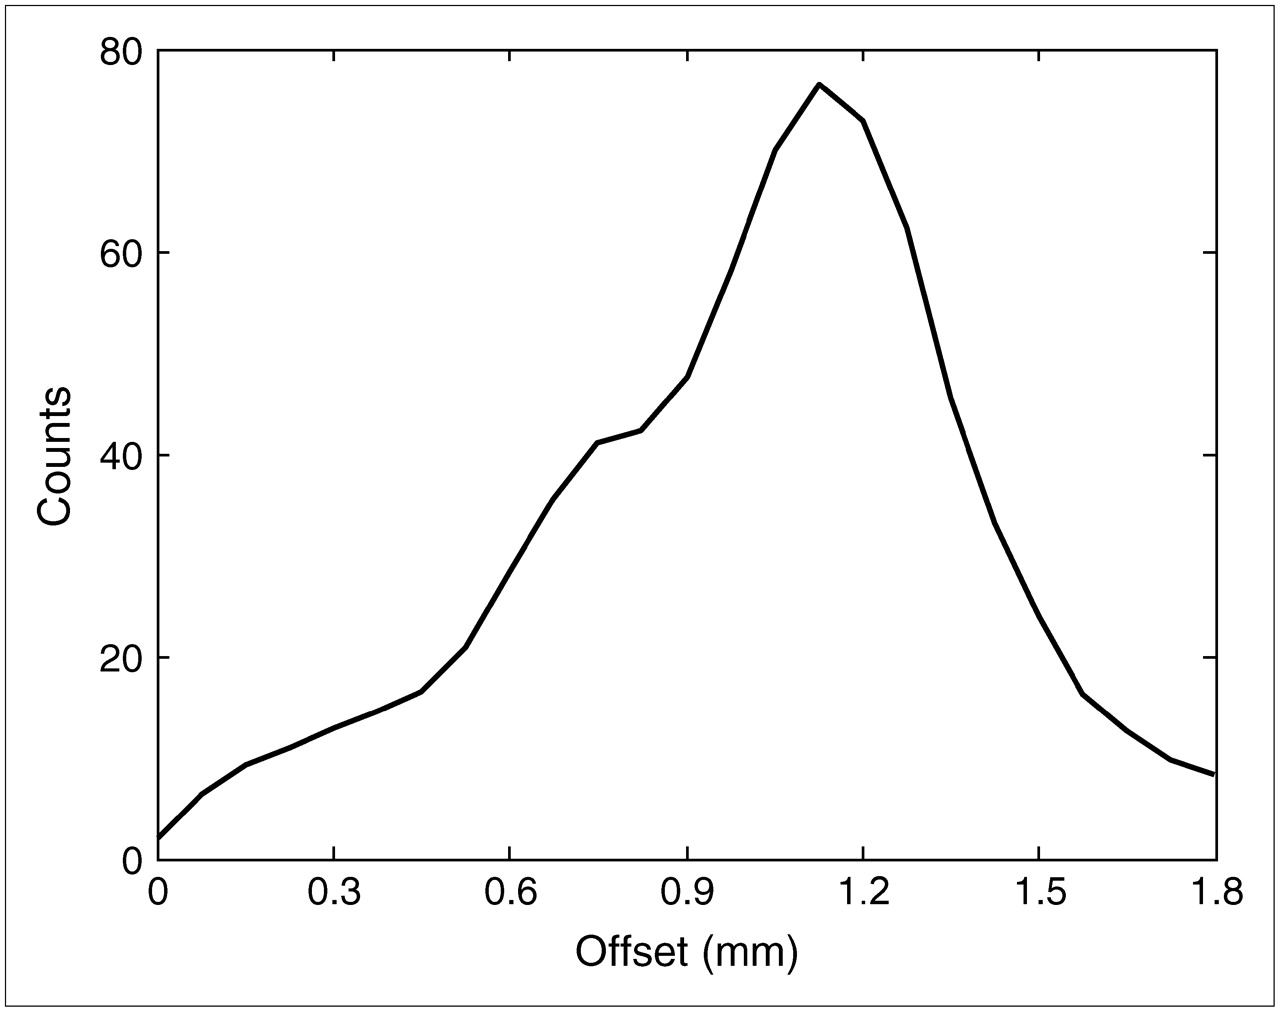
Intrinsic spatial resolution profile as measured with 30-gauge needle filled with 18F. FWHM resolution is 0.68 mm. Profile shown here is sum of the profiles for 10 crystals in a row along each detector leading to 100 individual profiles.
This result was compared with the results predicted from resolution simulation studies that accounted for positron range, noncolinearity, energy deposition, and detector size effects, details of which have been described elsewhere (6). Simulation predicted an intrinsic spatial resolution of 0.64-mm FWHM, which agrees well with the measured 0.68 mm. This indicates that the crystal decoding is acceptable within the central region of the array and that the detector pair is very close to obtaining the theoretical resolution determined by geometry and physics.
Phantom Imaging
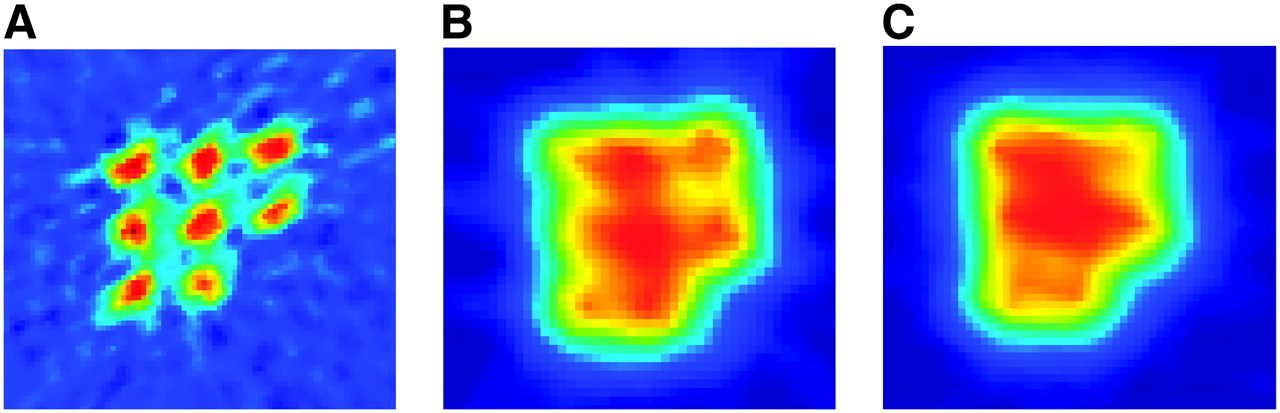
Figure 6 shows the reconstructed images of the line source phantom acquired with the 0.5-mm LSO detectors (Fig. 6A), the microPET II scanner (Fig. 6B), and the microPET Focus scanner (Fig. 6C) using filtered backprojection reconstruction with a ramp filter. There are 800,000 total counts acquired and used in the reconstructed image from the high-resolution detectors as compared with 108 million counts acquired and used in the microPET II image and 262 million counts acquired and used in the microPET Focus image. Using the high-resolution detectors, the 8 spots are clearly resolved, whereas there is little readily discernible structure on the other images. The improvement in spatial resolution achieved using the 0.5-mm detectors is evident. The streaks and higher noise on the 0.5-mm detector image are caused by the lower total number of counts and reduced angular sampling as compared with the 2 full-ring scanners.

Images of line source phantom obtained using 0.5-mm detectors (A), microPET II scanner (B), and microPET Focus scanner (C) using filtered backprojection reconstruction with a ramp filter. All sources can be clearly resolved only with the high-resolution detector.
Mouse Imaging
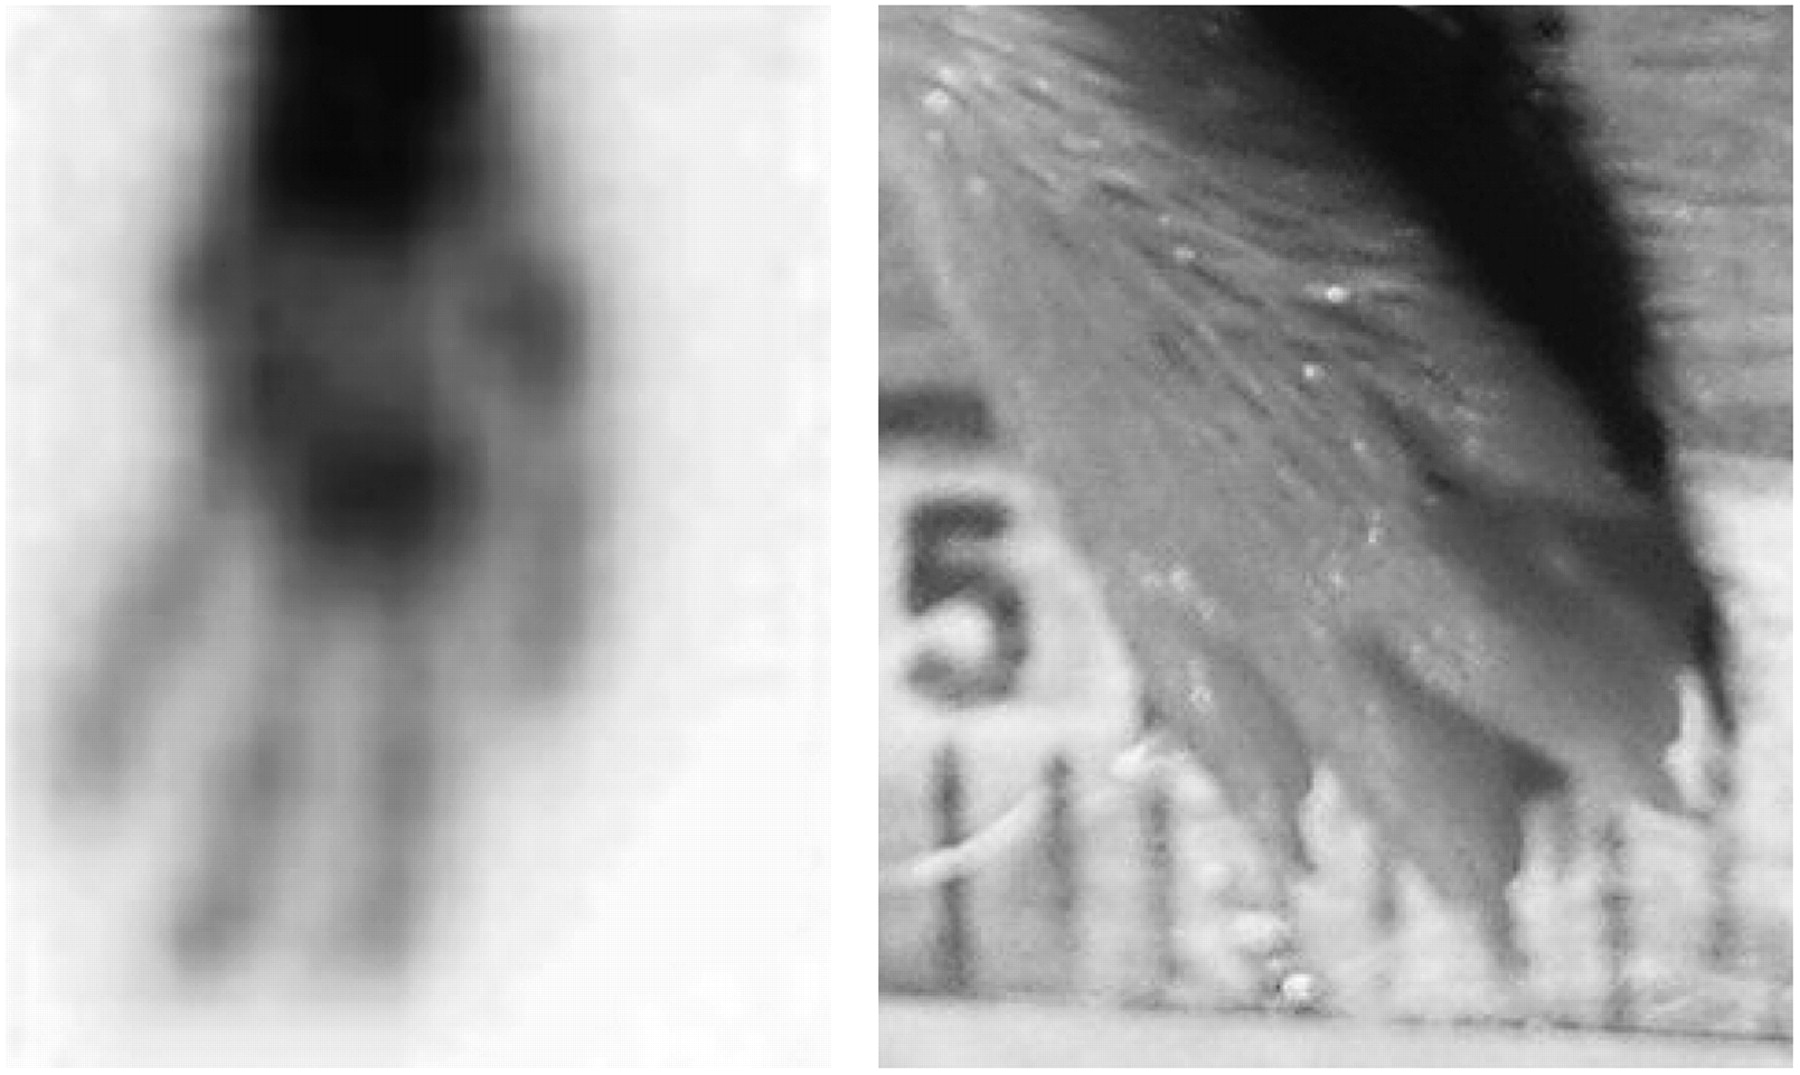
Figure 7 shows the 18F− projection image of the mouse foot as well as a photograph for reference. A total of 2.4 million counts are in the image. The 4 toes as well as the joints between the bones can be seen clearly on PET image. In addition, some of the structure in the main part of the foot is visible. This demonstrates the use of these high-resolution detectors in a biologic application.

Projection image of a mouse foot acquired with two 0.5-mm LSO detectors using 18F− as radiotracer. Photograph of a mouse foot, with a millimeter-scale ruler as reference, is also shown.
DISCUSSION
This work experimentally characterized a pair of LSO detectors with a pixel pitch of 0.5 mm. Crystals could be identified in the flood histogram, and a timing resolution of 1.42-ns FWHM and an energy resolution of 22%–38% FWHM were measured. These characteristics indicate that adequate light is being collected from each crystal to allow for positioning and timing. Intrinsic spatial resolution was measured as 0.68-mm FWHM and this almost exactly matches the 0.64-mm FWHM that was predicted using Monte Carlo simulation. This improvement in resolving power is clearly seen on the phantom and animal images shown here. One factor that might contribute toward the measured spatial resolution, but has been ignored, is the contribution of the positioning ability of the MCPMT itself. This is a complex function of the light intensity, the light spread on the photocathode (determined by the pixel size, cross-talk within the LSO array, and cross-talk in the optical entrance window of the MCPMT), the electronics used to read out the MCPMT, and the positioning algorithm used to determine the location of an event. The fact that our data match a simulation that does not account for the underlying resolution of the MCPMT itself suggests that the MCPMT does not add significantly to the measured spatial resolution.
Using Monte Carlo simulations, we previously predicted that a spatial resolution of 0.5-mm FWHM is possible in small-animal PET using 18F as the radionuclide and an LSO detector pixelated to 0.25 mm (6). Attempts were also made to construct an array with 0.25-mm pixels for this study; however, fabrication of such arrays proved to be impossible with current approaches. The problem with pixels of this size is that the process of cutting the LSO, even in sheets rather than pixels, leads to cracking of the slices. This may indicate that we are approaching the limit of machinability of many dense scintillator crystals. To achieve finer pixelation, it may be necessary to move to direct detection with semiconductor materials, where the electrode dimensions can be more easily patterned with dimensions on the order of 200 μm (18–20).
To realize the improvements in spatial resolution demonstrated in this article routinely for in vivo studies will also require significant improvements in sensitivity. Although the sensitivity requirements for any particular application vary enormously, very roughly, one would wish to maintain the number of counts per resolution element as the resolution is improved. Thus, moving from the 1 × 1 × 1 mm3 spatial resolution systems that are state-of-the-art today to a resolution of 0.5 × 0.5 × 0.5 mm3 will require roughly an 8-fold increase in sensitivity. This, in fact, is readily achievable using thicker detectors (current high-resolution animal PET systems tend to use scintillation detectors that are only 8- to 12-mm thick) and by improving solid angle coverage around the animal. The well-documented problem in moving to thicker detectors is the depth-of-interaction effect that degrades spatial resolution for lines of response that do not enter the detector at normal incidence. We have recently demonstrated 3.5-mm depth-of-interaction resolution in 1-mm LSO arrays that have a thickness of 20 mm and are read out at both ends by position-sensitive avalanche photodiodes (21); work to extend these measurements of 0.75- and 0.5-mm LSO arrays, with the same thickness, is underway. Interestingly, the depth-of-interaction resolution actually gets better with this approach as crystal size decreases, because the difference between the signals measured at opposing ends of the array changes more rapidly as a function of depth of interaction for narrower crystals (21). Solid angle coverage in most scintillator-based animal PET scanners remains relatively low, and significant gains in sensitivity are easily realized by surrounding the animal with more detector material with the only significant and obvious objection being the additional cost this infers.
CONCLUSION
Two finely pixelated LSO detectors have been constructed and characterized for use as high-spatial-resolution PET detectors. The measurements show that the energy resolution (22%–38% FWHM) and timing resolution (1.42-ns FWHM) of these detectors are comparable with that of many small-animal PET systems currently in use. However, the intrinsic spatial resolution (0.68-mm FWHM) is significantly better than that achieved in those systems (0.8–2.25 mm) and demonstrates the value of developing more finely pixelated detectors. These detectors were also used in imaging experiments that indicated the expected resolution performance on tasks ranging from a simple set of line sources to a more complex biologic task. Thus, it appears that small-animal PET systems capable of a spatial resolution of 600 μm or less are feasible and should be pursued.
Acknowledgments
We thank Keith Vaigneur of Agile Engineering for manufacturing the LSO arrays. Funding was provided by the Whitaker Foundation and National Institutes of Health grants R01 EB000561 and R01 EB000194.
References
- Received for publication June 30, 2006.
- Accepted for publication October 19, 2006.


