


Visual Abstract

Abstract
Sarcoidosis and lymphoma often share common features on 18F-FDG PET/CT, such as intense hypermetabolic lesions in lymph nodes and multiple organs. We aimed at developing and validating radiomics signatures to differentiate sarcoidosis from Hodgkin lymphoma (HL) and diffuse large B-cell lymphoma (DLBCL). Methods: We retrospectively collected 420 patients (169 sarcoidosis, 140 HL, and 111 DLBCL) who underwent pretreatment 18F-FDG PET/CT at the University Hospital of Liege. The studies were randomly distributed to 4 physicians, who gave their diagnostic suggestion among the 3 diseases. The individual and pooled performance of the physicians was then calculated. Interobserver variability was evaluated using a sample of 34 studies interpreted by all physicians. Volumes of interest were delineated over the lesions and the liver using MIM software, and 215 radiomics features were extracted using the RadiomiX Toolbox. Models were developed combining clinical data (age, sex, and weight) and radiomics (original and tumor-to-liver TLR radiomics), with 7 different feature selection approaches and 4 different machine-learning (ML) classifiers, to differentiate sarcoidosis and lymphomas on both lesion-based and patient-based approaches. Results: For identifying lymphoma versus sarcoidosis, physicians’ pooled sensitivity, specificity, area under the receiver-operating-characteristic curve (AUC), and accuracy were 0.99 (95% CI, 0.97–1.00), 0.75 (95% CI, 0.68–0.81), 0.87 (95% CI, 0.84–0.90), and 89.3%, respectively, whereas for identifying HL in the tumor population, it was 0.58 (95% CI, 0.49–0.66), 0.82 (95% CI, 0.74–0.89), 0.70 (95% CI, 0.64–0.75) and 68.5%, respectively. Moderate agreement was found among observers for the diagnosis of lymphoma versus sarcoidosis and HL versus DLBCL, with Fleiss κ-values of 0.66 (95% CI, 0.45–0.87) and 0.69 (95% CI, 0.45–0.93), respectively. The best ML models for identifying lymphoma versus sarcoidosis showed an AUC of 0.94 (95% CI, 0.93–0.95) and 0.85 (95% CI, 0.82–0.88) in lesion- and patient-based approaches, respectively, using TLR radiomics (plus age for the second). To differentiate HL from DLBCL, we obtained an AUC of 0.95 (95% CI, 0.93–0.96) in the lesion-based approach using TLR radiomics and 0.86 (95% CI, 0.80–0.91) in the patient-based approach using original radiomics and age. Conclusion: Characterization of sarcoidosis and lymphoma lesions is feasible using ML and radiomics, with very good to excellent performance, equivalent to or better than that of physicians, who showed significant interobserver variability in their assessment.
Sarcoidosis is a systemic inflammatory disease characterized by the development of granulomas, which may involve lymph nodes and various organs. Hodgkin lymphoma (HL) and diffuse large B-cell lymphoma (DLBCL), the most frequent type of non-Hodgkin lymphoma, are also characterized by enlarged invaded lymph nodes but can affect many organs. When 18F-FDG PET/CT is performed at diagnosis, these diseases may present with a similar pattern, that is, intense hypermetabolism in enlarged lymphadenopathies, in particular in the mediastinum. Involvement of many other nodal stations may also be observed, along with extranodal lesions, and the distribution of lesions thus helps imaging specialists in interpreting these PET/CT scans. Nonetheless, the accuracy of visual interpretation of 18F-FDG PET/CT scans for differentiating sarcoidosis from lymphomas is imperfect (1). Semiquantitative measurements such as SUVmax have not proven to be the answer either (2,3). Moreover, sarcoidosis can develop before lymphoma (sarcoidosis-lymphoma syndrome) and after lymphoma, and immunotherapy-induced sarcoidlike reactions are increasingly observed (4–7). No matter the results of the imaging studies, pathologic confirmation of the disease is mandatory in all cases before initiating treatment.
The histopathology of these entities is very different, suggesting that deep characteristics of the image might also be specific. Radiomics is a high-throughput approach allowing extraction of large amounts of data from images and characterization of the lesion phenotype (8,9). The development of artificial intelligence and machine learning (ML) combined with radiomics has gained popularity in different medical imaging tasks, including lesion identification and characterization. In lymphoma, some studies have shown the potential of 18F-FDG PET/CT radiomics to differentiate lymphoma from other types of cancers and to differentiate different types of lymphoma (10–14). To the best of our knowledge, no study has yet explored the use of 18F-FDG PET/CT radiomics to characterize sarcoidosis lesions, except one for the diagnosis of cardiac involvement (15).
The primary objective of the present study was to develop and validate a radiomics signature to differentiate sarcoidosis, HL, and DLBCL lesions. Furthermore, we compared the ML-driven diagnosis with physician performance in categorizing the 3 diseases, taking into account interobserver variability.
MATERIALS AND METHODS
Patients
The study was approved by the Ethics Committee of the University Hospital of Liège. The need for written informed consent was waived because of the retrospective and noninterventional design of the study. We retrospectively collected consecutive 18F-FDG PET/CT scans obtained at the University Hospital of Liège between April 2010 and February 2020 of patients with HL, DLBCL, or sarcoidosis at initial diagnosis, before any treatment. The diagnosis was based on pathology in all lymphoma cases and in most cases of sarcoidosis. The diagnosis of the remaining sarcoidosis cases was based on clinical evidence and follow-up. Exclusion criteria were radiotracer extravasation, artifacts in pathologic areas, absence of a delineated volume of interest (VOI) after semiautomatic segmentation, and absence of relevant information in the DICOM files. Basic clinical data (age, sex, and weight) were collected from the information obtained routinely on the day of the PET/CT scan. Figure 1 shows the flowchart of the study.

Study flowchart.
Imaging
18F-FDG PET/CT scans were acquired using 2 cross-calibrated PET/CT systems, a GEMINI TF Big Bore and a GEMINI TF 16 (Philips), 66 min on average (range, 58–92 min) after intravenous injection of 18F-FDG (mean injected activity, 245 MBq, depending linearly on the patient’s weight). The patients fasted for at least 6 h before the injection, and the median glycemia was 92 mg/dL (range, 59–195 mg/dL). A low-dose CT scan (slice thickness, 5 mm; tube voltage, 120 kV; and tube current–time product, 50–80 mAs, depending on the patient’s weight) was performed without injection of intravenous contrast agent, followed by a PET emission scan of 90 s per bed position (50% overlap), extending from the upper thighs to the skull base. All images were acquired and reconstructed according to the EARL (European Association of Nuclear Medicine Research Ltd.) guidelines for both PET/CT systems. Images were reconstructed with standard 4 × 4 × 4 mm voxels (slice thickness, 4 mm) using an iterative list-mode algorithm (blob ordered-subset time-of-flight), and corrections for attenuation, dead time, random events, and scatter events were applied without postreconstruction smoothing.
Lesion Segmentation and Clinical Diagnosis
The entire cohort of anonymized patients was randomly distributed into 4 groups (groups A–D). The scans of each group were assigned to 4 different nuclear medicine physicians (observers A–D), who were unaware of any clinical information or diagnosis and had 6 y (observer A), 3 y (observer B), 15 y (observer C), and 10 y (observer D) of experience. In a first step, from visual interpretation of the PET/CT scans, the physicians attributed a diagnosis to each patient of their cohort. For that purpose, they first chose either sarcoidosis or cancer, and if the latter was selected, they chose HL or DLBCL. This evaluation was based solely on the experience of each physician. No reading guidelines or visual or semiquantitative interpretation criteria were provided to the readers within the framework of the study. For each answer, the physicians indicated their level of confidence (0, possible; 1, probable; or 2, certain).
In the next step, the physicians segmented PET VOIs for their assigned patient population using MIM software, version 7.0.5 (MIM Software Inc.), with the following 4 steps. The first was automatic selection of all regions using an absolute threshold SUVmax of at least 3 within a rectangular VOI manually drawn on the whole body. The second step was automatic exclusion of VOIs smaller than 2 cm3. The third step was manual exclusion of all physiologic VOIs (e.g., brain, heart, and kidneys). The fourth step was manual modification of some pathologic VOIs, that is, removing physiologic activity in continuity with the pathologic VOI but never enlarging the VOI. In the absence of literature references for this combination of diseases, especially considering sarcoidosis, the thresholds of SUVmax and volume were decided after tests were performed on a sample of images with the aim of including as many lesions as possible while limiting the need for manual modifications. A VOI of 20 cm3 was also drawn on the healthy liver.
Radiomics Extraction and Model Elaboration
Two hundred fifteen features were extracted from the segmented PET volumes using the RadiomiX Toolbox (Radiomics SA), coded with Matlab (MathWorks), and aligned with the Imaging Biomarkers Standardization Initiative, with, however, some additional features (a list of all features can be found in the supplemental materials, available at http://jnm.snmjournals.org). We also studied the ratio of the feature values calculated in the tumor and in the liver (tumor-to-liver ratio [TLR]), except for the shape features. For calculation of the texture matrix-based features, the intensities were discretized using 2 different methods according to the recommendations of the Imaging Biomarkers Standardization Initiative: fixed bin numbers of 32 and 64 and fixed bin widths of 0.05, 0.1, 0.2, and 0.5 SUV.
Since each patient could have more than 1 lesion, 2 radiomics approaches were tested. In a first approach (lesion-based), each lesion was considered as 1 observation and the goal was to classify each lesion as, first, belonging to the sarcoidosis or lymphoma class and, second, as belonging to the HL or DLBCL class. In the second approach (patient-based), the radiomics features of each lesion and for each patient were merged using their minimum, maximum, mean, and median values, and clinical data (age, sex, and weight) were added to the radiomics features. Here, the aim was to classify each patient into the sarcoidosis, HL, or DLBCL group.
We also evaluated whether combining different feature selection (FS) approaches and ML classifiers would allow for a radiomics signature to differentiate sarcoidosis from lymphoma patients and to differentiate HL from DLBCL. For that purpose, we tested a different set of models, which differed in feature type, that is, original radiomics or TLR radiomics; FS and ML classifier method; and the effect of adding clinical data before FS. Seven different FS methods were tested: accuracy decrease obtained from the embedded FS of the random forest (RF) classifier; Gini impurity decrease obtained from the embedded FS of the RF classifier; forward FS using the minimum redundancy maximum relevance (MRMR) method with Pearson correlation; backward FS using MRMR with Pearson correlation; forward FS using MRMR with Spearman correlation; backward FS using MRMR with Spearman correlation; and forward MRMR based on the mutual information. We also used 4 ML classifiers: RF, support vector machine with radial kernel, naive Bayes, and a logistic regression (16). The dataset was stratified with the same percentage of classes, avoiding unbalanced data, and was randomly divided into training and test sets (80% and 20%, respectively). We tested different models that differed in the FS, ML, and intensity discretization method and in the number of features, which was between 2 and 20 with intervals of 2. We used 5-fold cross validation in our training data, and we chose the best radiomics signature according to the best mean 5-fold cross validation area under the precision-recall area under the receiver-operating-characteristic curve (AUCpr). For each classifier, the default hyperparameter values were used in their respective R packages. Finally, for each of the different models with distinct selected features, all training data were bootstrapped to derive the corresponding 95% CIs for each performance metric and tested on the independent test set. The number of bootstrap repetitions was set to at least 1,000. Since images came from only 2 scanners (same manufacturer and model, same acquisition protocol), which were also cross-calibrated, we did not consider it necessary to perform data harmonization. As recently suggested by Buvat and Orlhac (17), we performed a T.R.U.E. checklist (Is it true? Is it reproducible? Is it useful? Is it explainable?) to assess the potential impact of our findings.
Statistical Analysis
The homogeneity in age and weight across the A, B, C, and D populations was assessed by the Kruskal–Wallis nonparametric test, whereas χ2 test association was performed for sex and the final diagnosis (gold standard). Additionally, the homogeneity in age, sex, and weight across cancer and sarcoidosis patients and between HL and DLBCL patients was also evaluated using the χ2 and Kruskal–Wallis tests. Statistical significance was assigned for P values of 0.05 or less.
The diagnostic performance of all observers pooled together and each individual observer against the gold standard was calculated using sensitivity, specificity, positive predictive value (PPV), and negative predictive value (NPV). In addition, diagnostic performance was evaluated by calculating the percentage of agreement (or accuracy) and the AUC. To calculate the predicted probabilities, we fitted a logistic regression model with the observer’s classification as the predictor. We additionally bootstrapped the data to measure the AUC 95% CIs. The 95% CIs for the sensitivity, specificity, PPV, and NPV were calculated using exact binomial confidence limits.
To test variability among observers, we applied the CI approach in sample size estimation for interobserver agreement with binary outcomes (18). Because of a lack of literature on the established agreement, to calculate the sample size in the case of 4 observers we assigned an expected κ of 0.70, indicating moderate agreement (19), a lower bound of 0.50 with an unknown upper bound, and a significance level of 0.05. With a prevalence of 0.3 for sarcoidosis versus cancer and 0.6 for HL versus DLBCL, a sample size of 27 and 23 was required, respectively. On the basis of this estimation, we randomly selected a subgroup of 34 patients who were subsequently analyzed by all 4 observers to evaluate the interobserver variability. Because of the misclassification for the sarcoidosis versus cancer, only 21 patients remained in the evaluation of interobserver variability in the analysis of HL versus DLBCL. Fleiss κ was used to investigate overall agreement among 4 observers in the classification (for sarcoidosis/cancer and for HL/DLBCL) and intraclass correlation coefficients for degree of certainty. Finally, the Hotelling T2 test was used to test the difference in agreement between pairs of observers.
For radiomics, we evaluated the performance of the models using AUC, AUCpr, sensitivity, specificity, PPV, and NPV, with a 0.5 probability threshold on the test set for lesion-based and patient-based approaches. Statistical and ML analyses were performed for the 2 clinical tasks (sarcoidosis/cancer and HL/DLBCL) using R software, version 4.0.3.
RESULTS
In total, 448 patients meeting the study inclusion criteria were initially identified. After the exclusion criteria were applied, 420 patients (mean age, 49 ± 18 y; 241 men and 179 women) remained in the study (Fig. 1). According to the gold standard, 169 patients had sarcoidosis (40.2%), 140 had HL (33.3%), and 111 had DLBCL (26.4%). The Ann Arbor stages for HL were 10 cases of stage I, 1 of stage IE, 64 of stage II, 1 of stage IIE, 19 of stage III, 20 of stage IIIS, and 25 stage of IV, and the stages for DLBCL were 10 cases of stage I, 27 of stage II, 12 of stage III, 10 of stage IIIS, and 52 of stage IV. Eighty-one patients with sarcoidosis had extrathoracic lesions. Table 1 presents the patient characteristics and gold standard for the entire population and the 4 physicians’ subsamples. The 4 groups were balanced except for observer D, who had significantly more sarcoidosis patients and fewer DLBCL patients. Patient age differed significantly across the 4 subsamples (P = 0.008), with patients in group D being significantly younger than those in groups A and B, which could be explained by the difference in the distribution of diseases. There was no significant difference in weight or sex across the 4 subsamples.
Patient Characteristics (n = 420) and 4 Physician Subsamples
Individual and Pooled Observer Performance as Compared with Gold Standard
For identifying lymphomas (HL and DLBCL) in the entire population (n = 420), the sensitivity and specificity were 0.99 (95% CI, 0.97–1.00) and 0.75 (95% CI, 0.68–0.81), respectively. The AUC was 0.87 (95% CI, 0.84–0.90), and accuracy was 0.893 (95% CI, 0.86–0.92). Similarly, a Cohen κ of 0.78 (95% CI, 0.72–0.84) revealed substantial agreement with the gold standard. Taking the certainty level into account, a significant higher agreement κ of 0.86 (95% CI, 0.79–0.92) was found for certainty level 2, compared with a κ of 0.41 (95% CI, 0.23–0.58) for level 1 (P < 0.001).
Overall and individual observer performance for the diagnosis of cancer versus sarcoidosis for their subsample populations is listed in Table 2. All observers had an excellent sensitivity (0.97–1.00) but a lower and more variable specificity (0.58–0.81). AUC and accuracy ranged from 0.79 to 0.90 and from 0.85 to 0.92, respectively. Regarding the confidence levels, observers A, B, C, and D chose level 2 in 81%, 80%, 80%, and 65% of cases; level 1 in 15%, 19%, 12%, and 27%; and level 0 in 4%, 1%, 8%, and 8%, respectively.
Overall and Individual Performance for Diagnosis of Sarcoidosis Versus Lymphoma
For identifying HL in the cancer population (n = 248, after removing 3 patients mistakenly categorized with sarcoidosis), the sensitivity and specificity were 0.58 (95% CI, 0.49–0.66) and 0.82 (95% CI, 0.74–0.89) respectively. AUC was 0.70 (95% CI, 0.64–0.75), and accuracy was 0.69 (95% CI, 0.63–0.74). The Cohen κ of 0.40 (95% CI, 0.29–0.51) indicated only fair agreement with the gold standard. When the certainty level was 2, a significantly higher κ of 0.51 (95% CI, 0.41–0.67) was obtained, compared with a κ of 0.20 (95% CI, 0.14–0.39) at level 1 certainty (P = 0.003).
Overall and individual observer performance for the diagnosis of HL versus DLBCL for their subsample populations is listed in Table 3. The sensitivity ranged from 0.39 to 0.77 and specificity from 0.77 to 0.85. AUC and accuracy ranged from 0.60 to 0.81 and from 0.59 and 0.82, respectively. Regarding the confidence levels, observers A, B, C, and D selected level 2 in 54%, 46%, 61%, and 45% of cases; level 1 in 38%, 49%, 33%, and 43%; and level 0 in 8%, 5%, 6%, and 12%, respectively. Representative examples of PET studies are shown in Figures 2 and 3.
Overall and Individual Performance for Diagnosis of HL Versus DLBCL Lymphomas

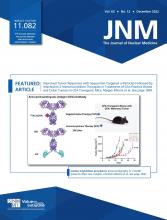
Representative examples of 18F-FDG PET/CT studies of diseases localized to thorax: DLBCL (A), HL (B), and sarcoidosis (C).

Representative examples of 18F-FDG PET/CT studies of diffuse diseases: DLBCL (A), sarcoidosis (B), and HL (C).
Interobserver Agreement
In the sample of 34 patients, a Fleiss κ-value of 0.66 (95% CI, 0.45–0.87) indicated that the 4 observers were in moderate agreement with one another in the diagnosis of cancer versus sarcoidosis. Regarding the certainty levels, an intraclass correlation coefficient of 0.353 (95% CI, 0.181–0.547) showed poor agreement among the observers. At the individual level, the agreement with the gold standard was highly variable, as κ ranged from 0.45 to 0.93. The Hotelling T2 test showed that agreement with the gold standard differed significantly between the 2 extreme values, that is, observers B and D (T2 = 8.70, P = 0.006).
For the diagnosis of HL versus DLBCL, in the population of 21 patients diagnosed with cancer evaluated by all 4 observers, the Fleiss κ-value of 0.69 (95% CI, 0.45–0.93) indicated moderate agreement among observers. Regarding certainty levels, an intraclass correlation coefficient of 0.075 (95% CI, 0.076–0.316) showed poor agreement among the observers. At the individual level, only observer A displayed substantial agreement with the gold standard (κ = 0.70; 95% CI, 0.38–1.01), whereas the other 3 observers showed poor agreement, with κ ranging from 0.07 to 0.27. The Hotelling T2 test showed that observer A outperformed the other 3 observers in agreement with the gold standard and that the most significant difference was between observers A and B (T2 = 9.60, P = 0.006). There was no significant difference in agreement among observers B, C, and D. Supplemental Tables 1–2 show all the individual κ and Hotelling T2 values for the interobserver agreement analysis for the 2 tasks.
Performance of Radiomics Models Compared with Gold Standard
In the whole cohort, 2816 VOIs were segmented, including 1,028 (36.5%) for sarcoidosis, 836 (29.7%) for HL, and 952 (33.8%) for DLBCL (mean number of VOIs by patient: 42.1 for sarcoidosis, 44.7 for HL, and 75.8 for DLBCL). One patient with sarcoidosis was excluded from the radiomics analyses (n = 419) because of diffuse liver pathologic infiltration that did not allow delineation of the hepatic background VOI. The results of the best model performance compared with physician performance are summarized in Figures 4 and 5.

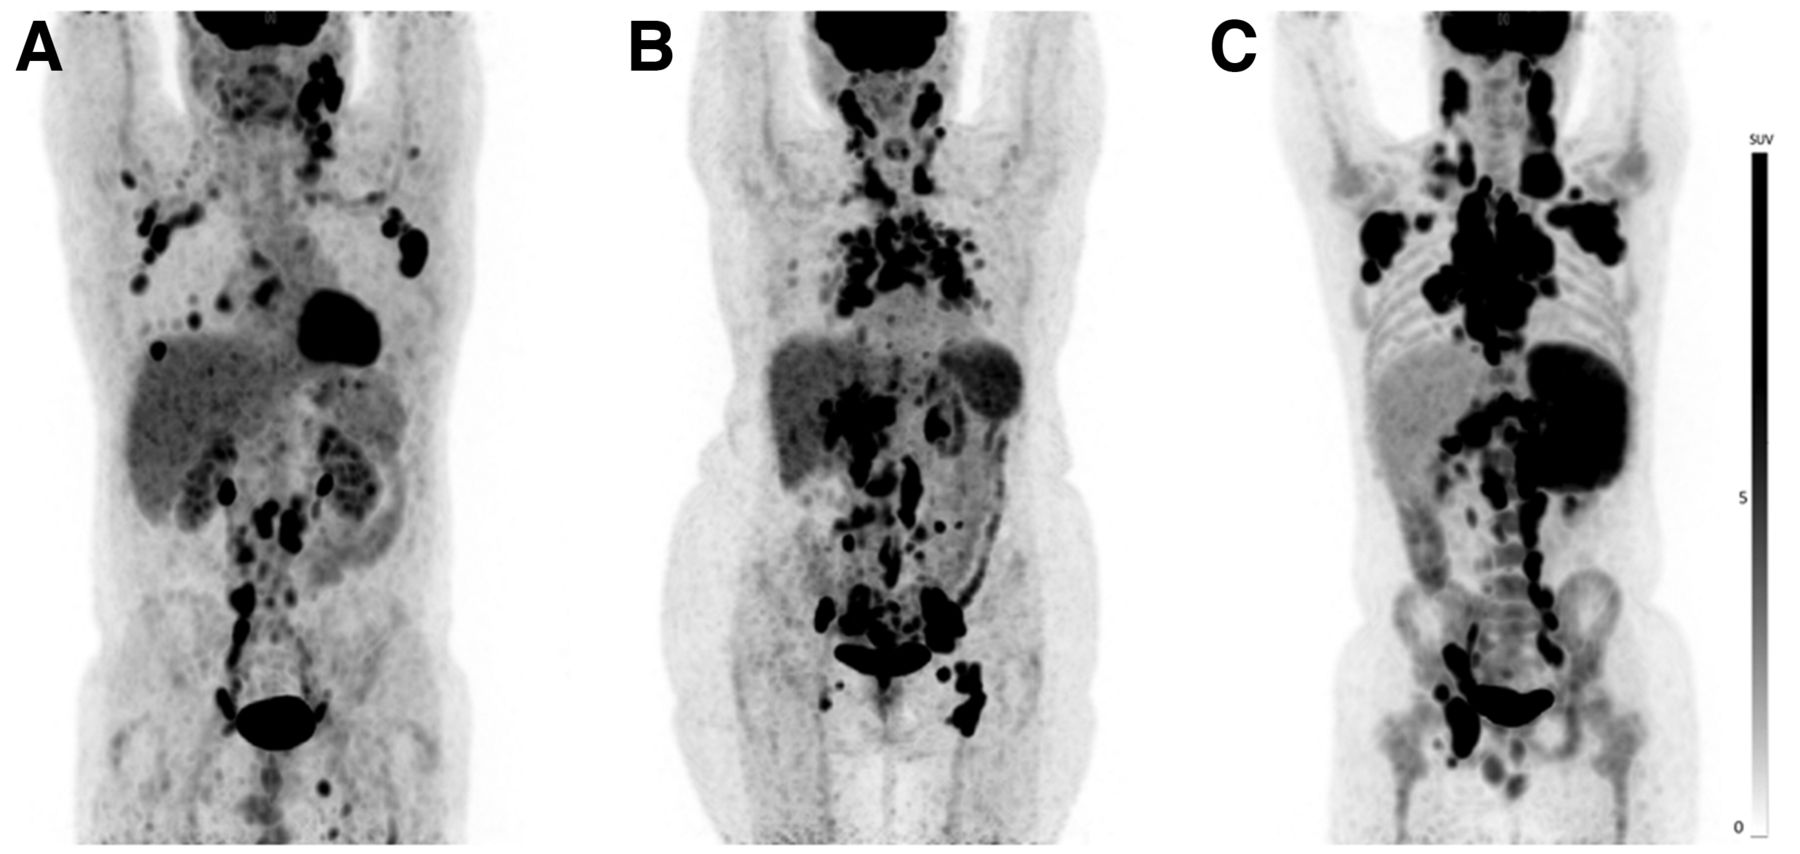
Chart illustrating performance of physician and ML-radiomics models for diagnosis of sarcoidosis vs. lymphoma. Vertical lines at top of each bar represent CIs.

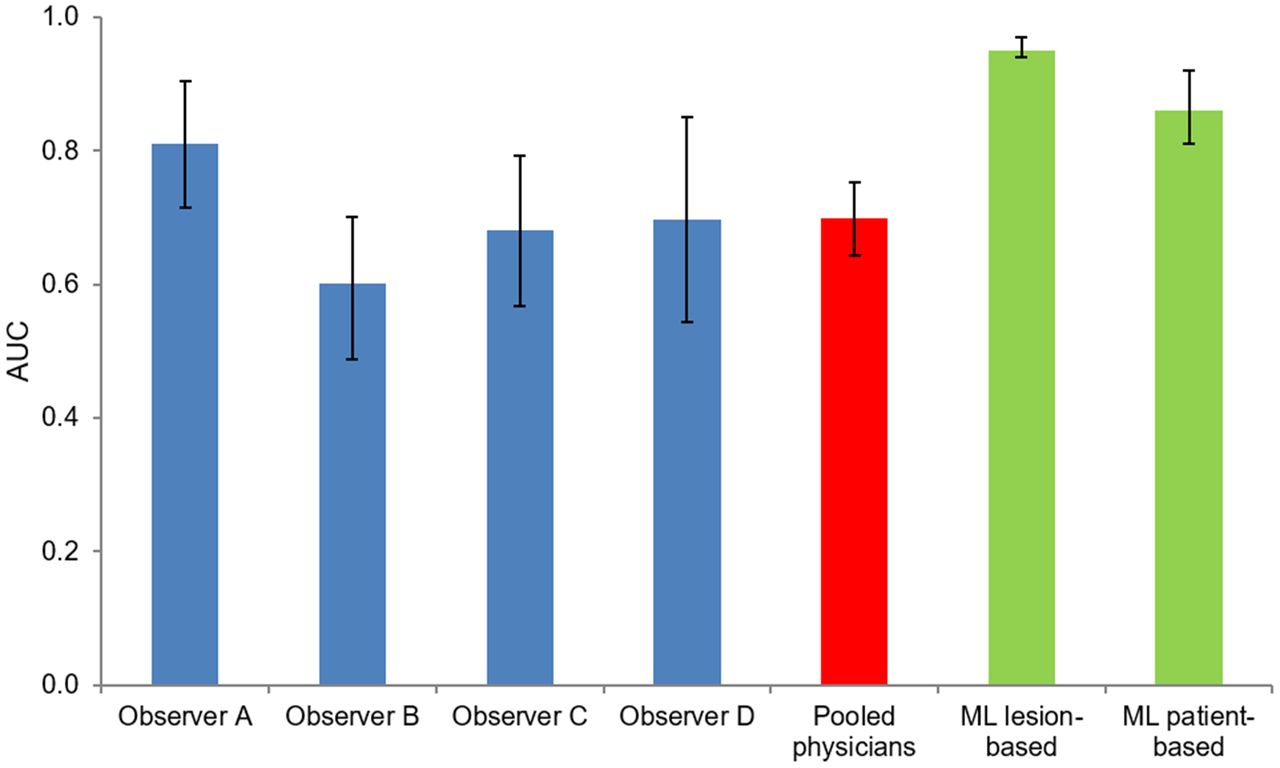
Chart illustrating performance of physicians and ML-radiomics models for diagnosis of HL vs. DLBCL. Vertical lines at top of each bar represent CIs.
An RF classifier, in which features were selected with the embedded RF feature selection using the accuracy decrease as a criterion, yielded the best performance to differentiate cancer from sarcoidosis following a lesion-based approach. This model included 4 TLR radiomics features discretized with a fixed bin width of 0.05 SUV: 2 first-order gray-level statistics features (Stats_min; Stats_p10), 1 intensity volume histogram feature (IVH_AIRV_90), and 1 textural feature (GLCM_infoCorr2). This model showed sensitivity of 0.92 (95% CI, 0.89–0.94), specificity of 0.80 (95% CI, 0.75–0.84), PPV of 0.88 (95% CI, 0.86–0.91), and NPV of 0.85 (95% CI, 0.81–0.89). For the test set, performance was excellent, with an AUC and AUCpr of 0.94 (95% CI, 0.93–0.95) and 0.96 (95% CI, 0.95–0.97), respectively, and was significantly better than the best model with original radiomics (AUC, 0.68; and AUCpr, 0.78). The best patient-based radiomics models included TLR radiomics (intensity volume histogram, shape, and texture features), merged using their minimum values, and age of patients but showed poorer results than for differentiation by lesion, with an AUC and AUCpr of 0.85 (95% CI, 0.82–0.88) and 0.88 (95% CI, 0.84–0.92), respectively. For a decisional threshold of 0.5, sensitivity was 0.84 (95% CI, 0.78–0.90), specificity was 0.67 (95% CI, 0.56–0.76), PPV was 0.79 (95% CI, 0.74–0.84), and NPV was 0.74 (95% CI, 0.67–0.83), respectively. Supplemental Tables 3–6 show the selected features and results of the best original and TLR radiomics models for lesion-based and patient-based analysis.
To differentiate HL from DLBCL, the lesion-based radiomics model with the best performance used the RF classifier (Gini impurity decrease) and comprised 2 TLR radiomics features discretized with a fixed bin width of 0.05 SUV: 1 first-order gray-level statistics features (Stats_min) and 1 textural feature (GLCM_infoCorr2). It showed sensitivity, specificity, PPV, and NPV of 0.89 (95% CI, 0.85–0.92), 0.88 (95% CI, 0.84–0.92), 0.87 (95% CI, 0.83–0.90), and 0.90 (95% CI, 0.87–0.92), respectively. For the test set, performance was excellent, with an AUC and AUCpr of 0.95 (95% CI, 0.93–0.96) and 0.95 (95% CI, 0.92–0.96), respectively, close to those of the validation set (AUC and AUCpr of 0.97, both) and significantly better than the best model with original radiomics (AUC, 0.67; and AUCpr, 0.62). The best patient-based radiomics models used a naive Bayes classifier and a forward MRMR with Pearson correlation for FS. The model included original radiomics features merged with their maximal values and discretized with a fixed bin width of 0.5 SUV (first-order, intensity volume histogram, and textural features: IH-entropy, IVH_AIRV_70, GLCM_infoCorr1, NGLDM_SM, and NGLDM_DNN) and patient age. It showed very good performance, with an AUC and AUCpr of 0.86 (95% CI, 0.80–0.91) and 0.87 (95% CI, 0.78–0.91), respectively. For a decisional threshold of 0.5, this model showed sensitivity of 0.79 (95% CI, 0.71–0.86), specificity of 0.85 (95% CI, 0.73–0.86), PPV of 0.87 (95% CI, 0.79–0.89), and NPV of 0.76 (95% CI, 0.70–0.83), respectively.
DISCUSSION
In cancer imaging, 18F-FDG PET/CT takes advantage of a high sensitivity, but the specificity is intrinsically limited by significant uptake by various inflammatory and infectious lesions. Obviously, 18F-FDG uptake alone cannot reliably identify the pathology of the tumor. In this study, we developed radiomics signatures to characterize lesions with highly increased 18F-FDG uptake, as a proof of concept of ML to differentiate inflammation from cancer and to differentiate 2 cancer types. At the lesion level, we found highly accurate signatures, with an AUC of 0.94 for the first task and 0.95 for the second one. At the patient level, we created models with very good performance to differentiate cancer from sarcoidosis (AUC, 0.85) and HL from DLBCL (AUC, 0.86), which were respectively equivalent and significantly better than human performance. All physicians showed an excellent sensitivity (0.97–1.00) to identify patients with cancer and a good but lower specificity (0.75). Overall, the global performance was good, with an AUC of 0.87. However, there was only moderate agreement among the observers, especially because of the poorer performance of the youngest observer (resident in training with 3 y of experience). Furthermore, the observers greatly varied in their level of certainty when deciding whether a PET/CT scan result was cancer or sarcoidosis. Interestingly enough, this level of certainty correlated significantly with performance; that is, higher confidence was associated with better performance. To differentiate HL from DLBCL, the overall performance of the physicians deteriorated, with an AUC of 0.70, which was related to moderate sensitivity. Again, large variability among observers was observed, with one of them performing significantly better than the others. However, the difference was unrelated to experience level, whereas there was a significant correlation with the degree of certainty. Observer D had a sample of diseases different from the other observers. Yet, the fact that he was not aware of this difference, and the fact that his performance in his subsample and in the interobserver variability analysis was unaffected, were reassuring as to any possible confounding effect on the obtained results.
The findings confirmed that radiomics analysis of the metabolic signal could effectively distinguish not only between inflammatory and neoplastic lesions (20–22) but also among different types of cancer (10,12,23–26). Regarding lymphomas, in a population of 25 patients, Lartizien et al. used 18F-FDG PET/CT radiomics and a support vector machine classifier to distinguish aggressive lymphoma lesions (B-cell lymphoma and HL) from nonlymphomatous uptake sites (e.g., brown fat, inflammation, infection, and physiologic thymic uptake) with an AUC of 0.91 (27). Lippi et al. reported that ML performed well in discriminating different types of lymphomas from one another, especially HL, but in a small population of patients (11). Recently, de Jesus et al. showed promising results in differentiating follicular lymphoma from DLBCL using radiomics and an ML classifier in a population of 120 patients—findings that might have important clinical use when monitoring for aggressive transformation (14). Their best performing model showed an AUC of 0.86, significantly higher than the performance of the SUVmax-based model (AUC, 0.79). In addition to the significant difference in population size and the differences in types of lymphoma, certain methodologic differences should be highlighted with our work, including the type of ML classifier (based on per-lesion only), the segmentation method, the choice of analyzed lesions, the absence of comparison with human performance, and the use of radiomics of PET and CT simultaneously. Beyond the proof of concept, our results may have clinical implications. Indeed, the high sensitivity of the model might avoid an invasive biopsy in patients with sarcoidosis, provided that these excellent results can be confirmed in a large and independent external population.
The performance of ML algorithms depends on several factors, including data size, randomness during learning, and preprocessing steps (28). We therefore tested a different set of models—a set that differs in the feature types, that is, original radiomics or TLR radiomics; the FS strategy and number of features; and the intensity discretization scheme. We have shown in previous studies that using the TLR as a reference organ improves the predictive performance in cervical cancer and the robustness across centers (16). The improvement in model performance might be because a normalizing effect of SUVs on each patient. In the present study, the TLR models systematically outperformed the original radiomics models in the lesion-based approach but not in the patient-based approach. Nevertheless, the performance of the models when using TLR features was close to that when using the original features, showing the high potential of TLR-based features in terms of applicability in different centers.
Even though the present study followed the guidelines of the Imaging Biomarkers Standardization Initiative and scored 56% according to the radiomics quality score (29), it had several limitations, including its retrospective and monocentric design, with the need for external validation within an independent population. It is possible that the performance of physicians in this study was underestimated in comparison to that in clinical routine because of the complete absence of clinical data. Moreover, the fact that the physicians were nuclear medicine specialists without specific training in radiology might potentially influence performance. Conversely, the performance of radiomics and ML might be improved by integrating more clinical data (e.g., sweating and weight loss) and biologic data, the localization of lesions (11), the CT or MRI radiomics (14,24,30), and a deep-learning approach (31). In our study, some VOIs were manually adapted if physiologic activity overflowed into a pathologic VOI. However, such occurrences were rare and were unlikely to result in biased results. Also, we excluded from the study the patients without any VOI generated by the automated segmentation process. Given that these patients represented only a small part of the population (n = 12/448 patients; 2.5%), it was unlikely that they would have affected the results. Finally, to show the validity, reproducibility, usefulness, and explainability of our results, we add a T.R.U.E. checklist in the supplemental materials.
CONCLUSION
Characterization of sarcoidosis and lymphoma lesions using ML and radiomics is feasible as seen in their very good to excellent performance, proving to be equivalent to or better than that of physicians, who showed significant interobserver variability in their assessment.
DISCLOSURE
This project received funding from the European Union’s Horizon 2020 research and innovation program under Marie Sklodowska-Curie grant 766276. No other potential conflict of interest relevant to this article was reported.
KEY POINTS
QUESTION: Are specialists in medical imaging able to differentiate sarcoidosis from lymphoma on the basis of visual analysis of 18F-FDG PET/CT images, and can ML models using radiomics help them in this task?
PERTINENT FINDINGS: Physicians characterized these diseases with variable performance, from moderate to very good. ML and radiomics models achieved similar and better performance, in a more reproducible way.
IMPLICATIONS FOR PATIENT CARE: ML and radiomics models can differentiate sarcoidosis from lymphoma, making it possible to consider, after external validation, their use to avoid unnecessary biopsies in patients with high suspicion of sarcoidosis.
ACKNOWLEDGMENTS
We thank Dr. Adeline Deward from the GIGA scientific illustration service for designing the graphical abstract.
Footnotes
Published online May. 19, 2022.
- © 2022 by the Society of Nuclear Medicine and Molecular Imaging.
REFERENCES
- Received for publication November 26, 2021.
- Revision received May 10, 2022.


