


Abstract
Tumor hypoxia and perfusion are independent prognostic indicators of patient outcome. We developed the methodology for and investigated the utility of multiparametric imaging of tumor hypoxia and perfusion with 18F-fluoromisonidazole (18F-FMISO) dynamic PET (dPET) in head and neck cancer. Methods: One hundred twenty head and neck cancer patients underwent 0- to 30-min 18F-FMISO dPET in a customized immobilization mask, followed by 10-min static acquisitions starting at 93 ± 6 and 160 ± 13 min after injection. A total of 248 lesions (≥2 cm3) were analyzed. Voxelwise pharmacokinetic modeling was conducted using an irreversible 1-plasma 2-tissue-compartment model to calculate surrogate biomarkers of tumor hypoxia (k3), perfusion (K1), and 18F-FMISO distribution volume. The analysis was repeated with truncated dPET datasets. Results: Substantial inter- and intratumor heterogeneity was observed for all investigated metrics. Equilibration between the blood and unbound 18F-FMISO was rapid in all tumors. 18F-FMISO distribution volume deviated from the expected value of unity, causing discrepancy between k3 maps and total 18F-FMISO uptake and reducing the dynamic range of total 18F-FMISO uptake for quantifying the degree of hypoxia. Both positive and negative trends between hypoxia and perfusion were observed in individual lesions. All investigated metrics were reproducible when calculated from a truncated 20-min dataset. Conclusion: 18F-FMISO dPET provides the data necessary to generate parametric maps of tumor hypoxia, perfusion, and radiotracer distribution volume. These data clarify the ambiguity in interpreting 18F-FMISO uptake and improve the characterization of lesions. We show total acquisition times can be reduced to 20 min, facilitating the translation of 18F-FMISO dPET into the clinic.
The presence of hypoxia is a common feature of solid tumors including head and neck cancer (HNC) (1). In cancer, hypoxia is a pivotal factor that influences the effectiveness of radiation, chemo-, and immune therapies (2,3). Hypoxia promotes angiogenesis (4), genomic instability, and tumor metastasis (5) and is associated with poor overall survival (6,7).
Noninvasive quantitative imaging of tumor hypoxia with 18F-fluoromisonidazole (18F-FMISO) PET is clinically feasible (8,9) and reproducible (10,11). 18F-FMISO uptake has been reported to be an independent prognostic biomarker in HNC patients in both retrospective (1) and prospective (12) studies. PET is the preferred method of evaluating tumor hypoxia because of its high specificity and sensitivity, and 18F-FMISO continues to be the most extensively studied hypoxia radiotracer (13). The predominant practice consists of a single static PET acquisition at 2–4 h after injection, with a target-to-blood ratio (TBR) of 1.2–1.4 typically being the hypoxia-defining threshold (1,8,9).
The validity of a threshold-based approach relies on 2 implicit assumptions: 18F-FMISO equilibration is sufficiently fast that at the time of imaging the concentration of unbound 18F-FMISO in the tissue has reached a fixed ratio relative to that in the blood, and that this ratio, also known as the distribution volume (DV), is the same across all tissues, including tumors. Patlak and Blasberg demonstrated that once equilibration is achieved, DV becomes the threshold above which any accumulation of tracer is due to irreversible binding (14). The use of TBR thresholds assumes that all tissues have a DV of approximately 1.0 and incorporates a margin of error to avoid misidentification of hypoxia due to image noise. However, if the foregoing assumptions are invalid, a threshold-based metric will not reflect the underlying hypoxia status directly.
In addition, late static scans do not provide information on tumor perfusion that may be important in distinguishing tumor subtypes with different diagnostic and therapeutic requirements (15). As 18F-FMISO passively and rapidly diffuses out of the vasculature and through cell membranes due to its lipophilicity (octanol–water partition coefficient of ∼0.4 (13)), its regional uptake at initial times after injection is expected to reflect tissue perfusion (16). A complex relationship between tumor hypoxia, perfusion, and glucose metabolism supports the use of composite metrics that offer additional information on tumor adaptation to the microenvironment (17,18) and may be better predictors of overall survival (19,20). However, protocols incorporating several PET radiotracers administered in multiple imaging sessions can become overly complex and may be restricted by regulatory limits on ionizing radiation exposure (21). Moreover, despite reports that pharmacokinetic model–based metrics derived from 18F-FMISO or 18F-FDG dynamic PET (dPET) studies confer advantage over static uptake-based indices (19,22–24), dPET protocols have not yet been widely adopted, in part due to their clinical impracticality.
In the current study, 120 HNC patients underwent simultaneous multiparametric imaging of tumor hypoxia and perfusion with 18F-FMISO dPET. We hypothesized that pharmacokinetic modeling of 18F-FMISO dPET reveals additional layers of inter- and intratumor heterogeneity and helps interpret static 18F-FMISO images, and that 18F-FMISO dPET can be performed with acquisition times comparable to whole-body 18F-FDG PET while maintaining a high degree of accuracy and precision.
MATERIALS AND METHODS
Patient Selection
This retrospective pilot study was approved by Memorial Sloan Kettering Cancer Center’s Institutional Review Board (Protocol 04-070; registered under www.clinicaltrials.gov identifier NCT00606294), and all subjects signed a written informed consent form regarding the examination and use of anonymous data for research and publication purposes. The methods were performed in accordance with the approved guidelines. Patients aged 18 y or older with a histologically confirmed diagnosis of squamous cell carcinoma of the head and neck and Karnofsky performance status of 70 or greater were eligible. Exclusion criteria included all nasopharyngeal, paranasal sinus, salivary cancer, and thyroid malignancies; prior chemotherapy or radiotherapy within the last 3 y; previous surgical resection for the same disease; any prior radiotherapy to the head and neck region; and pregnancy.
One hundred twenty patients, aged 59 ± 10 y (range, 25–86 y) were included in the study between January 2011 and August 2016 (Table 1). Patients were screened for their human papillomavirus (HPV; by in situ hybridization) and p16 status (by immunohistochemistry), prognostic indicators in HNC (25). All patients were scanned on a flat-top couch wearing a customized radiotherapy treatment immobilization mask that minimized motion and allowed for accurate repositioning. Intravenous lines inserted in antecubital veins were used for radiotracer injection.
Subject Demographics and Clinical Characteristics (n = 120)
PET/CT Imaging
All patients underwent baseline 18F-FDG PET/CT scans of the head and neck, followed by baseline 18F-FMISO dPET/CT scans 9 ± 7 d thereafter. No interventions were performed between 18F-FDG and 18F-FMISO PET/CT scans. The 18F-FDG scans consisted of a 465 ± 12 MBq injection of 18F-FDG, administered after a fasting period of 6 h or more. The PET acquisition commenced at 76 ± 12 min after injection on a Discovery ST PET/CT (GE Healthcare Inc.) using 2 bed positions each lasting 5 min. The CT images acquired immediately before this used the following settings: 140 kVp, 250 mAs, and 3.8-mm slice thickness.
Dynamic 18F-FMISO PET/CT scans (FMISO1) at a single bed position were obtained on either a Discovery STE PET/CT or a Discovery 710 PET/CT scanner in time-of-flight mode (both GE Healthcare). 18F-FMISO was prepared as described previously (26). The dPET acquisition was initiated concurrent to the intravenous bolus injection of 389 ± 15 MBq of 18F-FMISO. Data were acquired for 30 min and binned into 6 × 5, 3 × 10, 4 × 60, 2 × 150, 2 × 300, and 1 × 600 s frames. Two additional 10-min static image sets, FMISO2 starting at 93 ± 6 min and FMISO3 starting at 160 ± 13 min after injection, were also acquired. Patients rested in quiet waiting rooms between scans. Before each 18F-FMISO PET scan, a low-dose CT scan was obtained for attenuation correction and image registration purposes (120 kVp, 3.8-mm slice thickness, and 40, 10, and 80 mAs for the first, second, and third scans, respectively).
All PET emission data were corrected for attenuation, scatter, and random events, and then iteratively reconstructed into a 256 × 256 × 47 matrix (voxel dimensions, 1.95 × 1.95 × 3.27 mm3) using the ordered-subset expectation maximization algorithm provided by the manufacturer (2 iterations, 20 subsets for Discover ST and Discovery STE scanners, 16 subsets incorporating time-of-flight and point-spread function modeling for the Discovery 710 scanner, and a gaussian postprocessing filter of 6.4 mm in full width at half maximum).
Image Analysis
All 3 segments of the 18F-FMISO scan were spatially coregistered using the rigid-body transformation calculated with the General CoRegistration tool (Advantage Workstation, version 4.7; GE Healthcare) applied to their corresponding CT scans to form a concatenated 18F-FMISO dPET scan. The 18F-FDG PET scan was coregistered to the 18F-FMISO dPET scan using the respective CT images by the same technique. Lesions were delineated on the 18F-FDG PET images, using the adaptive threshold algorithm in the PET VCAR (volume computer assisted reading; Advantage Workstation, version 4.7) semiautomated software, based on the companion CT as a fiduciary marker and a count-based edge recognition algorithm.
Pharmacokinetic Modeling
Pharmacokinetic modeling of 18F-FMISO dPET images was performed in PMOD (version 3.604; PMOD Technologies GmbH), using an irreversible 1-plasma 2-tissue-compartment model, in which the total concentration of activity measured by the PET scanner as a function of time t after injection, C(t), is given by Eq. 1where vB is the fractional vascular volume, Cp(t) is the activity concentration in the plasma, C1(t) is that of unbound activity in tissue, and C2(t) is that of the irreversibly bound hypoxia-localized radiotracer. C1 and C2 are calculated as
 Eq. 2
Eq. 2 Eq. 3where * denotes convolution. By fitting the model to the data, 3 kinetic rate constants are derived: K1, describing transport from the vascular compartment Cp to the extravascular tissue compartment C1 (highly perfusion dependent and therefore used as a surrogate for local tumor perfusion); k2, describing the transport of 18F-FMISO from the extravascular tissue compartment back to blood; and k3, describing the rate of irreversible binding of 18F-FMISO within tumor compartment C2 (a surrogate for hypoxia-mediated entrapment). A composite parameter DV representing the total 18F-FMISO distribution volume (i.e., overall concentration of unbound 18F-FMISO relative to blood) was also derived,
 Eq. 4Although vB and DV are unitless, K1 (assuming unit density tissue), k2, and k3 are expressed in min−1. 18F-FMISO equilibration time, T*, was calculated as
 Eq. 5and represents the time after which unbound 18F-FMISO has reached more than 99% of its final ratio relative to blood.
To avoid invasive blood sampling, the input function (IF) was derived from the dPET images, segmenting the ipsilateral (with respect to the lesion) jugular vein on the early frame with the highest image intensity (by selecting ∼100 hottest voxels). IF time–activity curves were defined using the available temporal data and fitted with a triphasic exponential function, to obtain a modeled IF as Eq. 6where IF(t) is the modeled activity concentration in the blood at time t, Ai and Ti terms represent the fitting parameters (Levenberg–Marquardt optimization, 50 random fits, 200 iterations), and t0 defines at what time the model switches from linear to triexponential interpolation between measured values.
Partial-volume correction was performed in PMOD as previously described, with correction factors converging toward 1 at late time points in all cases (27). Calculation of kinetic rate constants on a voxel-level was performed using the 2-tissue-compartment model with ridge-regression fitting as implemented in the PXMOD tool. TBR was derived from the FMISO3, using the measured activity concentration in the IF volume of interest (VOI), Cp(t) as the reference, Eq. 7For radiotracers with irreversible trapping such as 18F-FMISO, TBR can be expressed via the standard Patlak formulation (13), which for t > T* becomes linear with the form:
 Eq. 8Because of its dependence on K1, k2, Cp, and DV in addition to k3, TBR in principle reflects hypoxic status less directly than k3, which depends solely on hypoxia-mediated entrapment.
Pharmacokinetic modeling was also performed for normal tissues in the head and neck region, including sternocleidomastoid muscle, adipose tissue posterior to the cervical vertebrae, and submandibular and parotid glands. For this purpose, VOIs were manually drawn on the CT image and copied to the corresponding dPET dataset to derive the time–activity curves. Kinetic rate constants were then calculated for each structure by fitting VOI-derived time–activity curves.
To investigate the feasibility of using shorter PET acquisition times, pharmacokinetic modeling for all intratumor voxels was repeated for truncated 20-min dynamic datasets that consisted of the first 10 min of FMISO1 and FMISO3 (the acquisition segment from ∼160 to 170 min after injection). Input functions were derived from available temporal data. All metrics as calculated with truncated dataset (TD) were compared with those derived from full dataset (FD).
Statistical Analysis
The correlation strength between different indices was analyzed using Pearson r. Comparisons of metrics from HPV and p16-positive/-negative groups was performed with the unpaired 2-tailed Student t test. A P value of less than 0.05 was assumed to represent statistical significance. Regression analysis was performed to calculate slope and intercept coefficients (measure of correlation direction) together with 95% confidence intervals. The root-mean-square deviation of the residuals for intratumor voxelwise measurements of all kinetic rate constants derived from FD and TD was calculated for each lesion (measure of reproducibility). Bland–Altman analysis was performed on pooled data to estimate the mean difference between parameters as calculated with TD and FD (measure of accuracy) and 95% limits of agreement (measure of precision).
RESULTS
Kinetic Rate Constants and 18F-FMISO Uptake for Tumor and Normal Tissue
In total, 248 18F-FDG–avid lesions were included in the analysis, ranging from 2 to 121 cm3. For every intratumor voxel, both TBR and a full set of model parameter values were determined, summarized in Table 2. Also included are the corresponding values for sternocleidomastoid muscle, adipose tissue, submandibular gland, and parotid gland. For all normal tissues, k3 was close to zero, indicating insignificant levels of 18F-FMISO entrapment. DV and TBR were close to 1.0 in sternocleidomastoid muscle and submandibular and parotid glands. However, in adipose tissue both DV and consequently TBR were much lower. None of the foregoing metrics was significantly different between HPV-positive (n = 73) and HPV-negative (n = 15), or between p16-positive (n = 96) and p16-negative (n = 9) groups.
Summary of Investigated Metrics for All Analyzed Tissues
Relationships Between TBR, Hypoxia (k3), Perfusion (K1), and 18F-FMISO DV
Sagittal cross-sections through parametric images of TBR, k3, K1, and DV for 4 patient tumors highlight the intra- and intertumor heterogeneity and the different spatial relationships that may occur between the variables (Fig. 1). Line profiles through parametric maps of patient tumor 1 (Fig. 2A) indicate that toward the tumor center, k3 continues to rise past the point of maximum TBR (which decreases due to decreasing DV), indicating a greater dynamic range of k3 than dynamic range of TBR for the purpose of quantifying the degree of hypoxia. The variation in DV broadens the voxelwise k3–TBR scatterplot for this tumor so that a particular value of TBR can be associated with a wide range of k3 values (Fig. 2B).
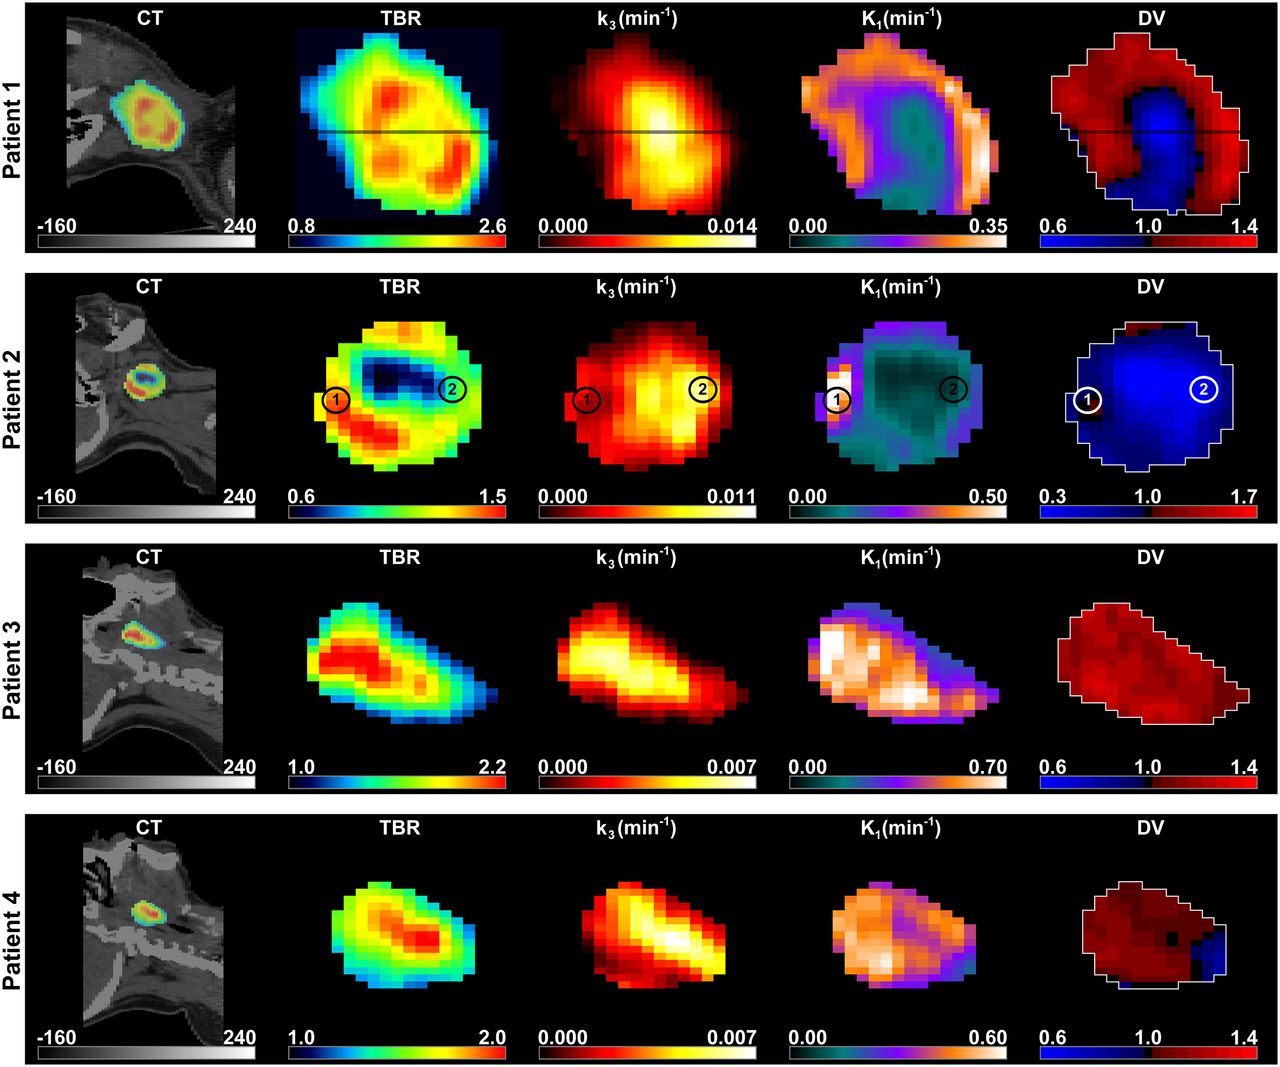
Sagittal images of 4 representative patients. (Left to right) Late 10-min 18F-FMISO PET/CT scan; TBR; k3 map representing hypoxia-mediated entrapment of 18F-FMISO; K1 map, a surrogate measure of perfusion; and 18F-FMISO DV, representing overall concentration of unbound 18F-FMISO relative to blood. Window levels are set according to scale bars and are adjusted for maximum visibility.

(A) Line profile through TBR, k3, and DV parametric maps for patient 1 from Figure 1 with HPV-negative, p16-positive T1N2c tumor originating in base of tongue. Minimum and maximum values of each parameter are normalized between 0% and 100% corresponding to actual parameter values provided in brackets in top of figure. (B) k3–TBR voxelwise scatterplot for patient 1, color-coded according to DV. (C) Modeled time–activity curves (solid line) superimposed on measured time–activity curves (squares) from 2 voxels in hyperperfused and relatively normoxic (area 1 on Figure 1; blue) and hypoperfused and hypoxic tumor subregions (area 2 on Figure 1; red) for patient 2 with HPV-positive, p16-positive T1N2a tumor originating in tonsil. Parameter values for each voxel are given in top of figure. Also displayed is time–activity curve for IF (black). (D) TBR as function of time after injection is shown for patient 3 with HPV-positive, p16-positive T2N2b tumor originating in tonsil, whose lesion exhibited uniformly high DV (1.17). Also included are corresponding data for normoxic submandibular (SMG) and parotid glands. (E) Scatterplot of perfusion (K1) and hypoxia (k3) parameters for patient 3 (crosses; HPV-positive, p16-positive T2N2b tumor originating in tonsil) and patient 4 (dots; HPV-positive, p16-positive T3N1 tumor originating in tonsil), exhibiting a positive (Pearson r = 0.71) and negative (Pearson r = −0.61) trend between K1–k3, respectively.
Patient tumor 2 represents a case in which there is a more pronounced contradiction between the k3 and TBR distributions. Time–activity curves corresponding to 2 individual voxels (identified as 1 and 2) are presented in Figure 2C. 18F-FMISO uptake in voxel 1 is initially high and rapidly diminishes, converging toward the IF time–activity curve but eventually rising above it due to nonzero k3. Voxel 2 exhibits initially low uptake that slowly increases with time but remains relatively low on the TBR image; however, it appears more hypoxic on the k3 image. The observed discrepancy is not caused by a continuing slow washout of a high initial uptake in voxel 1 (T* was < 30 min in both cases). Rather, it is a direct consequence of the difference in DV (1.03 and 0.36 for voxels 1 and 2, respectively).
Visualizing TBR as a function of time after injection for patient tumor 3 reveals rapid accumulation of 18F-FMISO both in the lesion and in the submandibular and parotid glands, reaching a TBR greater than 1.3 after approximately 3–4 min after injection. However, whereas 18F-FMISO gradually clears from the salivary glands, in the lesion it remains high, indicating a uniformly high DV (Fig. 2D).
Both patient tumors 3 and 4 exhibit apparent agreement between TBR and k3. However, for patient tumor 3, the intratumor hypoxic regions were positively correlated with the degree of perfusion, whereas for patient tumor 4 these were negatively correlated (Fig. 2E). Nevertheless, hypoxia (k3) and perfusion (K1) are largely independent at the population level, underscoring the fact that inverse K1 parametric maps are not equivalent to an image of tumor hypoxia. Correlations between all investigated metrics are reported in Figure 3.
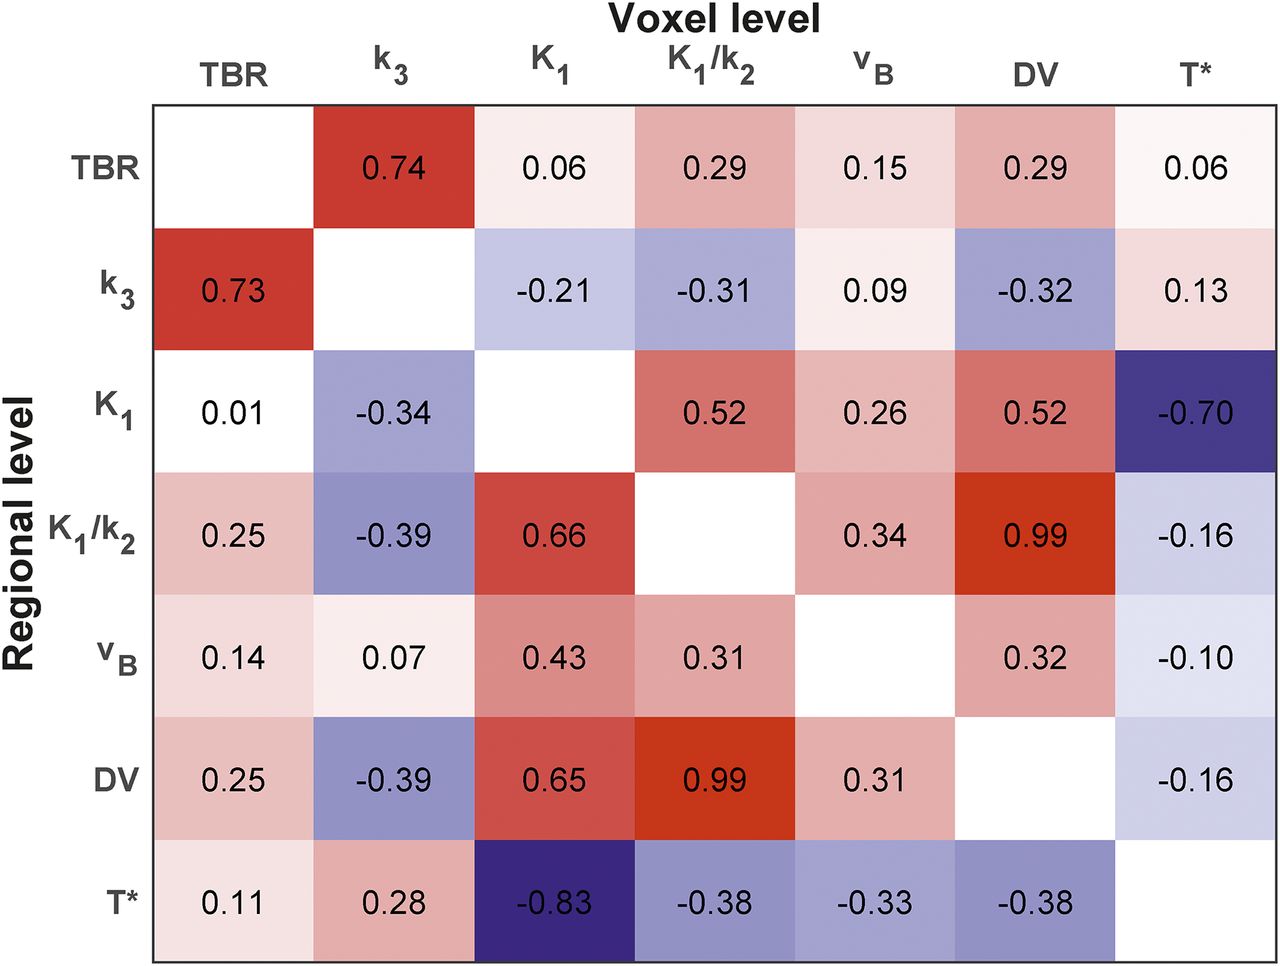
Correlation matrix of Pearson correlation between all investigated parameters. Upper right and lower left triangle regions with respect to the main diagonal of a matrix show coefficients derived on the voxel and regional level, respectively.
Population-Based Comparison of k3 and TBR
Pearson r between mean voxelwise k3 and TBR from all 248 lesions was 0.73 (95% confidence level, 0.67–0.78; Fig. 4A). The scatterplot is color coded to display the mean voxelwise DV for each tumor. Substantial variation in DV across lesions reduces the k3–TBR correlation over the patient population. For example, lesions 1 and 2 (Fig. 4A) have similar k3 (0.0068 min−1 and 0.0074 min−1, respectively), but their TBRs are markedly different due to different DVs (TBR = 2.49; DV = 1.24 and TBR = 1.08; DV = 0.59, respectively). Consider also lesion 3, which has a TBR (1.08) identical to lesion 2 but has a DV of 1.09 and is normoxic (k3 = 0.0000 min−1).
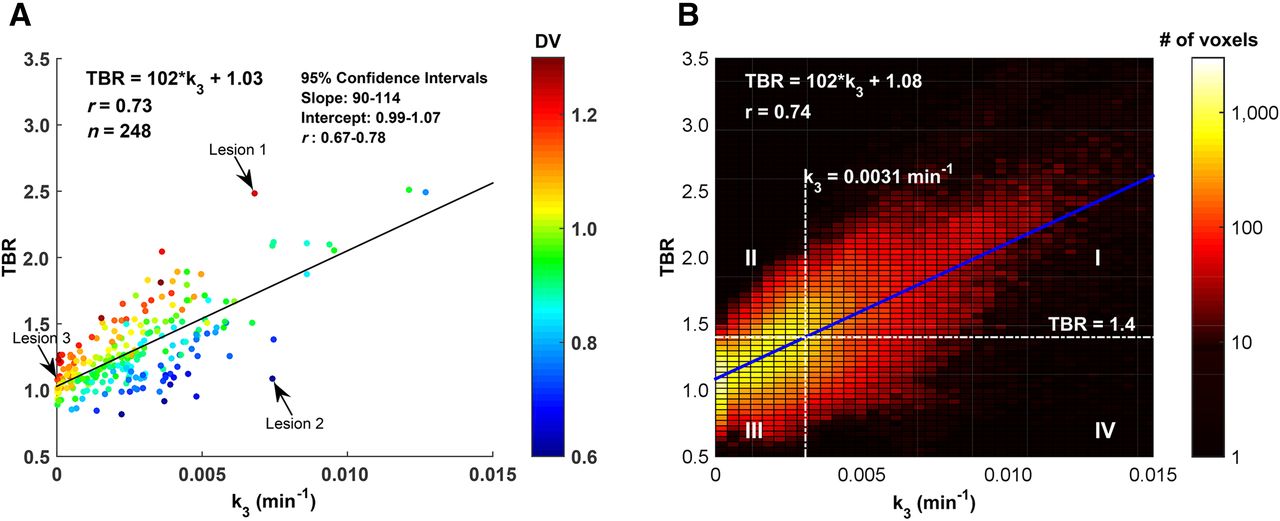
(A) Scatterplot of mean intratumor k3 and TBR for all analyzed lesions, color-coded according to mean intratumor DV. (B) Corresponding k3–TBR intensity histogram for voxelwise values from pooled data. Included are nominal hypoxia thresholds based on TBR = 1.4 and regression-derived k3 = 0.0031 min−1.
The analogous scatterplot for the pooled voxelwise data is presented in Figure 4B (r = 0.74), with superimposed nominal hypoxia thresholds based on a TBR of 1.4 and the regression-equivalent k3 of 0.0031 min−1. These thresholds split the plane into 4 quadrants where the first and third quadrants contain voxels that would be classified identically by both TBR and k3 criteria; the second and fourth quadrants contain voxels where the criteria disagree. The mean DV for voxels in the first, second, third, and fourth quadrants were 0.98 ± 0.16, 1.12 ± 0.10, 0.98 ± 0.15, and 0.72 ± 0.16, respectively. Together, the second and fourth quadrants contain approximately 25% of all tumor voxels.
Population Distributions of 18F-FMISO Equilibration Time and DV
T* was greater than 90 min in more than 99% of tumor voxels (Fig. 5A). This could be construed as prima facie evidence for the use of static 18F-FMISO PET imaging in HNC at times greater than 90 min after injection. However, although the mean DV of 0.96 ± 0.18 was indistinguishable from 1.0, the distribution is skewed toward lower values (skewness of 3.56), with 17% of all voxels having a DV less than 0.8 and 8% with a DV more than 1.2 (Fig. 5B).
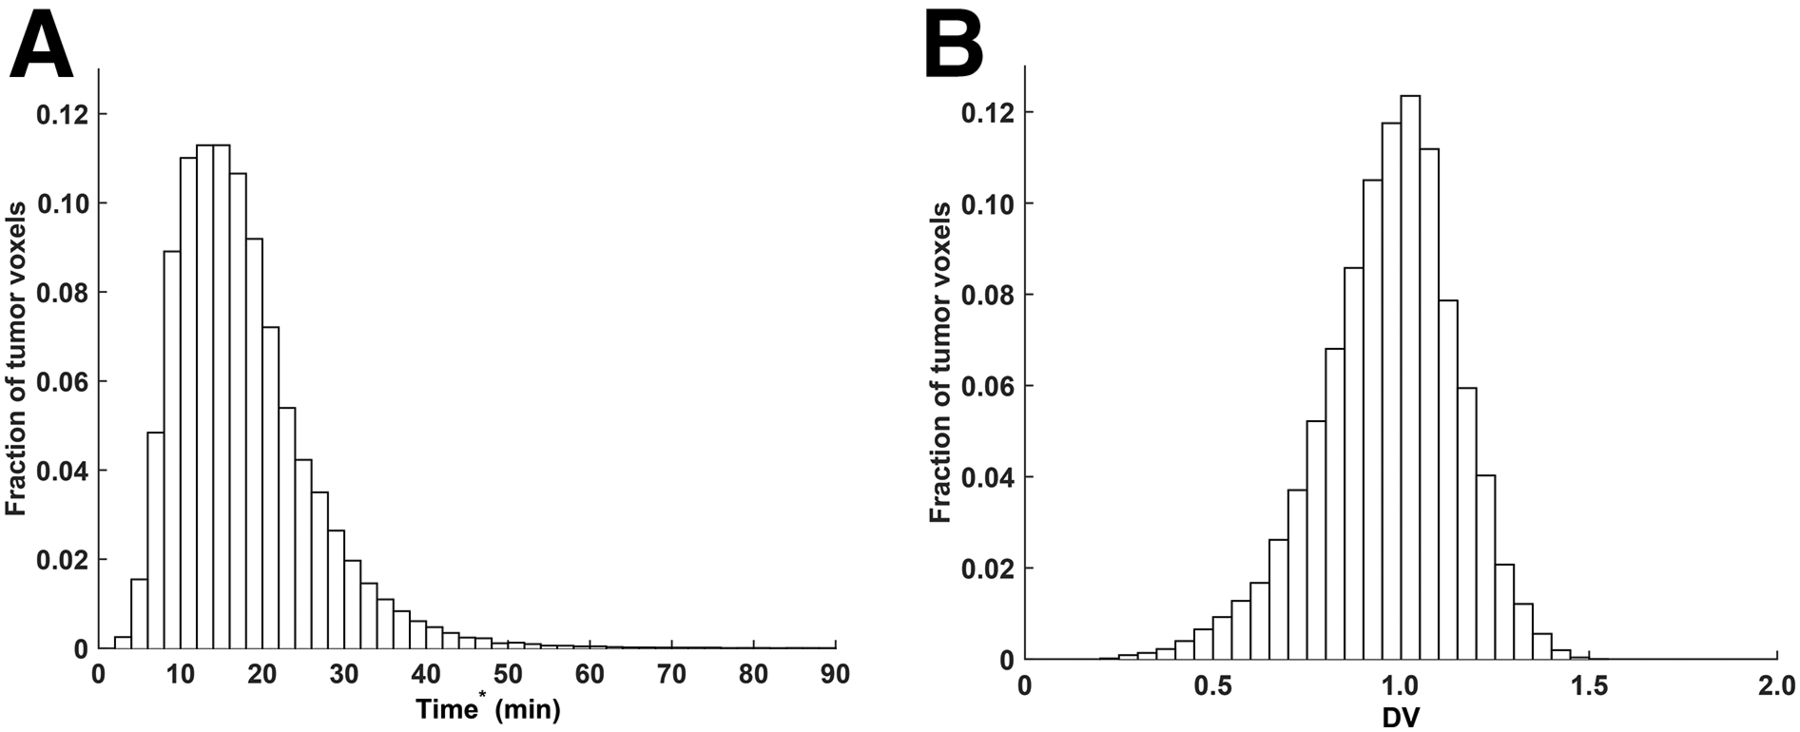
Frequency histogram of 18F-FMISO equilibration time T* (A) and 18F-FMISO DV (B) for pooled voxelwise data.
18F-FMISO dPET with Truncated Acquisition Protocols
Scatterplots and intensity histograms from pooled data are given for k3 and K1 as calculated with either FD or TD (Fig. 6A). Also displayed are k3 and K1 parametric maps as calculated with FD and TD, as well as their respective difference maps (Fig. 6B), for the patient examples 1–4 presented in Figure 1. The reproducibility of all kinetic rate constants is summarized in Table 3. A high degree of correlation was observed across a broad range of values when calculated using the TD, both from whole-tumor and from voxelwise data (r ≥ 0.98). A high reproducibility of k3 and K1 on a lesion-by-lesion basis was indicated by low root-mean-square deviation values. For pooled data, low mean differences indicate relatively high accuracy in the estimates, whereas narrow 95% limits of agreement on the mean differences indicate high precision.
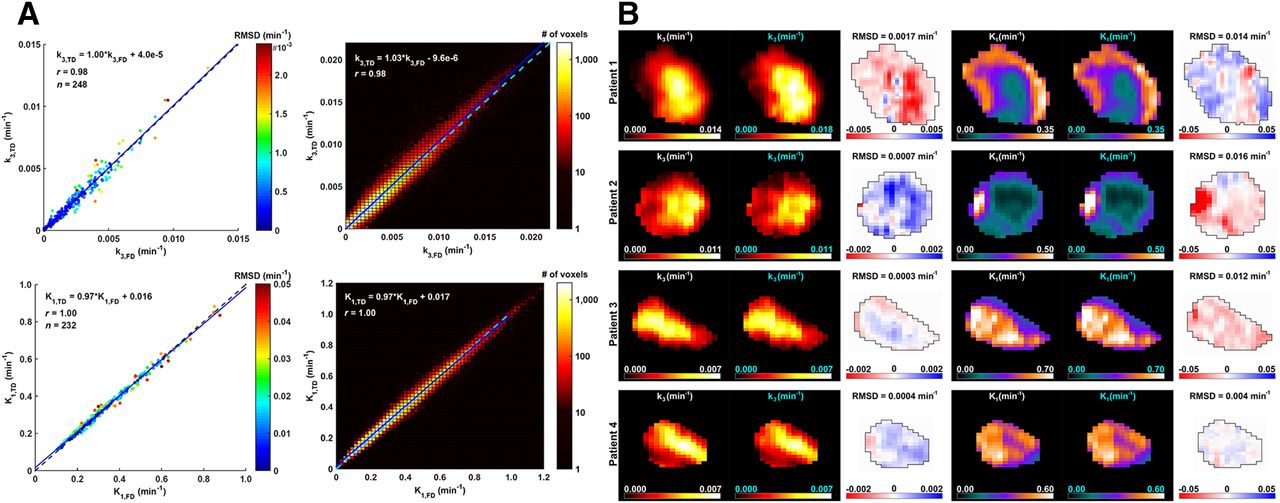
(A) (Left) Scatterplot of average intratumor k3 (top) and K1 (bottom) for FD (abscissa) versus truncated 20-min dataset (TD; ordinate), color-coded according to root-mean-square deviation (RMSD) of residuals. (Right) Corresponding intensity histograms of voxelwise k3 (top) and K1 (bottom) values from pooled data. Identity (dashed) and regression (solid) lines are superimposed in all foregoing cases. (B) (Left to right) k3 parametric maps as calculated with FD and TD, k3 difference map (i.e., k3(FD) − k3(TD)), and equivalent maps for K1, for all patient example tumors shown in Figure 1.
Reproducibility of Kinetic Rate Constants Using 20-Minute TD*
The analysis was repeated for TDs consisting of 15-min total acquisition time (5 min + 10 min). The results were more variable, with lower accuracy and precision of the parameter estimates (Table 4) due to the insufficient temporal information and resulting inadequate fitting of the IF.
Reproducibility of Kinetic Rate Constants Using 15-Minute TD*
DISCUSSION
The importance of establishing a quantitative measure of tumor hypoxia derives from its potential clinical relevance as an imaging biomarker. Hypoxia has been shown to be a prognostic indicator of treatment outcome for a wide range of malignancies, including HNC (1,7). This has fueled considerable interest in the use of PET radiotracers such as 18F-FMISO, where tumor hypoxia levels in patients can be measured noninvasively, quantitatively, and with high specificity and sensitivity. In the current study of 120 patients, we performed multiparametric imaging of tumor hypoxia as well as tumor perfusion, itself an independent prognostic indicator of treatment outcome (18,19). Our results demonstrate that the rate of 18F-FMISO equilibration is sufficiently fast in head and neck tumors to allow for late static imaging as a means of measuring hypoxia, but this is thwarted by the substantial variability of DV; because of its dependence on nonuniform DV, TBR reflects hypoxic status of tumors less directly than k3 and has a lower dynamic range; simultaneous measurement of hypoxia and perfusion reveals substantial intra- and intertumor heterogeneity, contributing invaluable information for phenotypic characterization of lesions; and 18F-FMISO dPET can be performed with short (20-min) composite imaging protocols while maintaining accuracy and precision in parameter estimation.
The widespread application of TBR threshold values is a consequence of the simplicity of static PET image acquisition and analysis. The validity of threshold-based definition of hypoxia is predicated on the assumption of a uniform DV with a mean of 1.0 and dispersion not greater than what can be attributed to image noise. The observed wide distribution of DV at the intratumor voxel level results in either over- or underestimation of the degree of hypoxia. Although it can partially be explained by statistical fluctuations, the root cause of this variability is currently unknown. A DV less than 1.0 could represent voxels with aberrant composition of soluble and insoluble components within the tumor microenvironment or necrotic microregions with limited perfusion. On the other hand, intratumor voxels of patient tumor 3 had a DV consistently higher than 1.0 (Fig. 2D). Other than hypoxia-driven irreversible binding to intracellular macromolecules, we are unaware of any process by which 18F-FMISO would concentrate in tumor tissue to explain this observation. Speculative mechanisms may include some degree of facilitated transmembrane transport in cells within tumors, local capillary tortuosity leading to elevated temporary nonspecific accumulation in regions lacking functional lymphatics, or subvoxel-sized cyst or glandlike regions that accumulate radiotracer at higher levels than blood. Variable intervessel distance within the tumor may be an additional factor that affects the measured DV values, particularly if drug consumption is diffusion-limited. Also, the density of the metabolizing cells and levels of cellular nitroreductase may vary significantly. Because of its dependence on nonuniform DV, TBR is in principle a less direct biomarker of hypoxia-mediated accumulation of 18F-FMISO than k3. Moreover, TBR also depends on imaging time after injection, whereas k3 and DV are time-independent metrics.
Imaging surrogates of tumor perfusion are clinically relevant as a way to measure the delivery of drugs to the tumor (28,29). Several PET studies have reported the benefit of assessing tumor perfusion and hypoxia as predictors of response to therapy (20,23,24,30,31). These metrics may provide potentially valuable information for tumor characterization, treatment selection, and response monitoring. For example, hypoxia-activated prodrugs or antiangiogenic agents could be applied in cases of diffuse hypoxia with high perfusion, whereas patients presenting with a more focal hypoxia combined with low perfusion may potentially benefit more from dose escalation to the tumor subvolume. Positive as well as negative correlations were found between k3 and K1. A negative trend supports the classic hypothesis that hypoxia develops in hypoperfused tumor subvolumes with chaotic and dysfunctional microvasculature. Here the hypothetical mechanism is related to increased distances between functional capillary vasculature and tumor cells, such that distal cells receive less oxygen, leading to diffusion-limited hypoxia. A positive correlation, however, supports previous observations that hypoxia may be present in well-perfused regions (32). This may reflect different types of hypoxia characterized in HNC tumors by Ljungkvist et al. (patchy, ribbonlike, and mixed), who demonstrated that, at the microscopic level, hypoxia and perfusion can coexist in close proximity (33). Here, hypoxia may drive angiogenesis, hyperperfusion, and perfusion heterogeneity (4). Such regions could remain hypoxic due to a low oxygen extraction ratio or high oxygen consumption rate. A heterogeneous mixture of vessels with fluctuating hemodynamics can induce longitudinal gradients, resulting in the delivery of either hypoxic or aerobic blood depending on the distance from the nearest arterial source (15). Other biologic explanations have been proposed to describe the presence of hypoxia in well-perfused tumor regions (34,35). These hypothetical mechanisms are of interest in that they may represent a diversity of tumor phenotypes with different biologic, clinical, and prognostic features. Only by multiparametric imaging can such subtle but potentially significant phenotypic discrimination be achieved noninvasively.
Despite the potential benefits of pharmacokinetic modeling, the long image acquisition protocols constitute a significant obstacle toward wider adoption of 18F-FMISO dPET in clinical practice. We show that surrogate biomarkers of hypoxia and perfusion can be estimated accurately and precisely from 20-min truncated 18F-FMISO dPET scans, albeit in 1 early and 1 late 10-min acquisition. Because 18F-FMISO is relatively freely and rapidly diffusible, an initial 10-min dynamic acquisition is sufficient for the calculation of K1. Overall shape of the IF can be approximated from the TD, facilitating the calculation of k3. Because a late 10-min acquisition remains part of the TD, the conventional static image evaluation of hypoxia can still be made.
Our study has some limitations. Most patients presented with HPV-positive tumors, a good prognostic indicator associated with better 3-y rates of overall survival than patients with HPV-negative tumors (25). Only 8 of 120 patients were deceased at the time of writing (median follow-up period, 24 mo; range: 1–72 mo), therefore survival analysis is presently underpowered because of a paucity of events. Coregistration of 1 18F-FDG and 3 18F-FMISO scans potentially resulted in small misalignments, and changes in tumor size and shape may have occurred during the 9 ± 7 d interval between the treatment planning 18F-FDG PET and 18F-FMISO PET scans. However, all patients were scanned in customized immobilization masks, increasing positioning accuracy and minimizing mismatches. All 18F-FDG–derived VOIs were visually inspected on 18F-FMISO PET/CT scans, and no obvious mismatches or changes in tumor size were identified. Although the current pipeline did not allow for full automation, it is likely that dedicated kinetic modeling software can simplify and expedite the analysis significantly, because all steps (including coregistration and concatenation of the 3 18F-FMISO PET/CT scans, tumor segmentation, IF definition and partial-volume correction, and calculation of parametric maps via voxelwise kinetic modeling) can in principle be largely automated.
CONCLUSION
Pharmacokinetic modeling of 18F-FMISO dPET allows for simultaneous multiparametric imaging of tumor hypoxia and perfusion, as well as 18F-FMISO DV. These data can clarify the ambiguity in interpreting the late static 18F-FMISO examinations and improve the characterization of hypoxic subregions for, for example, therapy planning, patient stratification, or response assessment. Our demonstration of the feasibility to obtain equivalent k3 and K1 data based on the use of 20-min acquisitions increases the practicality of performing 18F-FMISO dPET examinations within a busy clinical department.
DISCLOSURE
This study was supported by National Institutes of Health grants 5R01CA157770-04 (principal investigator Nancy Y. Lee) and U01 CA157442-3 (principal investigator Sadek A. Nehmeh) and the cancer center grant P30 CA008748 (principal investigator Craig B. Thompson). No other potential conflict of interest relevant to this article was reported.
Footnotes
Published online Feb. 9, 2017.
- © 2017 by the Society of Nuclear Medicine and Molecular Imaging.
REFERENCES
- Received for publication December 14, 2016.
- Accepted for publication January 2, 2017.


