


Abstract
Tau accumulation in the brain is a pathologic hallmark of Alzheimer disease and other tauopathies. Quantitative visualization of tau pathology in humans can be a powerful method as a diagnostic aid and for monitoring potential therapeutic interventions. We established methods of PET quantification of tau pathology with 11C-PBB3 (2-((1E,3E)-4-(6-(11C-methylamino)pyridin-3-yl)buta-1,3-dienyl) benzo[d]thiazol-6-ol), considering its radiometabolite entering the brain. Methods: Seven Alzheimer disease patients and 7 healthy subjects underwent dynamic 11C-PBB3 PET scanning. Arterial blood was sampled to obtain the parent and metabolite input functions. Quantification of 11C-PBB3 binding was performed using dual-input models that take the brain metabolite activity into consideration, traditional single-input models without such considerations, and the reference tissue model (MRTMO) and standardized uptake value ratio (SUVR). The cerebellar cortex was used as the reference tissue for all methods. Results: The dual-input graphical models estimated binding parameter ( ) stably (∼0.36 in high-binding regions). The MRTMO
  matched the corresponding
  by the dual-input graphical model (r2 = 1.00). SUVR minus 1 correlated well with MRTMO
  (r2 > 0.97). However, BPND by the single-input models did not correlate with
  by the dual-input graphical model (r2 = 0.04). Conclusion: The dual-input graphical model
  is consistent with the reference tissue
  and SUVR-1, suggesting that these parameters can accurately quantify binding of 11C-PBB3 despite the entry of its radiometabolites into the brain.
Senile plaques and neurofibrillary tangles are the 2 pathologic hallmarks of Alzheimer disease (AD). Senile plaques consist of extracellular β-amyloid (Aβ) deposits (1,2). PET has been used for detecting Aβ accumulations and also applied to monitor potential effects of Aβ immunotherapies (3–5). Neurofibrillary tangles consist of intraneuronal aggregates of hyperphosphorylated tau proteins (6). Since the tau pathology in AD is closely related to the neural death and cognitive dysfunction along with the amyloid pathology (7,8), it is a promising therapeutic target for AD (9,10). The tau pathology is also known in other neurodegenerative disorders such as progressive supranuclear palsy and corticobasal degeneration (11,12). Thus, a reliable quantitative visualization of tau accumulation would be essential for accurate diagnosis and the development of disease-modifying drugs targeting tau in diverse neurologic diseases (13,14).
Recently, we developed a new radioligand, 11C-PBB3 (2-((1E,3E)-4-(6-(11C-methylamino)pyridin-3-yl)buta-1,3-dienyl) benzo[d]thiazol-6-ol), for PET tau imaging (15). Our in vitro data indicated that 11C-PBB3 binds reversibly to neurofibrillary tau tangles with high affinity (KD = 2.5 nM) and selectivity (50-fold selectivity over Aβ deposits) (15). Of the other recently reported tau radioligands including THK families (16–19) and T80x (20,21), 11C-PBB3 binds to tau lesions with a wide range of isoform compositions (15). The regional standardized uptake value ratio (SUVR) of 11C-PBB3 in our previous 11C-PBB3 PET studies reflected the known pathologic tau distribution at various stages of AD (22).
Our previous 11C-PBB3 studies in humans and mice indicated that 11C-PBB3 on intravenous administration is rapidly converted to a major radiometabolite in plasma, a significant amount of which has been shown to enter the mouse brain (23). This radiometabolite is expected to enter the human brain, which may complicate quantitative PET data analysis. It is therefore important to examine whether simplified quantitative measures such as SUVR accurately reflect specific binding of 11C-PBB3 to pathologic tau deposits.
The purpose of the present study was to establish methods of quantifying 11C-PBB3 binding considering the entrance of its radiometabolites into the human brain. We used dual-input models (24,25) that apply the unmetabolized parent and radiometabolite in the plasma as input functions. We found that the parameter SUVR minus 1 (SUVR-1) and the reference tissue model binding parameter ( ) agreed with the dual-input model
  , supporting the validity of these simplified models in quantifying tau pathology with 11C-PBB3 PET.
MATERIALS AND METHODS
Participants
Seven AD patients and 7 elderly healthy controls (HCs) were enrolled (3 men/4 women for both groups; mean age ± SD, 76 ± 7 y for AD patients and 70 ± 6 y for HCs). AD was diagnosed according to criteria of the National Institute of Neurologic and Communicative Diseases and Stroke/Alzheimer Disease and Related Disorders Association (26). The Clinical Dementia Rating scale (27) was 0.5 or 1 in AD patients and 0 in HCs. Mini-Mental State Examination scores (28) were 19.4 ± 2.4 in AD patients and 28.4 ± 2.2 in HCs. All HCs were free of major medical and neuropsychiatric illnesses. 11C-labeled Pittsburgh compound B (3) PET scans were also obtained on the day of the 11C-PBB3 PET studies, and all AD patients were positive and all HCs were negative for Aβ. This study was approved by the Radiation Drug Safety Committee and the Institutional Review Board of National Institute of Radiologic Sciences of Japan. Written informed consent or assent was obtained from all subjects. The study was registered with University Hospital Medical Information Network Clinical Trials Registry (UMIN000009052).
PET Imaging
11C-PBB3 was produced as previously described (15,23). After an intravenous injection of 11C-PBB3 (399 ± 45 MBq; specific activity, 88 ± 32 GBq/μmol), 70-min dynamic PET scans were conducted using an ECAT Exact HR+ system (Siemens AG). PET images were reconstructed with a filtered backprojection method with corrections for attenuation and scatter. The dynamic scan consisted of 6 × 10 s, 3 × 20 s, 6 × 1 min, 4 × 3 min, and 10 × 5 min frames.
Measurement of 11C-PBB3 in Plasma
Manual arterial blood samples were concurrently obtained 30 times with PET. Each blood sample was centrifuged, and the radioactivity concentrations in whole blood and plasma were measured. The plasma fractions of the parent and its radiometabolites were determined by high-performance liquid chromatography from 6 samples. Acetonitrile was added to each plasma sample, and the samples were then centrifuged and subjected to radio–high-performance liquid chromatography (μBondapak C18 column [Waters], 7.8 × 300 mm; acetonitrile/ammonium formate mobile phase with gradient elutions = 40/60, 52/48, 80/20, 80/20, 40/60, and 40/60 at 0, 6, 7, 8, 9, and 15 min, respectively; flow rate, 6 mL/min). Two-exponential functions were used to interpolate the fraction of the parent and radiometabolites to obtain input functions.
Quantification Models
To quantify 11C-PBB3 specific binding to tau, we used dual-input models that use both parent and metabolite input functions, single-input models that use a parent-only input function, and the reference tissue model and SUVR-1 that do not require blood data.
Dual-Input Models
We estimated 11C-PBB3 binding parameters  and BPP (namely specific distribution volume [VS] (29)) in 2 ways using dual-input graphical analyses developed by Ichise et al. (24,30). This graphical model is derived from the dual-input compartment model (24,25). This graphical model has the following 2 operational equations, both of which allow estimation of
  and BPP when the system reaches transient equilibrium between the brain and plasma compartments (t*).
 Eq. 1
Eq. 1 Eq. 2where
  , and
, and  are the radioactivity concentrations of the plasma parent, radiometabolite, and brain, respectively.
  =
=  +
+  . In Equation 1,
 Eq. 3where δ is the plasma metabolite/parent concentration ratio at equilibrium (Supplemental Appendix A; supplemental materials are available at http://jnm.snmjournals.org) (24). In Equations 2 and 3, αP and αM represent the total distribution volumes of the parent (
 ) and radiometabolite (
 ), respectively. Assuming that the nondisplaceable distribution volume of the parent (
 ) or the radiometabolite (
 ) is the same in the target and reference tissues,
  and plasma binding potential (BPP) are calculated from the α’s of tau-rich target and tau-free reference tissues as
 Eq. 4
Eq. 4 Eq. 5From Equation 2,
  can also be calculated as follows:
 Eq. 6Here, we defined the parameter expressed by Equation 4 as
  with an asterisk to distinguish it from the original definition of BPND (29), because
  includes an additional metabolite distribution volume term,
  , in the denominator. We considered
  as an extension of the definition of BPND because this
  is also directly proportional to Bavail/KD, where Bavail is the target consentration (Appendix).
Single-Input Models
For the graphical analysis with unmetabolized 11C-PBB3 as an input function, Logan plots were applied (31). For the compartment model analysis, the standard 2-tissue-compartment (2TC) model was applied (32). BPND and BPP values were calculated from total distribution volumes in the target and reference tissues.
Reference Tissue Model
Reference tissue  estimated without blood data is the (tissue ratio-1) at equilibrium and is theoretically equivalent to dual-input
  given by
  , if the metabolite enters the brain (24). We used the original multilinear reference tissue model (MRTMO) to estimate
  using region-of-interest (ROI) data and also to generate voxelwise parametric images of
  using the cerebellar cortex as reference tissue (33). To evaluate the effect of shortening the scan length,
  values from parametric images with truncated scan data (30, 40, 50, and 60 min) were calculated and compared with the
  values from the full 70-min scan length.
SUVR
We obtained SUVR-1 ROI values from the summed PET images for 20–30, 30–50, and 50–70 min normalized to the cerebellar cortex.
PET Data Preparation
In our preliminary 11C-PBB3 data analysis, the 2TC model with arterial data for small ROIs was unstable due to rapidly clearing parent input functions and overall low brain 11C-PBB3 uptake. To improve the statistical quality of PET ROI data, we defined ROIs as follows (Supplemental Fig. 1): individual cerebral cortical masks were first created on segmented T1-weighted MR images using statistical parametric mapping (SPM12; Wellcome Trust Centre for Neuroimaging, U.K.). Then, for AD patients, we generated 3–4 cerebral cortical ROIs pooling all voxels of high (>0.3, high), medium (0.15–0.3, middle), low (0–0.15, low), and nonbinding (<0)  values on preliminarily generated MRTMO parametric images by applying coregistered cerebral cortical masks. These 4 sets of ROIs had a sample volume of 12 ± 6, 50 ± 27, 103 ± 35, and 188 ± 64 cm, respectively. For HCs, we created 1 large entire cortical ROI (440 ± 34 cm), because cerebral cortical
  was uniformly low. We used the cerebellar cortex as the reference tissue because there was negligible tau pathology in the postmortem AD cerebellum (34). Cerebellar cortical ROIs were manually defined on the coregistered T1-weighted MR images (7.8 ± 1.9 cm). All ROIs were further modified on the PET images to avoid high radioactivity spilling in from the adjacent venous sinuses. ROI time–activity curves were generated from the coregistered dynamic PET data. All image data analyses were performed in PMOD 3.6 (PMOD Technologies Ltd.).
Comparison Analysis
We compared  and SUVR-1 values among the different models, the main purpose of which was to examine how closely reference tissue
  and SUVR-1 that use no blood data match corresponding
  by dual-input models that use both plasma parent and metabolite data or single-input models BPND that use only plasma parent data. These comparisons were performed by calculating Pearson correlation coefficients (r2).
RESULTS
Time–Activity Curves
The brain 11C-PBB3 time–activity curves quickly peaked within a few minutes of intravenous injection of 11C-PBB3 (1 SUV in AD and 0.8 SUV in HC) (Figs. 1A and 1B), and then washed out quickly initially and then slowly. Plasma parent time–activity curves peaked quickly and decreased also quickly thereafter (Figs. 1C and 1D). One major radiometabolite of 11C-PBB3 appeared quickly in the plasma and slowly decreased thereafter, accounting for 90% of the total plasma radioactivity at 3 min (Supplemental Figs. 2A and 2B).

Time–activity curves in brain and arterial plasma after injection of 11C-PBB3 in AD patients and HCs. Time–activity curves are shown for cerebral cortical regions with high (▲), middle (●), low (▼), and nonbinding (♦) of 11C-PBB3 and cerebellum (♢) in AD patients (A) and cerebral cortex (♦) and cerebellum (♢) in HCs (B). Time–activity curves of total radioactivity (solid line), metabolite (dotted line), and parent (dashed line) in arterial plasma of AD patients (C) and HCs (D). Data represent mean of all 7 AD patients or 7 HCs.
11C-PBB3 Binding Parameter Estimation
Dual-Input Models
Graphical plots (Eq. 1) with a combined (parent + radiometabolite) plasma input became linear early after the radioligand injection (Fig. 2) when both α and β could be considered constant (24). α estimations were stable within 5%, with t* varying from 11 to 40 min, and we fixed the t* value to 11 min for all subjects. There was no significant difference in δ estimates between AD patients (78 ± 22) and HCs (88 ± 28) (P = 0.5). The estimated  and BPP values (Eqs. 4 and 5) in the high- and middle-binding regions were up to 3 and 2 times higher, respectively, than the parameter values in the low-binding regions, and these 2 sets of parameter values were highly correlated (r2 = 0.97) (Table 1; Supplemental Fig. 3A). Both
  and BPP values were negative in the nonbinding regions of AD and HC. The 2 sets of
  values from Equations 1 (combined plasma input) and 2 (separate parent and metabolite input) closely matched with each other (r2 = 0.97, Supplemental Fig. 4; Table 1).

Dual-input graphical plots with plasma-input function (Eq. 1) in representative AD patients. Plots became linear after t* = 11 min for cerebral cortical regions with high (▲), middle (●), low (▼), and non-tau-binding (♦) regions and cerebellum (♢).
Binding Potential Values Estimated by Dual-Input Models, Single-Input 2TC Model, MRTMO, and SUVR-1 Values
Single-Input Models
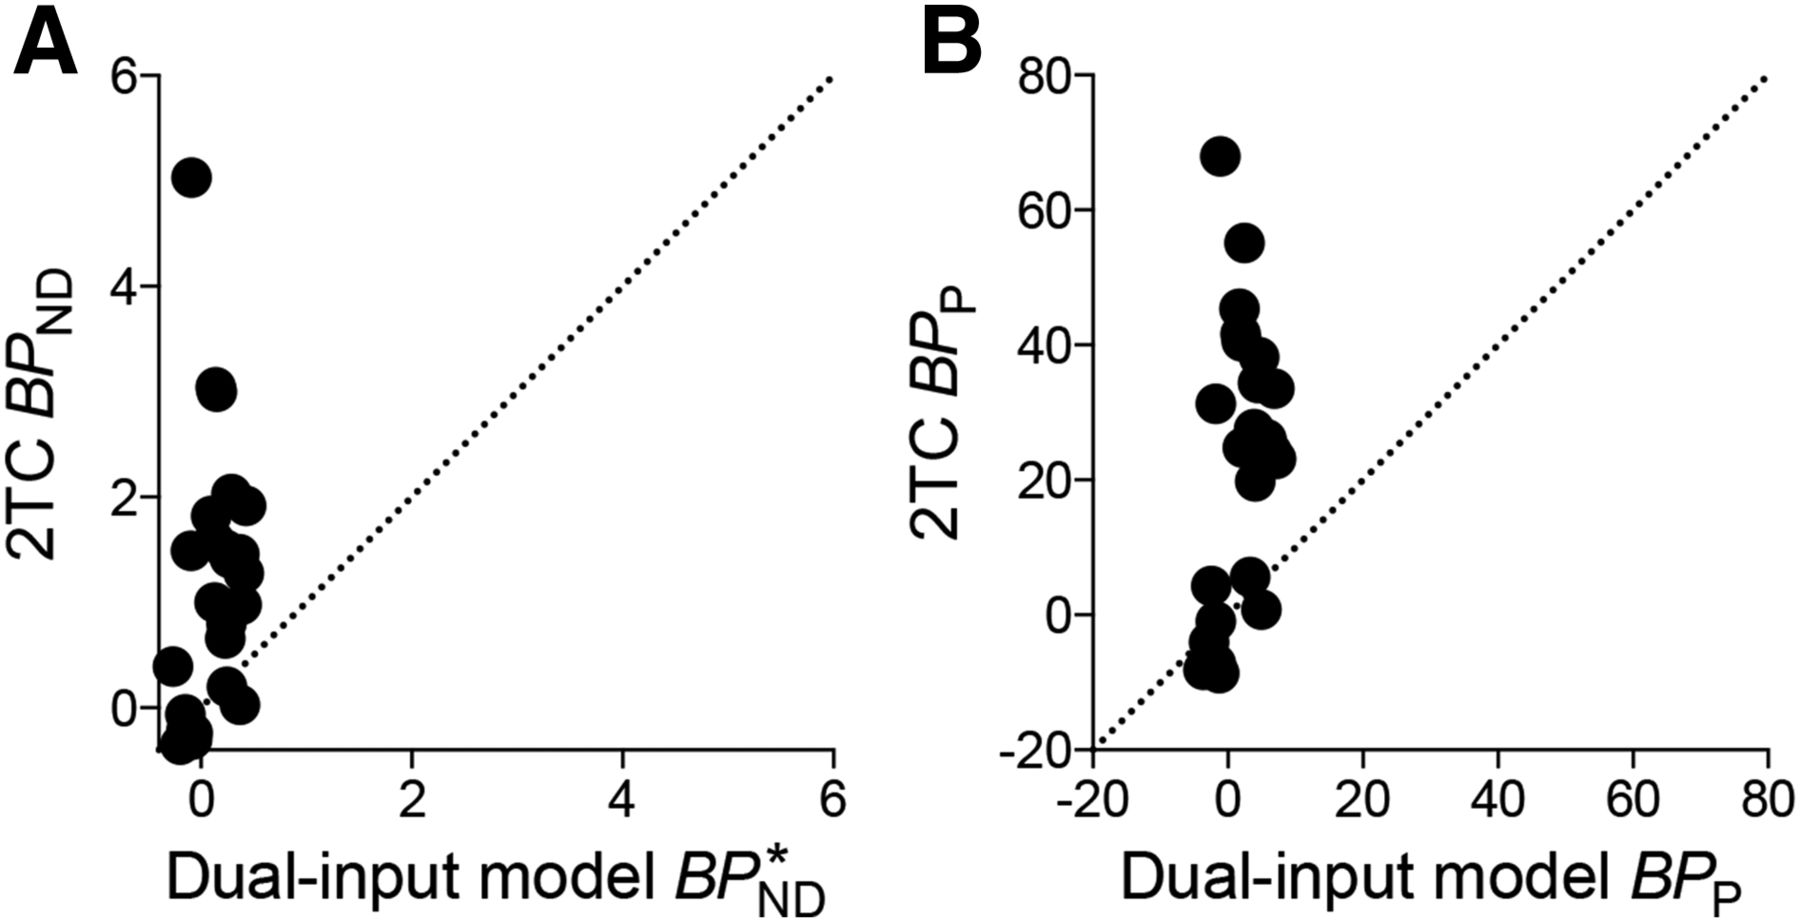
The graphical analysis with the parent-only input did not allow stable estimation of total distribution volumes, because the graphical plots were not linear within the PET scanning time (i.e., t* could not be identified). The standard 2TC model with plasma parent as an input function was unstable in estimating total distribution volume in some cerebral cortical regions. The BPND values were estimated in the rest of the regions but with large parameter estimation variations ranging from 0.03 to 5.03 and from −0.35 to 1.49 in the cerebral cortex of AD patients and HCs, respectively. The 2TC BPND did not correlate well with the dual-input graphical  (r2 = 0.04, Fig. 3A). The 2TC BPP values also showed large parameter estimation variations ranging from 0.8 to 68 and from −8.6 to 31 in AD patients and HCs, respectively. Likewise, the 2TC BPP did not correlate well with the dual-input graphical BPP (r2 = 0.13, Fig. 3B).

Correlation of binding potential values estimated by dual-input graphical model with combined plasma-input and single-input compartment model (2TC). Neither 2TC BPND (A) nor BPP (B) correlated well with dual-input graphical  or BPP (r2 = 0.04 or 0.13), respectively. Straight line indicates line of identity in this and subsequent figures as applicable.
SUVR and Reference Tissue Model
The 3-dimensional plots of MRTMO were linear after t* (Supplemental Fig. 5). MRTMO robustly estimated  for the ROI data and enabled stable voxelwise parametric imaging of
  . The
. The  estimated by the ROI-based MRTMO analysis closely matched plasma-input
  and correlated highly with BPP by the dual-input graphical model with a combined plasma input (r2 = 1.00 and 0.96; Fig. 4 and Supplemental Fig. 3B, respectively). The
  values in the ROIs placed on the parametric images slightly underestimated the corresponding
  values in the ROI analysis (by 4%, r2 = 0.99, Supplemental Fig. 6). The MRTMO parametric images showed a clear contrast of
  values in the cerebral cortices including the hippocampal formation between AD and HC (Figs. 5A and 5B). Because 11C-PBB3 accumulates prominently in the extra-brain venous sinus system, these regions also showed high false
  values in both AD and HC. The SUVR-1 images with 30- to 50-min data also showed a clear contrast between AD and HC (Figs. 5C and 5D).

Correlation of  values estimated by dual-input graphical model with combined plasma-input and reference tissue model.
  estimated by ROI-based MRTMO analysis closely matched
  by dual-input graphical model (r2 = 1.00).

Coronal parametric images of AD and HC. MRTMO was used to estimate parametric  value images in AD patients (A) and HCs (B). SUVR-1 images were created by averaging frames of PET images for 30–50 min in AD patients (C) and HCs (D).
MRTMO parametric images of shortened-scan length showed underestimation of  values compared with the parametric images with 70-min scan data. The amount of underestimation of
  values was 5%–10% for 60-min scan data (Fig. 6A). SUVR-1 values correlated well with parametric
  values (r2 > 0.97). However, SUVR-1 values with 30- to 50-min and 50- to 70-min data overestimated whereas 20- to 30-min data underestimated (5%–12%) those with full 70-min data or MRTMO
  values (Fig. 6B).

Correlation of  estimated by MRTMO and SUVR-1 with scan data of various lengths. (A)
  values estimated by MRTMO with 60- (blue), 50- (red), 40- (green), and 30-min (purple) data were plotted against those with full 70-min data. (B) SUVR-1 values with 50- to 70- (blue), 30- to 50- (red), and 20- to 30-min (green) data were plotted against
  values estimated by MRTMO with 70-min data.
DISCUSSION
We established methods for quantification of tau pathology in the human brain using 11C-PBB3. The dual-input graphical models with an assumption of radiometabolites entering brain accurately estimated specific binding parameter  , which was consistent with the MRTMO
  and SUVR-1 but not consistent with the traditional 2TC BPND. Reference tissue model
  and SUVR-1 thus accurately quantified radioligand binding to tau despite the radiometabolite presence in the brain.
Significant amounts of the major radiometabolite of 11C-PBB3 were found to enter the mouse brain (30% of radioactivity in the brain 5 min after injection) (23). In the human blood, 11C-PBB3 was also rapidly metabolized, and a major radiometabolite identical to that observed in mice was produced, and this metabolite is very likely to enter the brain, although it is more hydrophilic than 11C-PBB3. We recently identified the chemical structure of this radiometabolite, and we are trying to synthesize it to measure its binding affinity for tau (H. Hashimoto et al., unpublished data, 2015). We assumed in our data analysis that this radiometabolite has no significant affinity for tau. However, if the backbone structure of 11C-PBB3 as a β-sheet ligand is preserved in the metabolic conversion, it may also bind to tau. Nevertheless, current  by dual-input graphical analysis and MRTMO can be also shown to be directly proportional to Bavail (Supplemental Appendix B).
In the present study, the dual-input graphical analysis with a combined plasma input allowed robust estimation of  . Although only Equation 1 is needed to estimate
  , Equation 2 also allows calculation of the same
  by estimating
  and
and  separately, although it requires δ (Supplemental Appendix A). We also applied dual-input compartment analysis (24,25). However, unlike the situation previously reported for 123I-epidepride (24,25), this analysis for 11C-PBB3 was unstable. The reason for this is that the model estimates 6 microparameters with a rapidly decreasing parent input as 1 of the 2 inputs as opposed to the graphical analysis estimating only macroparameters (V's). However, we were able to show that, by providing the values estimated by the graphical analysis, the dual-input compartment model fairly well described measured time–activity curve data (Supplemental Figs. 7A and 7B). We applied the Logan plot to the predicted target brain time–activity curve due to the parent and found the plot was linear after t* = 11 min (Supplemental Fig. 7C), indicating that parent components of time–activity curves reach transient equilibrium and 11C-PBB3 binding is reversible.
Meanwhile, the conventional 4-parameter 2TC model with a parent input alone, assuming no metabolites entering the brain, was also unstable in estimating microparameters. With VND constrained to that of the cerebellar cortex, the macroparameter, BPND, could be estimated albeit with a large estimation variability. However, these BPND values did not match the  values estimated by the dual-input models and MRTMO or SUVR-1 values. A model relying solely on unmetabolized 11C-PBB3 as an input function may technically yield a valid binding parameter, BPP (25), only if the brain time–activity curves can be reliably fitted with the parent-only input. This may not be feasible when significant metabolite activity is present in the brain as in the present study.
MRTMO  estimation does not require any assumption of metabolite, because the estimation is performed without blood data. The validity of this estimation was supported by the agreement of
  values between MRTMo and the dual-input models. The same MRTMO operational equation can be derived from both the graphical analysis with parent-only input and the dual-input graphical analysis with combined plasma input (Eq. 1). In the present study, MRTMO
  values as expected closely matched those with the dual-input model but not with the single-input model. In addition, the SUVR-1 at 30–50 min showed excellent correlations with MRTMO
  and hence dual-input model
  . Thus, the MRTMO
  and SUVR-1 appear to reflect tau binding even in the presence of radiometabolite in the brain. Finally, voxelwise
  estimation by MRTMO was stable, and the generated parametric images allowed clear delineation of tau deposition in the brain of AD patients in contrast to the absence of brain areas with positive
  in HCs. Unlike most Aβ imaging radioligands, 11C-PBB3 showed no overt retention in the white matter.
In the cerebral cortex of HCs and nonbinding regions of AD patients,  was slightly negative. This result is attributable to the fact that the nondisplaceable distribution volumes in the cerebellar cortex (
 ) of both HCs and AD patients (16.7 ± 4.7 in HCs and 16.9 ± 2.6 in AD patients with no differences between the 2 groups) were slightly larger than those in the cerebral cortex of HCs (14.8 ± 5.0) and nonbinding regions of AD patients (14.3 ± 2.0). The exact reason for these regional differences in the nonspecific binding of 11C-PBB3 is unclear at present. However, higher nonspecific binding or the presence of specific binding in the reference tissue theoretically does not violate the use of the reference tissue models when fitting is adequate (35).
The variability of BPND estimations by MRTMO is known to be small compared with other reference tissue models (33). However, MRTMO may underestimate BPND in the presence of noise in PET data, and this underestimation is more marked with larger noise and larger BPND values (33). Our parametric MRTMO  was not significantly underestimated, compared with
  determined by ROI-based MRTMO (Supplemental Fig. 6), suggesting that the underestimation due to data noise is minimal, because the
  for 11C-PBB3 is small (BPND < 0.5).
 by definition includes δ (a constant value). There may be intersubject variations and potential drug treatment effects on the degree of the 11C-PBB3 metabolisms, and therefore
  may require a larger effect size for group comparisons. On the other hand, BPP should not suffer from this intersubject variation, but due to its quick metabolism, regular metabolite analysis of 11C-PBB3 is not practical for the estimation of BPP.
We selected SUVR-1 at 30–50 min when specific-binding time–activity curves become relatively flat (Supplemental Fig. 8). SUVR-1 can be practically obtained by a static PET scan initiated at a fixed time point after 11C-PBB3 injections. By contrast, the reference tissue  estimation requires dynamic PET data, but the advantage of the reference tissue
  estimation is its independence of cerebral blood flow or the systemic clearance of the radioligand.
  therefore should be more suited for long-term longitudinal studies (36).
CONCLUSION
We have established methods for quantification of tau pathology in the human brain using 11C-PBB3. The  determined by dual-input graphical analysis models is consistent with the reference tissue
  and SUVR-1, suggesting that these parameters can accurately quantify target tau deposits notwithstanding the entry of radiometabolites into the brain. MRTMO is suitable quantification for 11C-PBB3 without blood data when a patient can be stably scanned for 60 min. If the motion of the patient hampers the dynamic data, SUVR-1 30–50 min can be used as an alternative method. 11C-PBB3 thus appears an adequate radioligand for PET imaging of tau pathology.
APPENDIX
Current  from the dual-input graphical analysis and the reference tissue model MRTMO with the additional metabolite distribution volume term (
 ) can be shown to be directly proportional to
  . At equilibrium,
  , thus
  , and
, and  , thus
  , then
  , where
  and
and  are plasma-free fraction for parent and metabolite;
  and
and  , tissue-free fraction for parent and metabolite;
  and
and  , plasma concentration of parent and metabolite at equilibrium; and
  and
and  , concentration in the reference tissue of parent and metabolite at equilibrium. Because free fractions and δ are all constants,
  is directly proportional to the binding density,
  .
.
DISCLOSURE
The costs of publication of this article were defrayed in part by the payment of page charges. Therefore, and solely to indicate this fact, this article is hereby marked “advertisement” in accordance with 18 USC section 1734. This study was supported in part by J-AMP of MEXT, Japan; grants-in-aid for scientific research on innovative areas (“Brain Environment”) 23111009 and on young scientists (A) 26713031 from MEXT, Japan; Health Labour Sciences Research grant H25-Seishin-Jituyouka(Seishin)-Ippan-001 from MHLW, Japan; and the Brain Mapping by Integrated Neurotechnologies for Disease Studies from AMED, Japan. No other potential conflict of interest relevant to this article was reported.
Acknowledgments
We thank Katsuyuki Tanimoto and Takahiro Shiraishi and the members of the Clinical Neuroimaging Team for their support in PET scans, Kazuko Suzuki and Izumi Izumida for their assistance as clinical coordinators, and the staff of the Molecular Probe Program for the radioligand synthesis and metabolite analysis.
Footnotes
↵* Contributed equally to this work.
Published online Jul. 16, 2015.
- © 2015 by the Society of Nuclear Medicine and Molecular Imaging, Inc.
REFERENCES
- Received for publication April 30, 2015.
- Accepted for publication July 9, 2015.


Jump to section
Related Articles
Cited By...
- Imaging {alpha}-synuclein pathologies in animal models and patients with Parkinsons and related diseases
- High-contrast in-vivo imaging of tau pathologies in Alzheimers and non-Alzheimers disease tauopathies
- Tau imaging detects distinctive distribution of tau pathology in ALS/PDC on the Kii Peninsula
- Brain Imaging of Alzheimer Dementia Patients and Elderly Controls with 18F-MK-6240, a PET Tracer Targeting Neurofibrillary Tangles
- Evaluation of 18F-RO-948 PET for Quantitative Assessment of Tau Accumulation in the Human Brain
- Tau-induced focal neurotoxicity and network disruption related to apathy in Alzheimers disease
- Modeling Strategies for Quantification of In Vivo 18F-AV-1451 Binding in Patients with Tau Pathology
- Pharmacokinetic Evaluation of the Tau PET Radiotracer 18F-T807 (18F-AV-1451) in Human Subjects