


Abstract
18F-MK-6240 (18F-labeled 6-(fluoro)-3-(1H-pyrrolo[2,3-c]pyridin-1-yl)isoquinolin-5-amine) is a highly selective, subnanomolar-affinity PET tracer for imaging neurofibrillary tangles (NFTs). Plasma kinetics, brain uptake, and preliminary quantitative analysis of 18F-MK-6240 in healthy elderly (HE) subjects, subjects with clinically probable Alzheimer disease (AD), and subjects with amnestic mild cognitive impairment were characterized in a study that is, to our knowledge, the first to be performed on humans. Methods: Dynamic PET scans of up to 150 min were performed on 4 cognitively normal HE subjects, 4 AD subjects, and 2 amnestic mild cognitive impairment subjects after a bolus injection of 152–169 MBq of 18F-MK-6240 to evaluate tracer kinetics and distribution in brain. Regional SUV ratio (SUVR) and distribution volume ratio were determined using the cerebellar cortex as a reference region. Total distribution volume was assessed by compartmental modeling using radiometabolite-corrected input function in a subgroup of 6 subjects. Results: 18F-MK-6240 had rapid brain uptake with a peak SUV of 3–5, followed by a uniformly quick washout from all brain regions in HE subjects; slower clearance was observed in regions commonly associated with NFT deposition in AD subjects. In AD subjects, SUVR between 60 and 90 min after injection was high (approximately 2–4) in regions associated with NFT deposition, whereas in HE subjects, SUVR was approximately 1 across all brain regions, suggesting high tracer selectivity for binding NFTs in vivo. 18F-MK-6240 total distribution volume was approximately 2- to 3-fold higher in neocortical and medial temporal brain regions of AD subjects than in HE subjects and stabilized by 60 min in both groups. Distribution volume ratio estimated by the Logan reference tissue model or compartmental modeling correlated well (R2 > 0.9) to SUVR from 60 to 90 min for AD subjects. Conclusion: 18F-MK-6240 exhibited favorable kinetics and high binding levels to brain regions with a plausible pattern for NFT deposition in AD subjects. In comparison, negligible tracer binding was observed in HE subjects. This pilot study suggests that simplified ratio methods such as SUVR can be used to quantify NFT binding. These results support further clinical development of 18F-MK-6240 for potential application in longitudinal studies.
Accumulation and regional spread of brain neurofibrillary tangles (NFTs) in Alzheimer disease (AD) progresses as a function of disease stage, presenting a target for therapeutic interventions aimed at altering disease course. A quantifiable biomarker of the magnitude and spatial distribution of NFT burden in AD subjects is accordingly an interesting tool to interrogate disease status, possessing direct relevance to therapeutic target disease and clinical outcomes. An NFT-targeted PET radioligand is best suited for this purpose because it offers sensitive and noninvasive detection, quantification, and the potential to monitor treatment response aimed at NFTs over time in living subjects (1). Several recently developed PET radiotracers have demonstrated plausible retention patterns for NFT disease in the AD brain, although their specificity and sensitivity remain to be fully ascertained (2).
18F-MK-6240 (18F-labeled 6-(fluoro)-3-(1H-pyrrolo[2,3-c]pyridin-1-yl)isoquinolin-5-amine) is an NFT-targeting PET radioligand developed by optimizing properties to deliver high binding potential (specific-to-nondisplaceable ratio) with no off-target binding. MK-6240 has shown exquisitely high binding potential to NFT disease in vitro in human brain tissue, with no evidence of displaceable signal in vivo in rhesus monkeys (3,4). Initial evaluations, including radiation dosimetry studies on healthy volunteers, had good safety profiles and support further clinical investigation of 18F-MK-6240 in ADs.
This pilot study was designed to ascertain brain uptake and washout characteristics of 18F-MK-6240 in a small, cross-sectional cohort of healthy elderly (HE) subjects and subjects diagnosed clinically with AD or amnestic mild cognitive impairment (MCI) presumptively carrying NFT disease. Regional tracer retention was mapped to brain regions of interest based on the known neuropathologic distribution of NFT across the spectrum of AD disease severity. In a subgroup of HE and AD subjects, arterial blood was sampled to quantify brain uptake relative to amount of parent radiotracer delivered to the brain.
MATERIALS AND METHODS
Subject Recruitment
The study recruited cognitively intact HE subjects (subjects 1–4) and subjects carrying a diagnosis of either AD or MCI (subjects 5–10). All subjects were more than 55 y old, with a Mini-Mental State Examination (MMSE) score of at least 27 for HE subjects, an MMSE score of at least 26 with an objective impairment in episodic memory for MCI subjects, and an MMSE score of 28 or less for subjects clinically diagnosed as probable AD by the diagnostic criteria of the National Institute of Neurologic and Communicative Disorders and Stroke and of the Alzheimer Disease and Related Disorders Association. Active smokers were excluded from participation. Clinical diagnosis of MCI and AD was used as the sole determinant of the likelihood to carry NFT disease; no concomitant scanning or cerebrospinal fluid analysis for amyloid deposition was required per protocol, although for several subjects amyloid biomarker results were available as part of prior clinical evaluations or prior participation in clinical diagnostic studies (Table 1 and Supplemental Table 1 (5–7); supplemental materials are available at http://jnm.snmjournals.org). Per protocol, subjects were screened for medical history and underwent a physical examination, an electrocardiogram, urine analysis, laboratory blood tests (complete blood count, serum chemistries), drug screening, and pregnancy tests for women. Vital signs and electrocardiograms were recorded before the 18F-MK-6240 injection, 10 and 40 min after injection, and at the end of the scan. Urine analysis and blood tests were repeated within 4 h of PET scan completion. Arterial blood sampling to support quantitative image analysis was performed in 3 each of the HE and AD subjects who consented to arterial line placement.
Demography
The study was conducted at the University Hospital Leuven, Belgium, in conformance with principles of good clinical practice. The local Ethics Committee (University Hospitals Leuven/KU Leuven) approved this study (ClinicalTrials.gov no. NCT02562989), and either the subjects or, if necessary, their legal representative (for AD and MCI subjects) gave written informed consent before enrollment.
18F-MK-6240 Radiosynthesis
18F-MK-6240 was radiosynthesized as previously described with minor modifications that excluded the temperature gradient during the reaction and a deprotection step (8). The radioligand had high radiochemical purity (>95%) and a molar activity of 116 ± 56 GBq/μmol at the time of injection (n = 10 batches).
PET Scans
Dynamic brain PET scans were acquired in 3-dimensional list mode on a Hirez Biograph 16 PET/CT camera (Siemens Medical Solutions) after a rapid (over 20 s) intravenous bolus injection of 159 ± 5 MBq (mean ± SD; n = 10 injections) of 18F-MK-6240. The scan consisted of 2 segments from 0 to 90 min (segment 1) and from 120 to 150 min (segment 2) with a 30-min break between the segments. Segment 2 was optional for AD/MCI subjects, and only subject 5 agreed to participate. Low-dose CT was performed before each scan segment for attenuation correction. The acquisition consisted of a total of 37 frames over a period of 150 min with a progressive increase in frame duration: 6 × 10, 6 × 20, 2 × 30, 2 × 60, 2 × 120, 10 × 300, 3 × 600 s (0–90 min), and 6 × 300 s (120–150 min). Images were reconstructed with a standard 3-dimensional filtered-backprojection algorithm including correction for scatter, attenuation, decay, random coincidences, and dead time.
MRI
Subjects were scanned on an Achieva 3-T MR scanner (Philips Healthcare) with a 24- or 32-channel head coil. The MR sequences consisted of a 3-dimensional T1-weighted turbo field-echo sequence, a fluid-attenuated inversion recovery sequence, a diffusion-weighted imaging scan, and a gradient-echo sequence to detect hemosiderin deposits.
Measurement of 18F-MK-6240 in Plasma
To measure the radioactivity concentrations in the whole blood and plasma, arterial blood samples (2 mL each) were drawn at 10-s intervals for the first 100 s and at approximately 2, 2.5, 3, 5, 15, 30, 45, 60, 75, and 90 min after injection of the radiotracer. Additional arterial blood samples (4 mL) were drawn at approximately 2, 5, 15, 30, 60, and 90 min after injection of the radiotracer to measure parent 18F-MK-6240 and its radioactive metabolites in the plasma, using high-performance liquid chromatography as described previously (9) with some minor modifications. One milliliter of acetonitrile was added to the plasma for protein denaturation, and analysis was performed using the high-performance liquid chromatography system with 45% v/v acetonitrile in the buffered mobile phase. Ultraviolet detection was performed at 220 nm. The γ-counter lower limit of quantitation was 309 Bq.
A metabolite-corrected plasma input function was obtained as follows: the total radioactivity time course in plasma and whole blood was fitted after the peak to a triexponential function with constant weighting. The 18F-MK-6240 parent fraction in the plasma samples was fitted to a biexponential function with constant weighting. Because the parent fractions for subject 2 had γ-counter measurement errors, and the measured parent fractions across time points for the other 5 subjects were similar, population-based average parent fractions from the remaining 5 subjects were used. The fitted total plasma radioactivity was multiplied by the fitted parent fraction to obtain the radiometabolite-corrected plasma input function.
Image Analysis
Images were processed using the PNEURO toolbox of the PMOD software package (version 3.7; PMOD Technologies Ltd.) and SPM8 toolsets in MATLAB 2014b (MathWorks). The PET images were corrected for motion using SPM by frame-to-frame registration with the averaged PET image derived from early time frames. Subsequent processing used the PNEURO toolbox. Brain extraction with gray matter and white matter segmentation was performed on each subject’s T1-weighted 3-T MRI scan. The PET image averaged over all frames was aligned to the extracted subject MRI brain via a rigid registration algorithm, and the same transformation was then applied to the entire 0- to 150-min dataset. An N30R83 human brain atlas (10) was aligned to the extracted subject MRI brain via a nonlinear registration algorithm. The aligned brain atlas was applied to the motion-corrected PET dynamic data to generate time–activity curves of several brain regions, including (but not limited to) the frontal cortex, parietal cortex, temporal cortex, medial temporal cortex, putamen, thalamus, cerebral white matter, and cerebellar cortex. The cortical and subcortical regions were masked for gray matter.
Regional time–activity curves as SUV and SUV ratios (SUVRs) of the target region to the reference region were generated over the time course of the scan, as well as over a scan window during which the separation of regional SUVR curves was maximum and stable over time. Cerebellar gray matter has been reported as devoid of NFT deposition, and therefore, similar to the evaluation of other tau PET tracers, we used the cerebellar cortex as the reference region (11,12). Reference-tissue modeling approaches such as simplified reference-tissue modeling or Logan reference-tissue modeling (LRTM) were performed to determine nondisplaceable binding potential (BPND) for target regions (13,14). For subjects with arterial blood sampling, total volumes of distribution (VT) were determined by compartmental modeling using an arterial input function. A 1- or 2-tissue compartment model (TCM; reversible and irreversible versions) was selected on the basis of a model-selection metric (i.e., Akaike information criteria). Additional tests, such as VT time stability, were performed to determine the minimal scan length for accurate measurements and to indirectly assess the influence of radiometabolite accumulation in the brain.
Furthermore, the relationship between SUVR and distribution volume ratio (DVR) (equivalent quantity obtained as a ratio of target-to-reference VT by compartmental modeling and Logan graphical analysis [LGA], or as a regression slope [BPND + 1] by LRTM) was explored to ensure that the SUVR represented an appropriate surrogate measurement of 18F-MK-6240 specific binding. The LGA and LRTM were applied to fit the equilibration start time and the slope of the linear portion for each brain region that included data from multiple voxels within a volume of interest, with a maximum deviation between the regression and all measurements set to 10%.
To determine the effect of any potential defluorination-related bone uptake on adjacent cortical regions, the attenuation CT image was used to manually delineate skull volumes of interest close to the atlas-derived temporal cortical volumes of interest for both HE and AD subjects, and their time–activity curves were compared.
RESULTS
A total of 4 HE, 4 AD, and 2 amnestic MCI subjects participated in this study. The subject demographics are presented in Table 1, and cerebrospinal fluid, β-amyloid, and MRI biomarker data are presented in Supplemental Table 1. Two MCI subjects were amyloid-positive by PET, and in 1 dementia subject the diagnosis of AD was supported by cerebrospinal fluid biomarkers.
The injected mass dose (mean ± SD) of 18F-MK-6240 was 0.44 ± 0.08 μg (n = 4 injections) in HE subjects and 0.56 ± 0.54 μg (n = 6 injections) in AD subjects. The 18F-MK-6240 injections were well tolerated, with no pharmacologic effects. Five subjects reported adverse events characterized as bruising or hematoma at the vascular access site within 48 h of dosing, but these events were considered mild and unrelated to 18F-MK-6240. No serious adverse events were reported, and no clinically significant changes in vital signs, clinical laboratory results, or electrocardiograms were observed.
Plasma Analysis
18F-MK-6240 exhibited rapid metabolism after the injection with parent 18F-MK-6240 in arterial plasma, representing 20% ± 8% at 15 min (n = 5), 10% ± 5% at 30 min (n = 5), and 7% ± 5% at 90 min (n = 5) in HE and AD subjects (Fig. 1A). The 18F-MK-6240 concentrations in arterial plasma peaked to an SUV of approximately 30 at 30–40 s after tracer injection in all subjects and then rapidly declined, followed by a slow terminal clearance (Fig. 1B).

(A) 18F-MK-6240 parent fraction in HE and AD subjects. (B) Time course of parent 18F-MK-6240 concentrations in arterial plasma of HE and AD subjects (mean ± SD, n = 3). Parent 18F-MK-6240 concentration in arterial plasma for HE subject 2 was derived using average parent fraction from remaining 5 subjects.
Brain Time–Activity Curves and SUVR Analysis
After the 18F-MK-6240 injection, a high peak SUV of 3–5 occurred across brain regions in both HE and AD/MCI subjects. In HE subjects, brain uptake was followed by a rapid, homogeneous washout across most brain regions (Fig. 2A). By contrast, AD/MCI subjects (except subject 5) showed higher MK-6240 retention in brain regions consistent with known NFT deposition for AD (Fig. 2B). Specifically, medial temporal lobe regions, including hippocampus, parahippocampal gyrus, and amygdala, showed substantial tracer retention in 5 of 6 AD/MCI subjects. In 2 of 3 AD subjects with an advanced clinical status (MMSE < 20), tracer retention was also observed in temporal, frontal, and parietal neocortical regions, whereas in the third, signal was restricted to medial temporal regions bilaterally. The cerebellar cortex, a region known to be devoid of NFT deposition in AD, exhibited rapid washout similar to the brains of the HE subjects.

Regional brain radioactivity concentration–time course in representative HE subject (subject 2) (A) and representative AD subject (subject 8) (B) after intravenous injection of 18F-MK-6240. HE subject was scanned for 150 min and AD subject for 90 min after injection of radiotracer.
Representative cortical and subcortical regional uptake ratios in HE and AD subjects over time are shown in Figure 3. Regional separation of SUVR curves between AD and HE subjects was prominent between 60 and 90 min, with 5 of 6 AD subjects showing an SUVR of more than 1, whereas all HE subjects had an SUVR of 1 or less. Therefore, SUVR regional comparisons were made by averaging over the 60- to 90-min scan interval after the tracer injection (Figs. 4 and 5). Of the 6 AD/MCI subjects, three (subjects 8–10) showed a widespread cortical and subcortical 60- to 90-min SUVR (SUVR60–90 min) of more than 2–3 in regions associated with AD NFT deposition. Subjects 6 and 7 showed a moderately high SUVR60–90 min of approximately 2, localized to the medial temporal lobe, and subject 5 showed an intense focus in the subcortical white matter (coronal slice; Fig. 5) near the caudate/putamen that colocalized with a hyperintense signal on T1-weighted MRI, with an SUVR60–90 min of approximately 1 across all other brain regions.

Regional (representative cortical and subcortical) SUVR–time course with cerebellar cortex as reference.
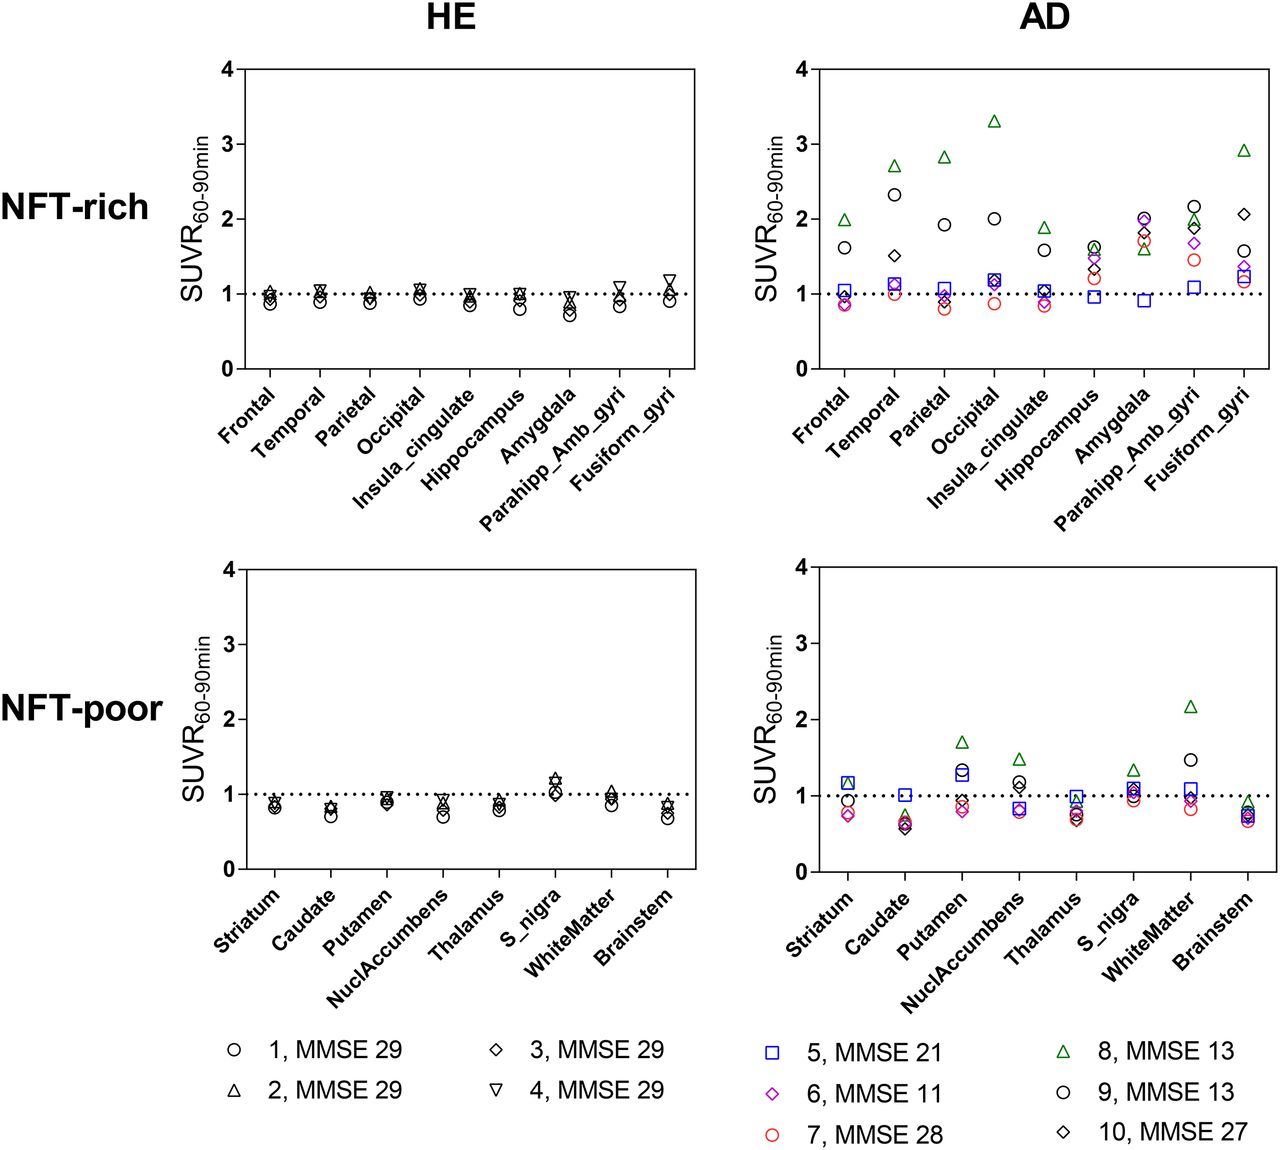
Regional SUVR60–90 min with cerebellar cortex as reference across brain regions expected to be NFT-rich and NFT-poor.

18F-MK-6240 PET fused to individual T1-weighted MR images for 4 HE subjects (subjects 1–4) and 6 AD/MCI subjects (subjects 5–10). PET images are averaged between 60 and 90 min of scan time, at level of medial temporal cortex, and scaled as SUVR with cerebellar cortex as reference region. Identical rainbow color scale of 0–3 is shown to compare tracer distribution among subjects.
Brain Kinetic Analysis
As part of tracer validation to derive fully quantitative outcomes such as VT, an arterial input–based 1-TCM, 2-TCM, and LGA were performed for subjects with arterial sampling. The regional time–activity curves in HE and AD subjects were best fitted by an unconstrained, reversible 2-TCM (Figs. 6A and 6B). Regional VT values (mean ± SD) in HE subjects across cortical and subcortical regions averaged 4.7 ± 1.2 mL⋅cm−3, whereas VT values in AD subjects ranged from a low of 3.1 ± 0.5 mL⋅cm−3 in caudate to 9.8 ± 1.5 mL⋅cm−3 in amygdala (Supplemental Fig. 1; Supplemental Tables 2 and 3). The LGA provided linear regression slopes representing VT with an equilibration start time of more than 25 min in both HE and AD subjects and higher slopes in NFT-associated areas of AD (Supplemental Fig. 2). The target region DVRs derived from the 2-TCM and LGA corresponded well in both HE and AD subjects. The NFT-rich regions in AD subjects had values of more than 1, whereas NFT-poor regions in AD subjects and all regions in HE subjects had values of 1 or less (Supplemental Tables 4 and 5). Scan data were available for up to 90 min after injection in all subjects; therefore, the time stability of VT was determined by analyzing truncated datasets from the 90-min scan time. The VT values from the 60-min scan length were within 10% of terminal 90-min data in both HE and AD subjects. This finding could indicate that, in this small group of subjects, at least 60 min of data acquisition are required to accurately measure VT and that the influence of any radiometabolite accumulation for the quantification of VT is minimal between 60 and 90 min (Fig. 6C).

(A and B) Time–activity curves with 1-TCM and 2-TCM fits for temporal cortex from HE subject (subject 1) (A) and AD subject (subject 10) (B). (C) Time-stability of VT calculated for cerebellar cortex (circles) and temporal cortex (squares) in HE subjects (open symbols) and AD subjects (filled symbols) using unconstrained 2-TCM with increasingly truncated acquisition times up to 30 min after injection. Values are normalized as percentage of terminal value obtained from 90-min scan (mean ± SD, n = 3). (D) Regional Logan plots (open symbols) and linear regressions (solid lines) derived from LRTM with cerebellar cortex as reference region in representative AD subject (subject 8) with no arterial sampling. Linear regression was applied after real time (equilibration start time) of 15 min. Regression line slopes representing DVRs for temporal cortex, hippocampus, and thalamus were 2.31, 1.25, and 0.91, respectively. Cref(t) is concentration time function in reference tissue; Ct(t) is concentration time function in target tissue; k2′ is average tissue-to-plasma efflux constant.
For subjects without arterial sampling, application of an LRTM using the cerebellar cortex as a reference yielded robust regression slopes (representing DVR = BPND + 1) that were higher for NFT-associated regions, such as the temporal cortex, than for other NFT-poor regions, such as the thalamus in AD subjects (Fig. 6C). The equilibration start times were 20–25 min across all AD subjects, indicating that rapid equilibration is achieved when the slope becomes linear. The simplified reference-tissue modeling fits did not converge for all regions in HE subjects, and in most regions of AD subjects, BPND values either failed to converge or had high standard errors (data not shown).
SUVR–DVR Correlations
To support the validity of SUVR as a PET outcome measure for signal quantification in AD subjects, the SUVRs determined from the 60- to 90-min time window using the cerebellar cortex as a reference were correlated with the DVRs obtained from 2-TCM, LGA, or LRTM and simplified reference-tissue modeling (for subjects without arterial blood sampling). Regional SUVR60–90 min and DVRs derived from 2-TCM, LGA, and LRTM in AD subjects showed a strong linear relationship with a slope of approximately 1, supporting the validity of SUVR as a quantitative metric for signal quantification (Fig. 7; Supplemental Table 6).
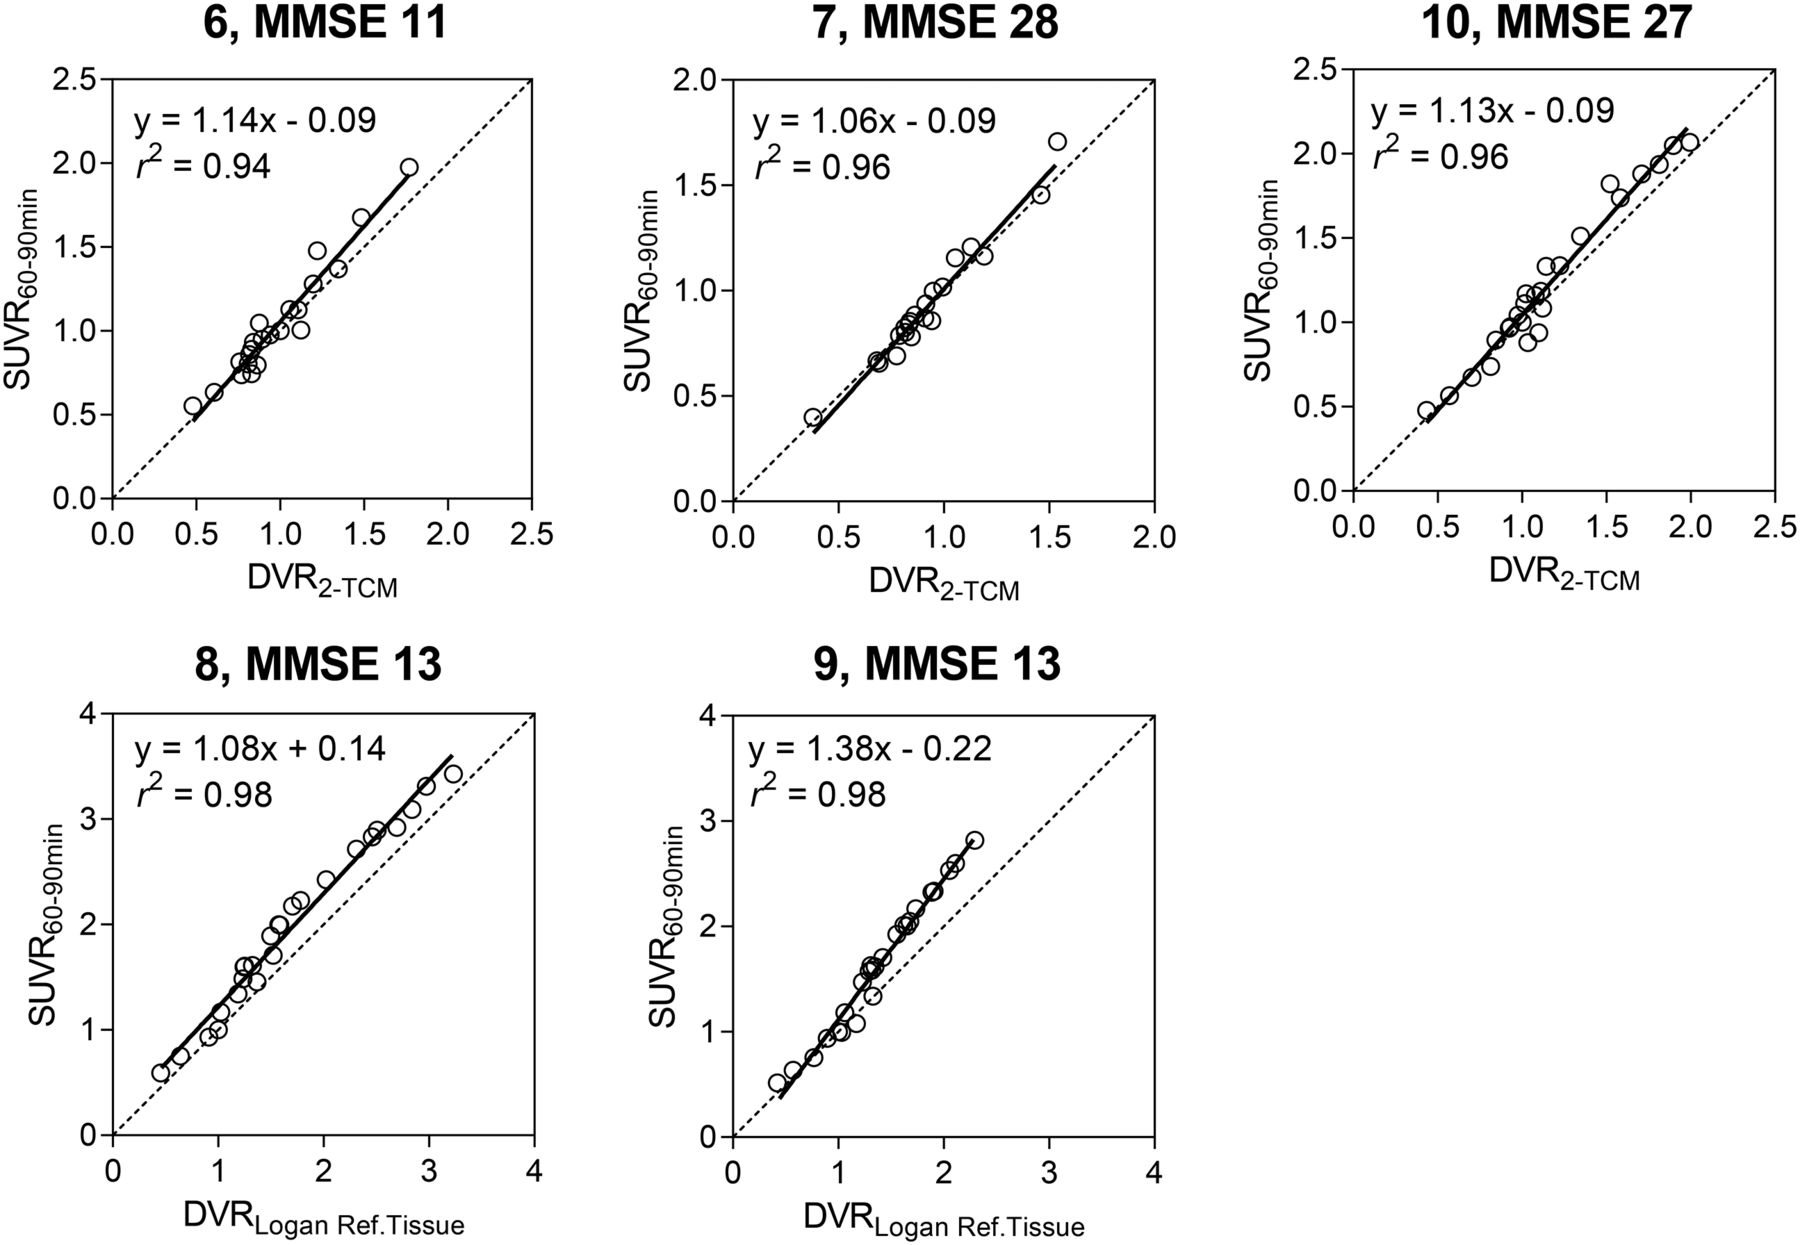
Relationship between SUVR and DVR measures in AD subjects. Top row shows correlation between SUVR60–90 min and DVR measured by 2-TCM in 3 subjects with arterial blood sampling. Bottom row shows correlation between SUVR60–90 min and DVR measured by LRTM in 2 subjects without arterial blood sampling. Subject 5 was excluded, because there was minimal-to-no 18F-MK-6240 signal in brain. Linear regression lines are plotted for all subjects.
DISCUSSION
This study found that 18F-MK-6240 has utility as an NFT-imaging PET tracer in a small cohort of 4 HE subjects, 4 subjects with clinically probable AD, and 2 subjects with amnestic MCI due to AD. We found that 18F-MK-6240 exhibits regional retention in a plausible pattern for NFT pathology in AD (15). Importantly, in NFT-depositing regions, signal magnitude in terms of semiquantitative SUVR or fully quantitative VT values were higher in AD/MCI subjects than in HE subjects, with no evidence of off-target binding in HE subjects.
In this study, images were collected dynamically for up to 90 min in all subjects, and optional imaging windows from 120 to 150 min were collected in 3 HE subjects and 1 AD subject. In addition, arterial blood sampling for full quantitation was obtained in 3 HE and 3 AD subjects. The tracer exhibited fast plasma clearance, with approximately only 10% of the parent remaining at 30 min after injection.
Using the cerebellar cortex as a reference, SUVR curves did not always appear to reach stable values over the 30-min static window of 60–90 min, particularly in the NFT-associated cortical regions of 2 AD subjects with lower MMSE scores (Fig. 3). This finding could be due to the slower tracer kinetics in the brain regions with a high density of NFTs in these AD subjects. To minimize the tracer delivery effect and minimize biases introduced by measuring nonequilibrated SUVRs in high-binding regions, imaging windows beyond 90 min after injection merit further assessment. Determination of an optimal static scan time window, potentially later than 90 min after injection, will be of particular importance to facilitate longitudinal assessment of tau-associated disease progression. Alternatively, different reference tissues may be explored that could provide a more appropriate stable reference for static imaging within 90 min after injection.
The SUVR60–90 min was approximately 1 across all NFT-rich and NFT-poor regions of the HE subjects, indicating negligible off-target binding. The only region that exhibited SUVR60–90 min values marginally greater than 1 was the substantia nigra, although not all subjects exhibited this elevated signal (Fig. 4). In vitro autoradiography studies performed on brain slices of controls and AD subjects have showed no displaceable binding in the substantia nigra (16). Speculatively, the sporadic in vivo retention could be due to nonspecific binding to neuropigments, which increases with age (17). Nevertheless, this inconsistency merits further investigation in a larger cohort of subjects, as this slightly elevated signal was not observed in all subjects. In contrast, an SUVR60–90 min of 1.5–2 was observed in the putamen and white matter in subjects 8 and 9 (AD) with extensive cortical spread. The presence of signal in the putamen and white matter of subjects 8 and 9 with significant cortical spread (possibly stage VI) may be specific because NFTs are present in these areas in Braak late stage (15,18). However, with other tau PET tracers, similar signals have been reported for these regions not only in AD subjects but also in healthy controls and has been attributed to off-target binding (8,19,20). Subcortical structures such as the caudate, thalamus, and brain stem showed SUVRs of around 1 in both HE and AD subjects, suggesting no evidence of off-target binding and that those regions can be used as reference regions.
Two subjects diagnosed with AD did not fit the pattern of high tracer binding with disease severity based on clinical cognition scores. Subject 5 (AD) exhibited no regionally increased tracer uptake, including no tracer retention in medial temporal and limbic areas, which are generally identified as early regions of NFT accumulation (Braak I/II) (15). One area of focal uptake was observed and later identified as a hemorrhagic lesion in the putamen (visible on the coronal slice of subject 5 in Fig. 5). Despite a clinical history suggestive of AD at the time of recruitment, subsequent clinical progression and investigations have raised questions about the validity of the AD diagnosis, and scan findings (including microhemorrhages and extensive white matter intensities) indicate a possible vascular cause of the dementia (Supplemental Table 1). However, the neuropathologic diagnosis for this subject remains uncertain. A second AD subject (subject 6) exhibited only limited medial temporal and amygdala tracer retention despite significant clinical impairment (MMSE 11), indicating a discordance between clinical stage and expected 18F-MK-6240 signal based on presumptive Braak staging. The high signal localized to the amygdala is not unexpected, with reports showing the presence of NFTs in amygdala in early-to-late stages of AD and that its signal magnitude could even be higher than in cortical regions (21,22). However, because only a small number of subjects were included in this study, conclusions on the specificity and sensitivity of 18F-MK-6240 as a function of disease stage and neuropathologic diagnosis cannot be drawn. One further key limitation of this study was that recruitment criteria were limited to the clinical diagnoses as an inclusionary standard, and additional testing for AD pathology (e.g., amyloid PET scanning or cerebrospinal fluid analysis) was not uniformly used. Within several cases, biomarker support for the diagnosis was available from prior data (Supplemental Table 1). Without biomarker support, it is possible that non-AD subjects, or subjects with concurrent, overlapping diseases contributing to cognitive impairment, may have been part of the study sample. Future investigations with larger, better-defined, cross-sectional subject cohorts undergoing serial PET scanning over time, and with correlation of the PET signal to postmortem pathologic detection of NFTs in the same subject, will help clarify the relationship between tracer retention and clinical progression.
The kinetic analysis resulted in a reversible 2-TCM better describing the tracer kinetics across regions in all subjects, indicating the presence of specific and nondisplaceable tissue compartments. For reference-tissue modeling, the LRTM provided stable estimates across all subjects. The correlation between SUVR and DVRs obtained from 2-TCM, LGA, or LRTM was robust (Fig. 7, Supplemental Table 6), but further validation in more subjects is required to ascertain the use of SUVR to quantify the 18F-MK-6240 signal. The exploratory simplified reference-tissue modeling analysis was problematic in this small sample with respect to convergence issues and high BPND errors (data not shown). A larger sample will help to clarify the nature of these issues.
Regarding defluorination, a concern for some 18F-labeled tracers, examination of the 18F-MK-6240 scans indicate that HE subjects had a low-level signal on the skull that was slightly higher than adjacent cortical signal at late time points (Supplemental Fig. 3A). Importantly, the cortical and subcortical signals in HE subjects were not affected by the presence of low-level skull signal as evidenced by plateauing of the cortical and putamen SUVRs at 1, whereas the bone SUVR continued to rise over time (Supplemental Fig. 3B). By contrast, AD subjects showed a prominent cortical signal with higher SUVRs over time because of a tau-associated NFT signal that can affect the clearance kinetics in cortical regions. Because of partial-volume effects, the low-level skull signal could be affected by the adjacent higher cortical signal. The subcortical putamen SUVR, however, plateaued at 1 (Supplemental Fig. 3C).
CONCLUSION
In this study, on a limited number of subjects, 18F-MK-6240 produced robust PET signals in regions plausibly associated with NFT deposition in AD subjects and nominal signals in HE subjects. Associations between DVR and SUVR measurements had minimal bias, suggesting that in vivo NFT deposition can be reasonably quantified using SUVR. To better understand 18F-MK-6240 SUVR bias relative to more quantitative outcomes, further studies are warranted evaluating a longer dynamic scan for detecting the optimal static time window, test–retest scans for characterizing reproducibility measures for longitudinal NFT signal changes, and arterial sampling–based kinetic modeling in multiple subjects.
DISCLOSURE
This work was sponsored by Merck & Co., Inc., Kenilworth, NJ. Editorial assistance was provided by Michele Durocher of ExecuPharm, King of Prussia, PA. This assistance was funded by Merck Sharp & Dohme Corp., a subsidiary of Merck & Co., Inc. The Leuven University (UZ Leuven) groups obtained financial sponsoring from Merck & Co, Inc., for the human PET study. Cyrille Sur, Arie Struyk, Talakad G. Lohith, Idriss Bennacef, Ruben Declercq, Tom Reynders, N. Florestina Telan-Choing, Abbas Walji, Eric D. Hostetler, Jeffrey L. Evelhoch, Mark Forman, Kerry Riffel, and Aubrey Stoch are employees of Merck Sharp & Dohme Corp., a subsidiary of Merck & Co., Inc., who may own stock or hold stock options in the company. Christian A. Salinas and Kuenhi Tsai were employees of Merck Sharp & Dohme Corp., a subsidiary of Merck & Co., Inc., at the time of the study. KU Leuven Research & Development has material transfer agreements (Rik Vandenberghe as principal investigator) with Avid Radiopharmaceuticals, Piramal Imaging, and Tohoku University. UZ Leuven has clinical trial agreements (Rik Vandenberghe as principal investigator) with Abbvie, Biogen, GE Healthcare, Eli Lilly, MSD, Novartis, and Roche. Rik Vandenberghe is the principal investigator of the pivotal 18F-flutemetamol phase 1 and 2 studies. No other potential conflict of interest relevant to this article was reported.
Acknowledgments
We thank the staff of the Memory Clinic and of the Nuclear Medicine Department of University Hospital Leuven, including study nurses Carine Schildermans and Kwinten Porters, for their contribution in conducting the study. We sincerely thank the healthy volunteers, AD/MCI subjects, and their families for their participation in the study.
Footnotes
Published online Jun. 7, 2018.
- © 2019 by the Society of Nuclear Medicine and Molecular Imaging.
REFERENCES
- Received for publication January 12, 2018.
- Accepted for publication May 14, 2018.


Jump to section
Related Articles
Cited By...
- [18F]MK-6240 Radioligand Delivery Indices as Surrogates of Cerebral Perfusion: Bias and Correlation Against [15O]Water
- Cryo-EM structure of Alzheimers disease tau filaments with PET ligand MK-6240
- Measurement of Cerebral Perfusion Indices from the Early Phase of [18F]MK6240 Dynamic Tau PET Imaging
- The Association of Age-Related and Off-Target Retention with Longitudinal Quantification of [18F]MK6240 Tau PET in Target Regions
- Impact of Amyloid and Tau PET on Changes in Diagnosis and Patient Management
- The association of age-related and off-target retention with longitudinal quantification of [18F]MK6240 tau-PET in target regions
- Direct Comparison of the Tau PET Tracers 18F-Flortaucipir and 18F-MK-6240 in Human Subjects
- TauIQ: A Canonical Image Based Algorithm to Quantify Tau PET Scans
- Olfactory impairment is related to tau pathology and neuroinflammation in Alzheimers disease
- In vivo synaptic density loss is related to tau deposition in amnestic mild cognitive impairment