


Abstract
The purpose of this study was to evaluate the feasibility of absolute quantification of regional cerebral glucose utilization (rCMRglc) in mice by use of 18F-FDG and a small animal PET scanner. rCMRglc determined with 18F-FDG PET was compared with values determined simultaneously by the autoradiographic 2-14C-DG method. In addition, we compared the rCMRglc values under isoflurane, ketamine and xylazine anesthesia, and awake states. Methods: Immediately after injection of 18F-FDG and 2-14C-DG into mice, timed arterial samples were drawn over 45 min to determine the time courses of 18F-FDG and 2-14C-DG. Animals were euthanized at 45 min and their brain was imaged with the PET scanner. The brains were then processed for 2-14C-DG autoradiography. Regions of interest were manually placed over cortical regions on corresponding coronal 18F-FDG PET and 2-14C-DG autoradiographic images. rCMRglc values were calculated for both tracers by the autoradiographic 2-14C-DG method with modifications for the different rate and lumped constants for the 2 tracers. Results: Average rCMRglc values in cerebral cortex with 18F-FDG PET under normoglycemic conditions (isoflurane and awake) were generally lower (by 8.3%) but strongly correlated with those of 2-14C-DG (r2 = 0.95). On the other hand, under hyperglycemic conditions (ketamine/xylazine) average cortical rCMRglc values with 18F-FDG PET were higher (by 17.3%) than those with 2-14C-DG. Values for rCMRglc and uptake (percentage injected dose per gram [%ID/g]) with 18F-FDG PET were significantly lower under both isoflurane and ketamine/xylazine anesthesia than in the awake mice. However, the reductions of rCMRglc were markedly greater under isoflurane (by 57%) than under ketamine and xylazine (by 19%), whereas more marked reductions of %ID/g were observed with ketamine/xylazine (by 54%) than with isoflurane (by 37%). These reverse differences between isoflurane and ketamine/xylazine may be due to competitive effect of 18F-FDG and glucose uptake to the brain under hyperglycemia. Conclusion: We were able to obtain accurate absolute quantification of rCMRglc with mouse 18F-FDG PET imaging as confirmed by concurrent use of the autoradiographic 2-14C-DG method. Underestimation of rCMRglc by 18F-FDG in normoglycemic conditions may be due to partial-volume effects. Computation of rCMRglc from 18F-FDG data in hyperglycemic animals may require, however, alternative rate and lumped constants for 18F-FDG.
Recent advances in the technology of PET have made it possible to image small animals such as rats and mice (1,2). PET imaging of mice provides unique opportunities to study in vivo normal physiology and pathophysiology of various disease models, particularly because transgenic manipulation of mice has created phenotypes with the potential to link specific genes to molecular and organ functions of both nondiseased and diseased animals (3). The major advantage of small animal PET studies over necropsy studies is that the former allows within-subject longitudinal studies (3,4).
A glucose analog, 18F-FDG, is the most frequently used radiopharmaceutical in clinical PET and animal PET studies. 18F-FDG PET uptake measurements in regions of interest (ROIs), expressed as percentage 18F-FDG uptake of the injected dose per gram (%ID/g) of tissue, are simple and easy to obtain. However, these 18F-FDG uptake measurements may not accurately reflect true regional rates of glucose utilization because 18F-FDG uptake can be affected by plasma glucose levels and other factors independent of the rate of glucose utilization. Fully quantitative PET studies require information on the time course of tracer delivery to the tissue. This “input function” is best obtained from direct arterial blood sampling during the PET study (4). Repeated blood sampling is readily feasible in rats (5) but very difficult in the mouse because of the small size of the vessels (∼1 mm) (6) and the total blood volume (2–3 mL) (4,7). Moore et al. (5) first reported quantitative measurements of regional cerebral glucose utilization (rCMRglc) in rats by using 18F-FDG and microPET. There are also reports of determinations of brain glucose utilization in genetically manipulated mice with the 2-14C-DG autoradiographic technique (8,9). Quantitatively accurate determinations of rCMRglc in mice with 18F-FDG and small animal PET have not yet been reported, however.
For the purposes of this study, we used 18F-FDG as a well-studied radioligand to assess feasibility and limitations of small animal PET studies in the mouse brain. Values for rCMRglc obtained with 18F-FDG PET were compared with those obtained concurrently with the autoradiographic 2-14C-DG method (10). PET imaging of small animals unfortunately requires animal immobilization during scanning, and anesthesia is often used to achieve this immobilization, even though anesthesia is known to affect rCMRglc (11,12). Therefore, we also examined and compared the values for rCMRglc obtained under isoflurane and ketamine/xylazine-mixed anesthesia and with those obtained in awake mice. We have used various anesthetics to obtain variability in the outcome measures of rCMRglc obtained with 18F-FDG PET and thereby provide a wider range of values to correlate with the gold-standard autoradiographic 2-14C-DG method.
MATERIALS AND METHODS
Animal Preparation
All animal procedures were performed in strict accordance with the National Institutes of Health (NIH) Guide for Care and Use of Laboratory Animals and approved by the National Institute of Mental Health (NIMH) Animal Care and Use Committee. Two-month-old wild-type male BALB/c mice weighing 28–34 g were obtained from Taconic Farms. The animals were housed in groups of 5 and allowed food and water ad libitum during their holding time. Because of their small glycogen reserve and rapid metabolism, the animals were not fasted and were provided with food and water until the morning of the experiment (13).
After anesthetizing the animals with 1% isoflurane, a 35-cm polyethylene catheter (PE 10; Intramedic, Clay Adams) (dead space: 0.02 mL) was inserted into the left femoral artery, and a 30-gauge needle (Beckton Dickinson) attached to a 30-cm polyethylene catheter (dead space: 0.02 mL) was inserted into the tail vein of all mice. The catheters and needles were secured with tissue adhesive (3M Vetbond). Mice were allowed free movement throughout a 3-h period of recovery from the anesthesia and surgery before initiation of the rCMRglc measurement.
Values for rCMRglc were determined in animals under 3 conditions: anesthetized with 1% isoflurane and 100% O2 administered by inhalation through a nose cone (n = 7); anesthetized by an intramuscular injection of a ketamine (100 mg/kg) and xylazine (10 mg/kg) mixture (n = 7): and awake animals (n = 6).
Physiologic Variables
Mean arterial blood pressure was measured with a Digi-Med Blood Pressure Analyzer (model 400; Micro-Med). Hematocrit was determined by centrifugation of arterial blood samples in a Micro-Centrifuge (Thomas Scientific). Arterial plasma glucose content was measured in a Beckman Glucose Analyzer 2 (Beckman Instruments). Body temperature was maintained in awake mice by warming the environment with a heating lamp. Body temperature in the anesthetized animals was monitored by a rectal temperature probe and maintained at 36.5°C–37.5°C by a heating lamp and heating pad throughout the procedure.
Small Animal PET Scanner
We used the National Institutes of Health Advanced Technology Laboratory Animal Scanner (ATLAS) small animal PET scanner with an effective transaxial field of view of 6.0 cm and a 2-cm axial field of view. The scanner contains 18 dual-layered phoswich detector modules of Ce-doped Lu18Gd0.2 (7 mm) and GSO (Ce-doped Gd2SiO5) (8 mm) (Hitachi). This phoswich design allows depth-of-interaction (DOI) detection while preserving a sensitivity of 2.7% (100–650 keV) (14). PET images were reconstructed by single-slice rebinning and 2D–ordered-subset expectation maximization (SSRB/2D OSEM) algorithm (5 iterations and 18 subsets), achieving a 1.5-mm full width at half maximum (FWHM) resolution at the center (15). The reconstructed voxel size was 0.28 × 0.28 × 1.125 mm. Coronal section images were created for subsequent data analysis. Image data were not corrected for attenuation or scatter.
rCMRglc Measurement Procedures
The procedure was initiated by injection of a mixture of 7.77–14.43 MBq of 18F-FDG and 0.13–0.15 MBq of 2-14C-DG through the tail-vein catheter (dual-tracer injection). We used Y connector for the tracer injection (volume: 0.05–0.22 mL) followed by saline flush (volume: 0.07 mL). Timed arterial samples of approximately 35 μL were collected before and at 15, 30, and 45 min after the injection. The blood samples were collected into heparin-treated tubes and immediately centrifuged, radioactivity was determined in 5 μL of plasma, and glucose was measured in 10 μL of plasma. Additional arterial samples of approximately 10 μL were drawn at 0–1 (6 continuous samples), 2, 5, and 10 min for radioactivity measurements. For blood collection, we first took 0.03 mL of heparinized saline and blood for dead space followed by each blood sampling. We returned the each blood sample for dead space to avoid excessive blood loss. The catheter was flushed with 0.03 mL of heparinized saline after each sample. During the blood sampling, hemostatic forceps were used to clamp the end of the catheter. Hematocrit was measured at 0 and 30 min, and mean arterial blood pressure was measured at 0 and 25 min. Plasma 18F-FDG concentration was assayed in an automated γ-well counter (Perkin Elmer Life Sciences) on the day of the experiment, and plasma 2-14C-DG concentration was measured in a liquid scintillation counter (Global Medical Instrumentation) for 14C on the following day. At the end of the period for arterial sampling (45 min), the animal was euthanized and then a PET scan was obtained. Euthanasia was performed with an intravenous ketamine injection and cervical dislocation. Although the major advantage of small animal PET is its capability of allowing live-animal imaging experiments, euthanasia was performed before the PET scan for the following reasons: no effective physiologic restraints were available to immobilize awake animals during the PET scanning; alternative use of anesthesia for immobilization may affect rCMRglc because of potential washout of 18F-FDG during the 15-min imaging period; and the 2-14C-DG autoradiographic method (10), which was used as the standard of comparison, does not include a delay period after the 45-min experimental period that was required for PET scanning at the end of the period. This choice of immobilization allowed us to evaluate not only the PET quantification of rCMRglc relative to the 2-14C-DG method but also the effects of anesthesia on rCMRglc during 18F-FDG uptake period compared with the awake condition. The duration of the PET scan was 15 min, after which the brain was removed, frozen in isopentane maintained at −40°C with dry ice, and stored at −80°C until sectioning. Brains were cut into 20-μm coronal sections in a cryostat at −22°C. The frozen brain sections were thaw-mounted on glass cover slips, immediately dried on a hot plate at about 60°C, and autoradiographed together with calibrated 14C-methylmethacrylate standards on Kodak EMC-1 x-ray film (9).
Calculation of rCMRglc and FDG Uptake
Absolute rCMRglc values for both tracers were calculated by the operational equation of the autoradiographic 2-14C-DG method (10) with adjustments of the rate and lumped constants for the plasma glucose concentrations and for differences in kinetic characteristics between the 2 tracers. Rate constants and lumped constants used in the computation were those previously determined in the rat. We used the following kinetic parameters and lumped-constant (LC) values for 2-14C-DG (10,16) and 18F-FDG (5,17), respectively: for animals in the normoglycemic range (6.0–19.7 mmol/L) (5,10,17), k1 = 0.189 and 0.302 min−1, k2 = 0.245 and 0.392 min−1, k3 = 0.052 and 0.068 min−1, and LC = 0.481 and 0.625; and for animals in the hyperglycemic range (16) (19.7–30.9 mmol/L), k1 = 0.127 and 0.203 min−1, k2 = 0.235 and 0.376 min−1, k3 = 0.042, and 0.055 min−1, and LC = 0.400 and 0.520.
The effects of hyperglycemia on these rate constants for 18F-FDG have not yet been published. Therefore, we adjusted the rate constants for 18F-FDG for the degree of hyperglycemia in proportion to the ratios of their published values for 2-14C-DG under hyperglycemic and normoglycemic conditions (16).
ROIs (3–5 mm2) were manually placed over 4 bilateral cortical regions (frontal, parietal, temporal, and occipital) on the coronal 18F-FDG PET images (slice thickness: 1 mm) (Fig. 1). Because of the lower spatial resolution and greater partial-volume effects of the PET images than those of the 2-14C-DG autoradiograms, the boundaries of the ROIs (3–5 mm2) were defined by the PET images and drawn on the corresponding 2-14C-DG autoradiograms. Furthermore, because the 2-14C-DG autoradiograms were derived from brain sections with a slice thickness of 0.02 mm, 50 contiguous serial sections totaling 1 mm in thickness, equivalent to that of the PET slices, were used, and the ROIs were placed on 12 technically optimal slices with minimum damage of tears, folds, or bubbles in bilateral cerebral hemispheres of the 50 contiguous serial sections. Two slices with highest ROI values and another 2 slices with lowest ROI values were then discarded. Thus, ROI values were obtained by averaging a total of 8 autoradiograms (corresponding to a summed thickness of 0.16 mm) (Fig. 1). Identification of anatomic structures was guided by the stereotactic mouse brain atlas (Fig. 1) (18). A calibration factor was determined by using a 3-cm diameter cylinder phantom with known activity-enabling-ROI counts per pixel to be converted to μCi (kBq)/g tissue, with the assumption that tissue density is 1 g/cm3. These values were divided by the injection dose (μCi [kBq]) to obtain an image-ROIs–derived 18F-FDG %ID/g of tissue. We performed linear regression analyses to determine the correlation between rCMRglc values determined with the 18F-FDG small animal PET and those with 2-14C-DG autoradiography. We determined differences in rCMRglc values between the 18F-FDG and 2-14C-DG methods for the 3 conditions (i.e., isoflurane anesthesia, ketamine/xylazine anesthesia, and the unanesthetized awake state) by paired t tests. Mean cortical rCMRglc determined with 2-14C-DG and 18F-FDG and the %ID/g uptake values among the 3 conditions were compared by unpaired t tests. The level of statistical significance was designated as P < 0.05.

Representative coronal 18F-FDG PET and 2-14C-DG autoradiographic images of brain sections of unanesthetized mouse with ROIs delineated on them. Fr = frontal cortex; Pa = parietal cortex; Te = temporal cortex; Oc = occipital cortex.
RESULTS
Physiologic Variables
Arterial blood pressures were significantly lower and arterial plasma glucose concentrations were significantly higher in isoflurane anesthetized mice than in awake mice, but the glucose concentrations were within a normoglycemic range (6.4–15.9 mmol/L) in both groups (Table 1). Arterial plasma glucose concentrations in the ketamine/xylazine–treated mice, however, were hyperglycemic (20.0–27.2 mmol/L), except for 2 mice (17.3 and 19.6 mmol/L) (Table 1). None of the other physiologic values differed statistically significantly among the isoflurane and ketamine/xylazine anesthetized and awake groups (Table 1).
Physiologic Variables Before Measurement of Cerebral Glucose Utilization in Mice
Comparison of rCMRglc Values Obtained with 18F-FDG Small Animal PET and 2-14C-DG Autoradiography
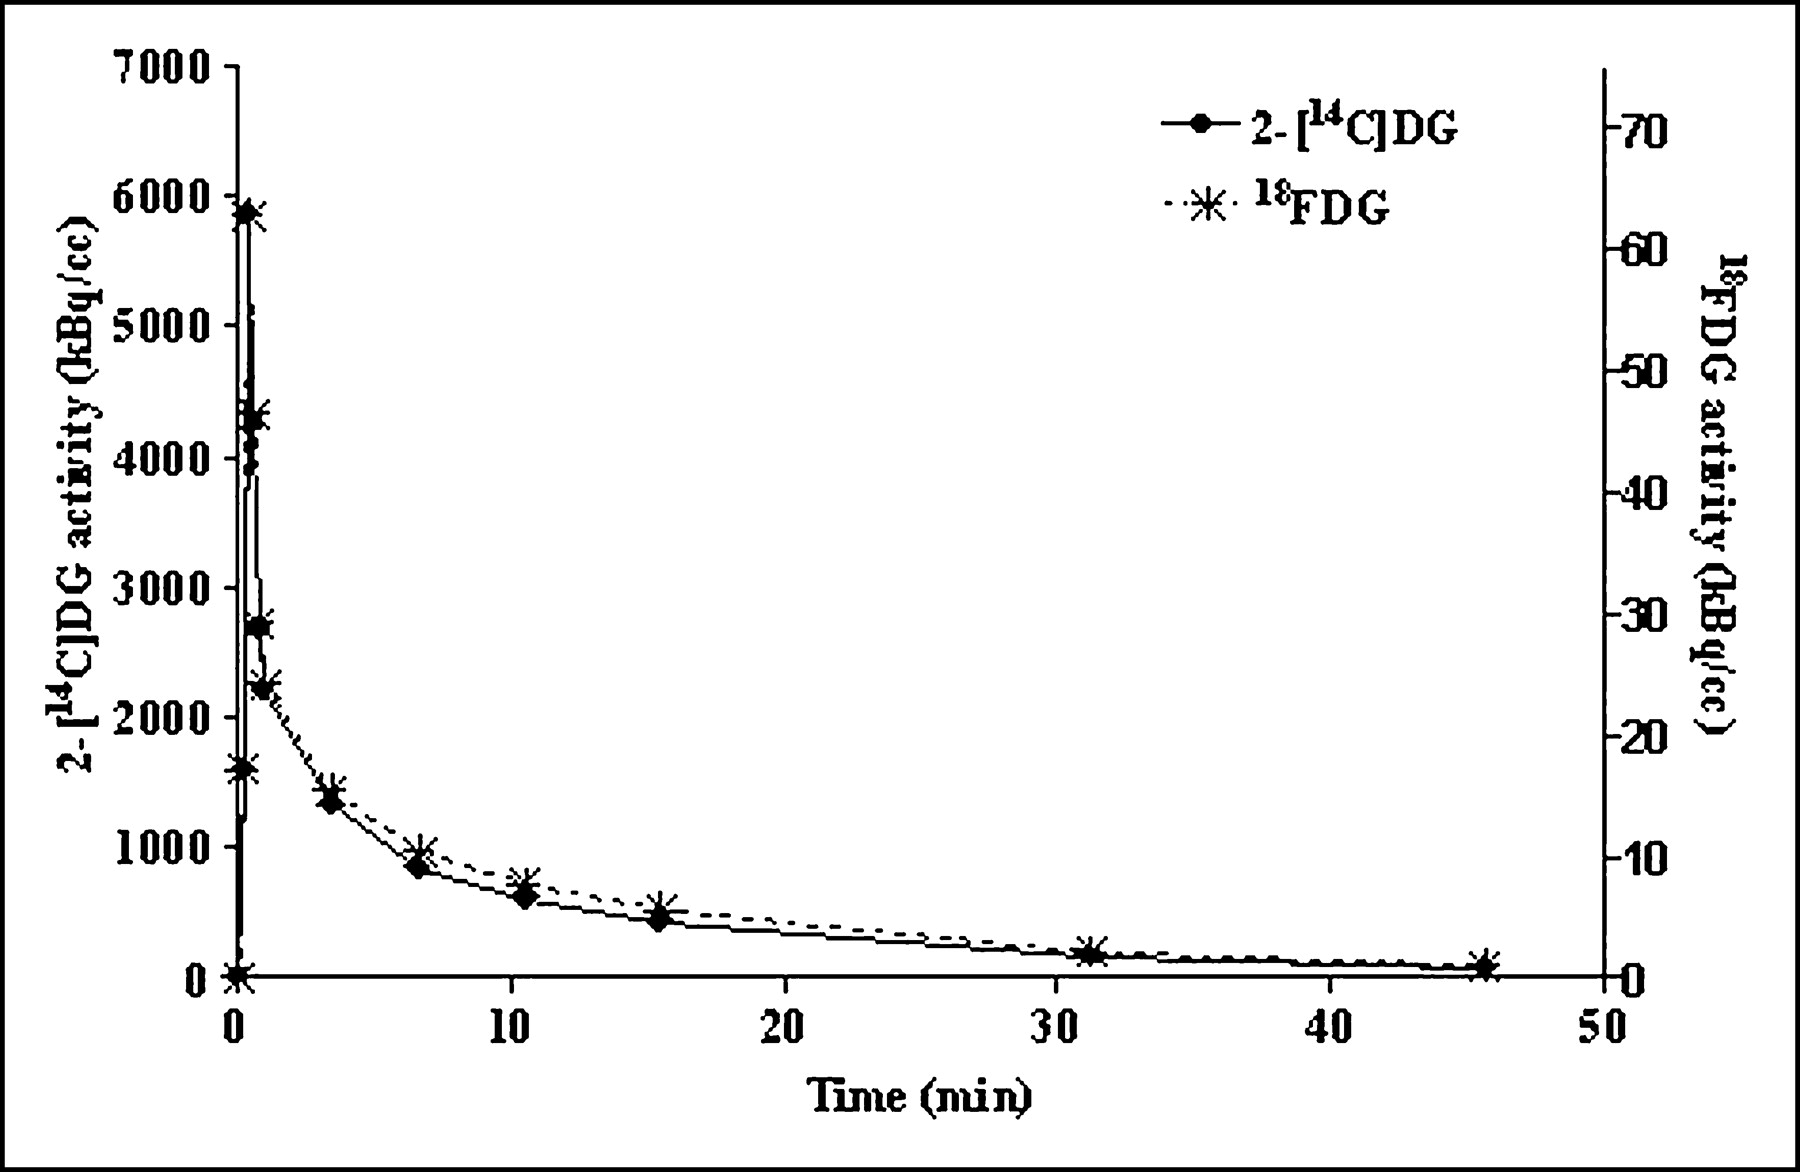
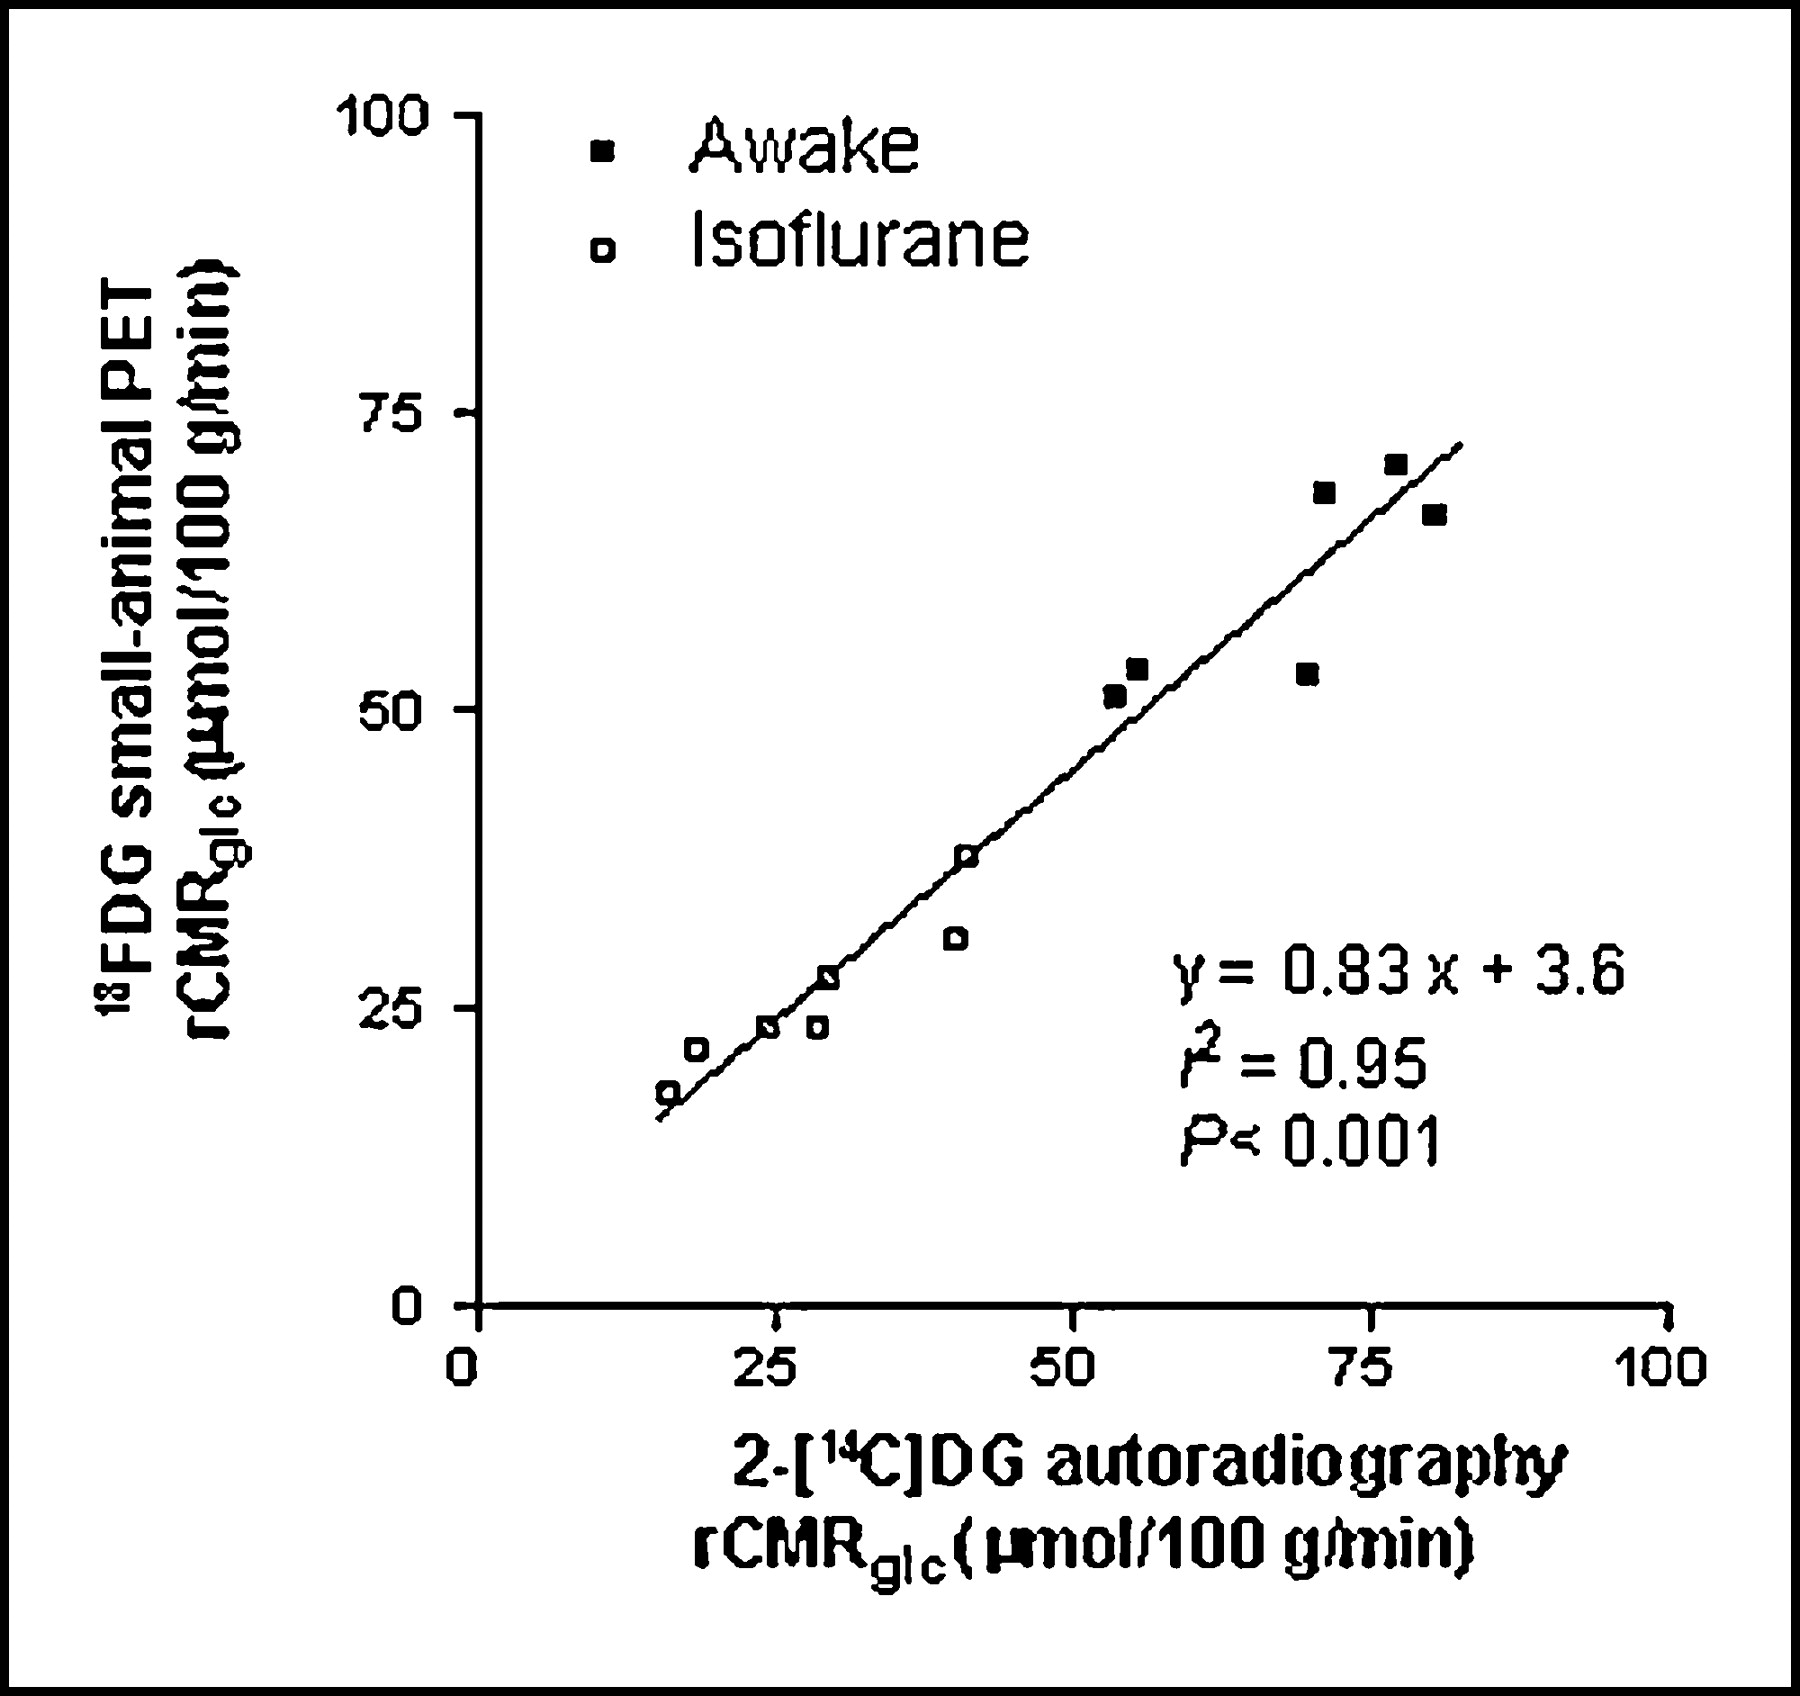
18F-FDG PET images were of adequate quality to allow visual identification of individual cortical regions (Fig. 1). The shape of the plasma time–activity curves for 18F-FDG and 2-14C-DG was nearly identical, although the magnitude of activity was different between the 2 tracers (Fig. 2). For normoglycemic mice (isoflurane anesthetized and awake), average cortical values for rCMRglc determined with 18F-FDG correlated highly with those of 2-14C-DG (y = 0.83x + 3.6, r = 0.98, r2 = 0.95, P < 0.001) (Fig. 3) but were lower than those obtained with 2-14C-DG by 8.3% (Table 2). This slight underestimation of rCMRglc by the 18F-FDG PET method was likely due to partial-volume effects (see the Discussion section). Although our calculations of rCMRglc by the 18F-FDG PET as well as the 2-14C-DG methods included adjustments of the rate constants and LC for hyperglycemia in the animals under ketamine and xylazine anesthesia, the average values for rCMRglc obtained with PET overestimated those obtained with 2-14C-DG by 17.3% (Table 2).

Representative time–activity curves of 18F-FDG and 2-14C-DG in unanesthetized mouse.

Comparison of weighted-average rCMRglc (μmol/100 g/min) determined by 18F-FDG small animal PET and 2-14C-DG autoradiography in cortical ROIs of normoglycemic, awake and isoflurane anesthetized mice.
Mean ± SD of rCMRglc (μmol/100 g/min) in Each Cerebral Cortex Under Isoflurane, Ketamine/Xylazine, and Awake
Comparison of rCMRglc and FDG Uptake (%ID/g) Values Under Isoflurane and Ketamine and Xylazine Anesthesia and Awake State
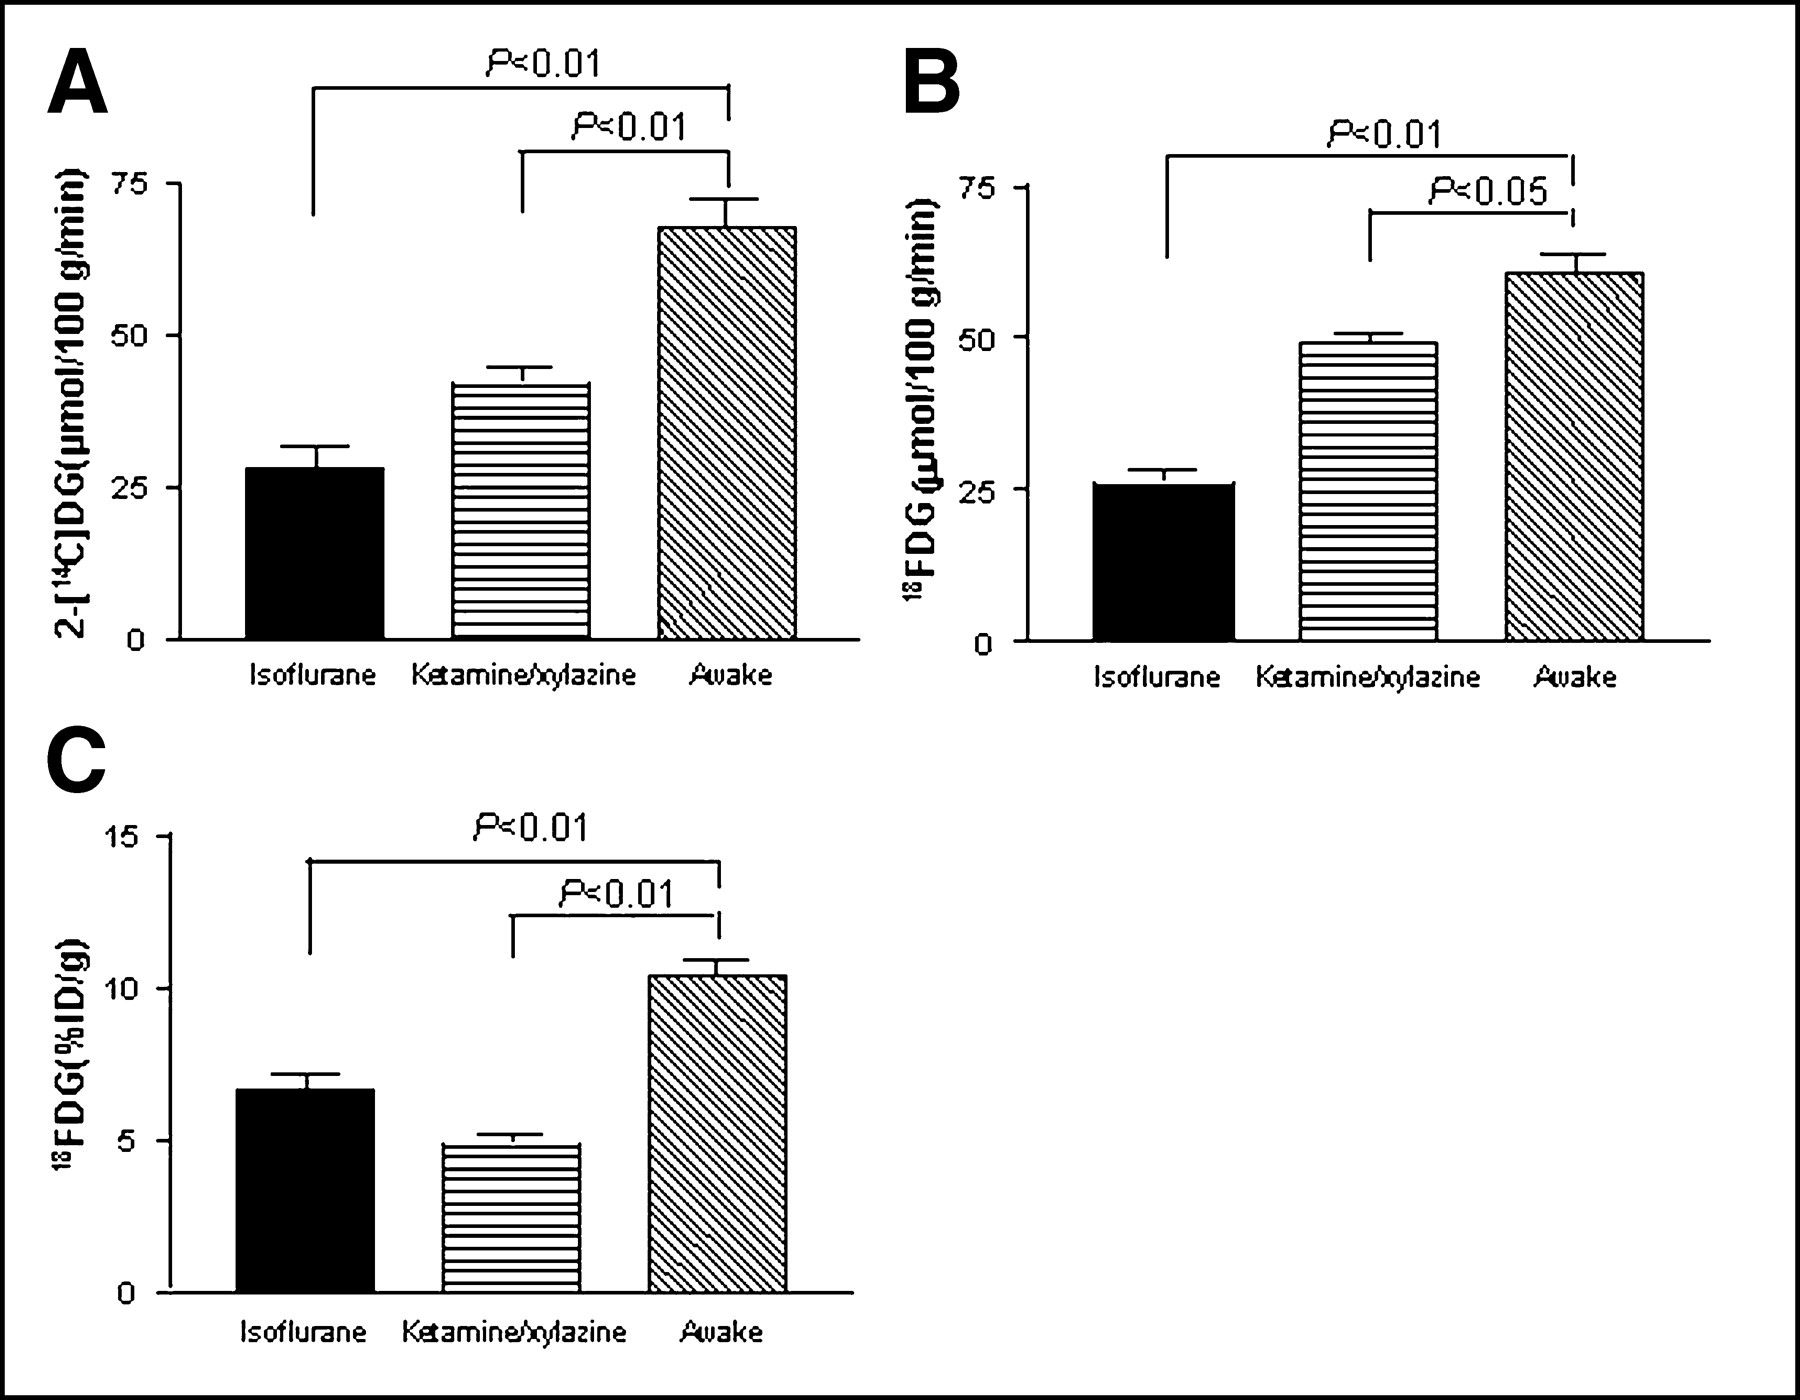
Average values for cortical rCMRglc determined with 2-14C-DG were significantly lower under both isoflurane (28.0 ± 9.7 μmol/100 g/min) and ketamine and xylazine anesthesia (41.9 ± 7.5 μmol/100 g/min) than those in the awake animals (67.6 ± 11.1 μmol/100 g/min). The reductions were more marked with isoflurane (by 59%) than with ketamine and xylazine (by 26%) (Fig. 4A). Likewise, average cortical rCMRglc determined with 18F-FDG PET in both the isoflurane (26.0 ± 6.5 μmol/100 g/min) and ketamine and xylazine anesthetized (48.8 ± 5.3 μmol/100 g/min) groups were significantly lower than those in the awake group (60.5 ± 8.8 μmol/100 g/min), with the reductions under isoflurane greater (by 57%) than under ketamine and xylazine (by 19%) (Fig. 4B). However, average FDG uptake values (expressed as %ID/g and not corrected for the plasma input function) were significantly lower with both isoflurane (6.6 ± 1.6) and ketamine and xylazine (4.8 ± 0.9) conditions than in the awake (10.4 ± 1.3) condition, with more marked reductions with ketamine and xylazine (by 54%) than with isoflurane (by 37%) (Fig. 4C).

Comparison of weighted-average cortical rCMRglc (μmol/100 g/min) determined by 2-14C-DG autoradiography (A) and 18F-FDG PET (B) and of 18F-FDG uptake (%ID/g) (C) in mice under isoflurane or ketamine/xylazine anesthesia and awake mice.
DISCUSSION
The present study shows that in vivo 18F-FDG PET imaging in mice allows absolute quantification of average rCMRglc with an accuracy comparable with that obtained with the 2-14C-DG autoradiographic method. It should be noted, however, that this is true only of average values within PET-defined ROIs that are relatively large compared with that possible with 2-14C-DG autoradiography, which provides much finer spatial resolution and quantitative determinations within structures with different rates within those ROIs. This study determined rCMRglc in vivo in mice concurrently with both 18F-FDG PET and the 2-14C-DG autoradiographic method and is an extension of prior studies in the literature (8,9). Moore et al. reported that quantitative 18F-FDG microPET determinations of rCMRglc in rats were only modestly correlated with those obtained with 2-14C-DG autoradiography (r = 0.47, P < 0.05) values (5). The reason for the higher correlation (r = 0.98) in our studies in mice is probably due to methodologic differences between our study and theirs. We injected 18F-FDG and 2-14C-DG simultaneously and drew timed arterial samples to determine simultaneously the input functions for both tracers. The mice were killed 45 min after injection, immediately after drawing the last blood sample. The brain was scanned with the small animal PET scanner and then removed, frozen, and autoradiographed. The determinations of rCMRglc with the 2 procedures were performed simultaneously during the same period of uptakes of both tracers and, therefore, under identical physiologic conditions. In contrast, Moore et al. (5) conducted the 18F-FDG microPET study on the day of the surgery for head injury and the 2-14C-DG autoradiographic study on the following day. Although their colleagues at the University of California, Los Angeles, had previously claimed that the magnitude of the cerebral metabolic depression does not differ significantly between days 1 and 2 after head injury (19), the values for rCMRglc that Yoshino et al. obtained showed considerable variability between days 1 and 2 (19). Therefore, measurements of rCMRglc on different days with the head injury model may not be as precise as simultaneous measurements in normal animals. In addition, different tracer injections and blood sampling procedures in the study by Moore et al. might account for the lower correlation between their 18F-FDG microPET study and 2-14C-DG autoradiographic study. The slight underestimation (by 8.3%) of rCMRglc determined with the 18F-FDG PET method compared with that obtained with the 2-14C-DG method is likely due to the lower spatial resolution of PET. First, the slice thickness of the PET scans was about 1 mm, whereas that of the autoradiographed slices was about 0.02 mm. Second, the FWHM of PET was 1.5 mm, whereas that of the autoradiograms was approximately 0.1 mm. Therefore, although we placed comparable cerebral cortical ROIs on both 18F-FDG and 2-14C-DG images, the same ROIs on the 18F-FDG images probably included greater contributions from white matter than the 2-14C-DG images because of lesser distinction of the cortical boundary from the subcortical white matter, which was due to the greater partial-volume effects with PET than with autoradiography. To examine further the effect of lower spatial resolution on the computed rCMRglc, we blurred a 2-14C-DG autoradiogram so that it had a similar spatial resolution to that of the 18F-FDG PET images and found that this reduced the recovered activity in the ROIs over the parietal cortex by 15% below that obtained with the original unblurred autoradiogram. This underestimation is similar to the percentage difference between rCMRglc determined in the parietal cortex with 2-14C-DG autoradiography and with 18F-FDG (17%) (Table 2).
Xylazine, an α2-adrenergic receptor agonist, reduces circulating insulin because of direct stimulation of α2-adrenergic receptors on pancreatic islet cells, thereby reducing insulin release and leading to elevated plasma glucose concentrations (20,21). Consequently, plasma glucose levels in our ketamine and xylazine anesthetized mice were in a hyperglycemic range (i.e., almost 3 times the normal level). On the other hand, isoflurane-associated hypoinsulinemia is generally mild (20,22), and plasma glucose levels in the isoflurane anesthetized group, though statistically significantly higher than those of awake mice, were within a normoglycemic range. Our observed effects of anesthesia on plasma glucose levels are consistent with those of previous reports (11,12). Because glucose competitively inhibits 2-14C-DG and 18F-FDG transport across the blood–brain barrier and its phosphorylation by hexokinase, plasma glucose levels can influence the computation of rCMRglc. Orzi et al. (16) reported that the kinetic parameters, k1 and k3, for 2-14C-DG decrease with increasing arterial plasma glucose concentrations. The effects of hyperglycemia on these rate constants for 18F-FDG have not yet been published (17). Therefore, for the purpose of the present studies we adjusted the rate constants for 18F-FDG for the degree of hyperglycemia in proportion to the ratios of their published values for 2-14C-DG under hyperglycemic and normoglycemic conditions (16). Compared with values obtained with the 2-14C-DG autoradiography, however, 18F-FDG PET underestimated rCMRglc in both isoflurane anesthetized and awake mice with plasma glucose levels in the normoglycemic range. This underestimation is probably not due entirely to inaccuracies in the rate and lumped constants. It is likely that partial-volume effects also contributed to this underestimation. Partial-volume effects cannot, however, explain the overestimation of rCMRglc obtained with 18F-FDG PET in the cortical regions of the hyperglycemic mice under ketamine and xylazine anesthesia. It is clear that more definitive evaluation of the kinetic constants for 18F-FDG in normoglycemic and hyperglycemic mice is needed.
Our findings by both the 18F-FDG PET and autoradiographic 2-14C-DG procedures of reduced rCMRglc in mice under isoflurane anesthesia are consistent with the approximately 40%–60% reductions previously found with the 2-14C-DG autoradiographic method in rats (23,24). On the other hand, the reductions in rCMRglc we observed with both techniques during ketamine and xylazine anesthesia may appear to be inconsistent with the findings of others who reported that ketamine alone produces a variety of effects among the various structures of the brain (e.g., reductions in components of the sensory pathways and increases in those of the limbic system) (11,25). This apparent discrepancy may be attributed to our use of the combination of ketamine and xylazine mixture in contrast to ketamine alone used in the other studies (11,25). Ketamine is the most common dissociative anesthetic used in rodents (26) and when used alone in rats and mice, it causes muscle rigidity and incomplete anesthesia. To compensate for this problem, combinations of ketamine and xylazine have been used as tranquilizers (26), and this mixture produces excellent sedation and relaxation (27). A combination of ketamine with diazepam, another supplement, also causes a generalized decrease of rCMRglc in rats (11), similar to our findings with that of the ketamine and xylazine mixture in the mouse brain. In addition, the greater decrease in 18F-FDG %ID/g in the ketamine and xylazine mixture than in isoflurane may be due to the competitive inhibition of 18F-FDG uptake with increased glucose concentrations in plasma as produced with the xylazine effect (16,21). The rank order of plasma glucose values was inversely related to FDG uptake, such that uptake with ketamine and xylazine < isoflurane < awake. Failure to take arterial glucose into account in measuring brain uptake of labeled glucose or its analogs is only one example. Studies of the effects of some physiologic tests on something related to cerebral blood flow by either functional MRI or PET is even more serious. Cerebral blood flow is much more sensitive to several blood constituents than to functional activity in brain tissue (e.g., pH, Pco2), and these can readily be changed by the test conditions but would not be perceived without blood sampling.
Limitations and rCMRglc Quantification
In the present study, we used 18F-FDG as a well-studied radioligand to assess feasibility and limitations of small animal PET in the mouse brain. Here, several limitations of the present study that are related to the accuracy of rCMRglc measurements are summarized to alert researchers who plan to use genetically modified mice with small animal PET on the appropriate use of this evolving technology. There are several factors that can affect the quantitative accuracy of rCMRglc measurements.
First, to clarify the terminology, “accuracy” was used in the present study to refer to how close the 18FDG PET rCMRglc measurements were to those of 2-14C-DG autoradiography, which was considered to be the true rCMRglc values in our study. In this context, we showed that PET measurements of 18F-FDG rCMRglc in mice were reasonably accurate compared with the concurrent autoradiographic measurements of 2-14C-DG rCMRglc in the same mice under the same physiologic conditions during the 18F-FDG and 2-14C-DG uptake period. However, despite relatively large ROIs, 18F-FDG rCMRglc measurements underestimated those of 2-14C-DG by 10%. This underestimation of 18F-FDG rCMRglc measurements appears to have resulted from the larger partial-volume effect with PET than with autoradiography. Although ROIs for the striatum and thalamus that were visible on PET images (Fig. 1) can be defined, these small in vivo ROIs would have greater partial-volume effects than the ex vivo autoradiographic ROIs. Thus, the spatial resolution of current small animal PET systems poses a major limitation of PET imaging for the small mouse brain. Despite this underestimation of 18F-FDG rCMRglc measurements, we believe that these 18F-FDG rCMRglc measurements reflect more accurately true glucose utilization than another commonly used glucose utilization outcome measure—namely, 18F-FDG %ID/g.
Second, kinetic parameter and LC values affect the rCMRglc measurements. Currently, there are no established parameter or LC values for mice. In the present study, we used rat values under normoglycemic conditions reported in the literature for both 18F-FDG and 2-14C-DG. Although these rat values did not affect our accuracy of 18F-FDG rCMRglc measurements relative to 2-14C-DG rCMRglc measurements, these values can certainly affect the accuracy of true rCMRglc measurements in the mouse brain. Under hyperglycemic condition, however, there are no established rat 18F-FDG parameter values. Therefore we attempted to scale 18F-FDG rate constants in proportion to the values for 2-14C-DG. However, under hyperglycemia (ketamine/xylazine), 18F-FDG rCMRglc measurements were higher than those of 2-14C-DG by 17%. This finding was contrary to what we had expected in view of the greater partial-volume effect for the PET. Therefore, in view of the absence of well-established literature values for these parameters for 18F-FDG under hyperglycemia, we speculate that the parameter and LC values used under hyperglycemia may not be correct. This means that we would need to establish appropriate 18F-FDG rate constant values under hyperglycemia, warranting future experiments addressing this issue.
Third, the physiologic conditions during 18F-FDG or 2-14C-DG uptake period can affect rCMRglc. Our study design ensured that 18F-FDG and 2-14C-DG measurements had an identical physiologic condition during the tracer uptake period. To use the 2-14C-DG rCMRglc measurement as the gold standard in evaluating the accuracy of 18F-FDG rCMRglc measurement, we killed the animal after the uptake period in the present experimental design.
Last, measurement error in plasma input function can affect the accuracy of the 18F-FDG and 2-14C-DG rCMRglc measurement relative to the true value. The current study design did not allow us to directly evaluate this accuracy. However, the plasma 18F-FDG or 2-14C-DG concentrations are directly measured, and, at least in our hands, the errors in their measurements would primarily be pipetting and counting errors. These errors should be small and would probably contribute insignificantly to the computed rCMRglc values compared with the effects of the errors in the measurements of tissue concentrations, particularly with PET. Indirectly, this rCMRglc measurement inaccuracy that is due to error in measurement of plasma input function may be reflected by the small difference of intersubject variability of rCMRglc measurements between 2-14C-DG and 18F-FDG. The coefficients of variation of rCMRglc measurement in the sample of normoglycemic mice (n = 13) for 18F-FDG and 2-14C-DG were as follows: 46% (18F-FDG) and 49% (2-14C-DG), which suggest that the error in plasma measurements, if any, was not any greater for 18F-FDG than for 2-14C-DG.
CONCLUSION
We assessed the feasibility and limitations of small animal PET studies in the mouse brain with 18F-FDG small animal PET scanning. Concurrent determinations of rCMRglc with the 2-14C-DG autoradiographic method and 18F-FDG PET imaging with the ATLAS small animal scanner demonstrated that the PET imaging technique allows accurate absolute quantification of rCMRglc in mice within the limits of the resolution possible with PET. Because of the limited spatial resolution of PET, the ROIs are necessarily larger than those possible with autoradiography and encompass a mixture of cerebral structures, with various rates of rCMRglc clearly visible in the autoradiograms. If the same low-resolution ROIs that are possible with PET are also applied to the autoradiographic images, the computed rCMRglc is the weighted average of the rCMRglc in the tissue components within the ROI. The present studies demonstrated that 18F-FDG PET can provide accurate estimates of the average rCMRglc within these ROIs. The anesthetic effects described here with 18F-FDG PET apply only to this specific radioligand and must be assessed for any new probe that is examined.
Acknowledgments
We thank Jane Jehle, Laboratory of Cerebral Metabolism, and Sami Zoghbi, PhD, Molecular Imaging Branch, National Institute of Mental Health, for valuable help and suggestions. We also thank Michael A. Channing, PhD; Kazuaki Shimoji, MD; and all of the people in the PET department at the Warren Grant Magnuson Clinical Center, National Institutes of Health, for providing 18F-FDG and valuable help. This work was presented in the scientific session and introduced in the scientific meeting highlights session by Henry Wagner, Jr., MD, at the 50th Annual Meeting of the Society of Nuclear Medicine in New Orleans, Louisiana, June 21–25, 2003.
Footnotes
Received Oct. 14, 2003; revision accepted Feb. 5, 2004.
For correspondence or reprints contact: Hiroshi Toyama, MD, PhD, Department of Radiology, Fujita Health University, 1-98, Dengakugakubo, Kutsukake, Toyoake, Aichi, Japan, 470-1192.
E-mail: htoyama{at}fujita-hu.ac.jp
REFERENCES


Jump to section
Related Articles
Cited By...
- Assessment of Neurovascular Uncoupling: APOE Status is a Key Driver of Early Metabolic and Vascular Dysfunction
- Reduced metabolism in the hypothalamus of the anorectic anx/anx mouse
- Brain GLUT4 Knockout Mice Have Impaired Glucose Tolerance, Decreased Insulin Sensitivity, and Impaired Hypoglycemic Counterregulation
- Mapping Changes in Mouse Brain Metabolism with PET/CT
- Evaluation of Mouse Tail-Vein Injections Both Qualitatively and Quantitatively on Small-Animal PET Tail Scans
- Effects of Administration Route, Dietary Condition, and Blood Glucose Level on Kinetics and Uptake of 18F-FDG in Mice
- Reply: Beta-cell Imaging: Opportunities and Limitations
- Increased uptake of [123I]meta-iodobenzylguanidine, [18F]fluorodopamine, and [3H]norepinephrine in mouse pheochromocytoma cells and tumors after treatment with the histone deacetylase inhibitors
- Establishment of In Vivo Brain Imaging Method in Conscious Mice
- Human Brain Glycogen Metabolism During and After Hypoglycemia
- Quantification of Cerebral Glucose Metabolic Rate in Mice Using 18F-FDG and Small-Animal PET
- Small-Animal SPECT and SPECT/CT: Important Tools for Preclinical Investigation
- In Vivo Quantitation of Glucose Metabolism in Mice Using Small-Animal PET and a Microfluidic Device
- Optimizing Experimental Protocols for Quantitative Behavioral Imaging with 18F-FDG in Rodents
- Effects of Anesthetic Agents and Fasting Duration on 18F-FDG Biodistribution and Insulin Levels in Tumor-Bearing Mice
- Biologic Correlates of Intratumoral Heterogeneity in 18F-FDG Distribution with Regional Expression of Glucose Transporters and Hexokinase-II in Experimental Tumor