


Abstract
This study investigated regional cerebral blood flow in head-injured patients using statistical parametric mapping (SPM) to detect hypoperfusion on 99mTc-hexamethylpropyleneamine oxime (HMPAO) SPECT scans. Methods: Acute and follow-up SPECT and MRI scans from 61 patients who were admitted to a regional neurosurgical unit were examined. Patients had acute MRI and SPECT at 2–18 d after injury and on follow-up between 130 and 366 d after injury. Thirty-two scans from non–head-injured patients were used as a SPECT control group. The SPECT images were first aligned to the Talairach–Tournoux atlas and then analyzed statistically with SPM. Results: SPECT detected more extensive abnormality than MRI in acute and follow-up stages. This effect was more pronounced on follow-up of patients with diffuse injury. Examination of a focal injury group indicated the involvement of frontal and temporal lobes and the anterior cingulate. Blood flow abnormalities persist, to a lesser extent, on follow-up scans. The diffuse group displayed low blood flow in the frontal and temporal lobes, including cingulate involvement, which persists at follow-up with additional involvement of the thalamus. Conclusion: SPM has a role in SPECT image interpretation because it allows better visualization than other methods of quantitative analysis of the spatial distribution of abnormalities in focal and diffuse head injury. Frontal lobe blood flow abnormality (particularly anterofrontal regions and mesiofrontal areas) is common after head injury.
Experience with SPECT in the assessment of head injury has shown that it may reveal abnormalities that are not detected by CT or MRI (1). Interpretation of SPECT images has frequently involved blind reading by experienced practitioners. This can be a visual grading scheme based on (a) color scales (2–6); (b) visual assignment of scores (3,7,8); or (c) classification into categories such as nonfocal, meningial, or focal lesions (9) and, in other cases, diffuse or focal lesions (10,11). This kind of SPECT interpretation suffers from problems such as operator subjectivity, low reproducibility, and extensive time expenditure in analyzing images.
Regions of interest (ROIs) are by far the most popular method of quantitative analysis of SPECT images in head injury. On some occasions, ROIs are drawn manually (12–14) with a computer input device such as a mouse and, on other occasions, anatomically derived templates are used (15). The manual placement of ROI templates on images is time-consuming, and if the images are not aligned to each other or to a standard space the brain regions measured with the same ROI template could be significantly different. Alignment to a standard space is an issue that has received little attention in SPECT studies. Some researchers ensure appropriate positioning of subjects during scanning and do not align the images further after they have obtained them. Manual alignment to the orbitomeatal line (3,8,13,16,17) or a plane near this is a procedure that is often used (5,6). However, this process is inexact.
The use of standard ROI templates can reduce the spatial resolution of the study. A small lesion in a large ROI will produce a minor change in the overall result. The result will not be region specific because the precise location of the lesion will be lost. Conversely, a small ROI applied to a large lesion will not reveal the full extent of the lesion. Comparison of equivalent areas in left and right hemispheres by manually drawing ROIs around lesions also is time-consuming, is subjective, can suffer from localization problems, and can result in erroneous results if diaschisis is present.
Most of the methods described so far play an important role in the absence of automated, quantitative methods. An automatic method would reduce the time needed to produce results and would allow greater consistency in reported results and comparisons between scientific groups where studies are of a similar nature. We have been studying the use of statistical parametric mapping (SPM) (18) as a tool for the identification of lesions. The SPM’96 software suite, developed at the Wellcome Functional Imaging Laboratory, London, U.K. (http://www.fil.ion.bpmf.ac.uk/spm/), includes facilities to spatially transform brain images into standard stereotactic space and to smooth, normalize, and statistically analyze those images. SPM was chosen because it is in a format that is readily available and strongly supported. It offers objective, quantitative voxel-by-voxel analysis and, over the past few years, it has evolved and become accepted in activation and structural studies of the brain. It was designed for PET and MR images but more research groups are gradually using it to locate perfusion deficits (lesions) on hexamethylpropyleneamine oxime (HMPAO) SPECT images (19–21).
In a previous study (22) we investigated the use of SPM to identify synthetic blood flow abnormalities and to estimate their volume. Synthetic lesions were used to obtain images with known and controllable volumes and intensity levels. The results showed that proportional scaling was the most appropriate global normalization method for SPECT images. Analysis of covariance was useful where very large lesions were present and normalization external to SPM’96 was not available. Optimal results were produced when the height threshold was set around P ≤ 0.01 and the gray matter threshold was set to a value of <0.5. These studies examined an extensive range of simulated lesion depths and volumes and clearly showed that, with suitable adjustments of the thresholds, SPM’96 was able to detect the greatest part of any SPECT lesion in the range tested and is therefore a useful tool in SPECT lesion studies (22).
After completion of the validation studies, SPM’96 was used to investigate whether head-injured patients with focal and diffuse patterns of injury differ with respect to evolution of lesions over time.
MATERIALS AND METHODS
Subjects
Subjects were 61 head-injured patients admitted to a regional neurosurgical unit who fulfilled the criteria for inclusion in the study and for whom consent was obtained. Patients were excluded who had a prior history of head injury (leading to loss of consciousness), intracranial operation, psychiatric illness treated by hospitalization, treatment for alcoholism or drug abuse, epilepsy, or learning disability. For unconscious patients, consent was obtained from a relative or guardian. Patients were drawn from a larger group of 103 patients in the study if they had acute and follow-up SPECT and MR images that were of sufficient quality and completeness to be analyzed. In acute head injury, imaging is often problematic because of lack of cooperation from patients during scanning. The age of patients ranged from 17 to 60 y at the time of injury (mean age ± SD, 27.62 ± 10.15 y). On the first admission to hospital 27 patients had Glasgow Coma Scale (GCS) (23) scores of 13–15, 9 had GCS scores of 9–12, and 25 had GCS scores of 3–8. Patients had acute MRI and SPECT at 2–18 d after injury when they were medically stable and follow-up imaging between 130 and 366 d after injury. MRI and SPECT were performed on the same day.
Subgroups were formed by identifying patients with focal and diffuse injuries. A focal injury was defined as a lesion, or lesions, in hemispheric regions on acute MRI with a total volume of ≥25 cm3 or an intradural operation for evacuation of hematoma. A diffuse injury was defined as the patient having a GCS score of ≤8 on admission to a hospital accident and emergency unit (i.e., the patient was in a coma on arrival and unconscious since injury) or acute MRI evidence of diffuse injury indicated by lesions in the corpus callosum, brain stem, or internal capsule (24,25) or small abnormalities at the gray matter-white matter junction or in deep matter (26). The focal group consisted of 22 patients (mean age ± SD, 30.6 ± 11.2 y) and the diffuse group consisted of 22 patients (mean age ± SD, 26.1 ± 10.1 y). A group termed “other” consisted of 17 patients (mean age ± SD, 25.8 ± 8.3 y) who either fulfilled criteria for both types of injury (i.e., mixed lesions; n = 7) or fulfilled criteria for neither (n = 10).
Thirty-two scans from non-head-injured patients (mean age ± SD, 44.94 ± 16.78 y) were used as a SPECT control group. These scans were obtained from archived scans of non-head-injured patients referred to the neurologic unit for investigation whose SPECT scans were found to be normal by experienced reporters and who had had no further history of neurologic investigation.
Scanning Procedures
SPECT imaging of cerebral blood flow of the patients and of 32 control subjects was performed using a maximal dose of 500 MBq 99mTc-HMPAO (Ceretec; Amersham Health, Amersham, Buckinghamshire, U.K.) that was injected intravenously (patients were resting with their eyes closed). The SME 810 Novo scanner (Strichman Medical Equipment, Boston, MA) is a high-resolution dedicated head-section scanner with an in-plane resolution of 8 mm and a longitudinal resolution of approximately 12 mm. Sixteen 2-min slices were typically acquired with a slice spacing of 6–8 mm, dictated by the time a patient would lie comfortably on the scanning couch. The scan orientation was approximately parallel to the orbitomeatal line, and head movement during the scanning procedure was minimized by subject cooperation and assisted by placing foam supports on either side of the subject’s head. The subjects had their eyes closed, and the only background noise was caused by machinery cooling fans. Image acquisition began approximately 15 min after injection. Total acquisition time was 20–32 min.
MR scans were obtained using a Vista 1100 0.15-T resistive system (Picker International, Cleveland Heights, OH) operating at 6.38 MHz. An initial 2-cm-thick spinecho (repetition time/echo time [TR/TE], 200/40) pilot image in the sagittal or coronal plane was used to determine the positions of 16 slices, each 8-mm thick for a T2-weighted spinecho (TR/TE, 2,000/80) sequence, and an 8-slice T1-weighted inversion recovery (TR/TI/TE [where TI = inversion time], 1,660/400/40) sequence in the axial plane. Follow-up imaging and acute imaging were aligned with internal landmarks. For 19 patients, follow-up imaging was performed on a Magneton 1.5-T system (CTI/Siemens, Knoxville, TN) using a similar protocol. MRI sequences were chosen to optimize visual contrast between lesion and normal tissue. Images were analyzed in a semiautomated ROI fashion using standard MRI software provided by the manufacturer. The lesions were determined from T2-weighted images by a single expert who drew lesion boundaries using the software. Because the MRI pulse sequences used on the 2 scanners produced similar resolution and contrast, a measurable systematic effect on lesion definition is unlikely.
Image Analysis
The images were first aligned to the Talairach-Tournoux atlas (27) with 12-point affine transformation (28). They were then smoothed with an isotropic gaussian filter to improve the signal-to-noise ratio and to reduce errors attributed to interindividual variation in gyral and sulcul anatomy. To account for blood flow differences and variation in tracer uptake between individuals, proportional scaling was used to globally normalize the images. The gray-matter threshold was set to 0.5. Each SPECT image was tested against 32 controls in SPM’96 with a replication-of-conditions experiment. Age was used as a confounding covariate. Results were obtained at P < 0.05 corrected for multiple comparisons. This is a more conservative threshold than that suggested by the simulation study (22) and minimizes the reporting of false-positives.
The SPM result showing blood flow deficits for each patient was converted to a black-and-white Analyze (Biomedical Imaging Resource, Mayo Foundation for Medical Education and Research, Rochester, MN) image (white signified abnormality and black signified normal tissue or background) using the SPM results facility. Composite displays of blood flow deficits, indicating frequency distribution of abnormalities in focal and diffuse injury, were obtained by summing the black-and-white images for each group. To aid presentation, the composite images were smoothed and thresholded at 10% to remove artifacts. This method allowed appreciation of the full frequency range of blood flow abnormalities within a group and, consequently, highlighted the heterogeneous nature of head injury. The main regions were identified by taking representative coordinates from the display and looking up the Talairach-Tournoux atlas (27).
RESULTS
In the patient group as a whole (n = 61), SPECT detected more abnormality than MRI in acute and follow-up stages. An example of raw SPECT images that show typical lesions together with lesion detection results obtained from SPM is shown in Figure 1. The mean lesion volumes on SPECT and MRI are shown in Table 1. The differences were significant at the follow-up stage (t60 = 4.20; P < 0.001) but were not significant at the acute stage (t60 = 0.918; P < 0.362). The lesion volume detected by MRI correlated well with the lesion volume detected by SPECT at acute (0.734, significant at P = 0.01) and follow-up (0.725, significant at P = 0.01) stages.
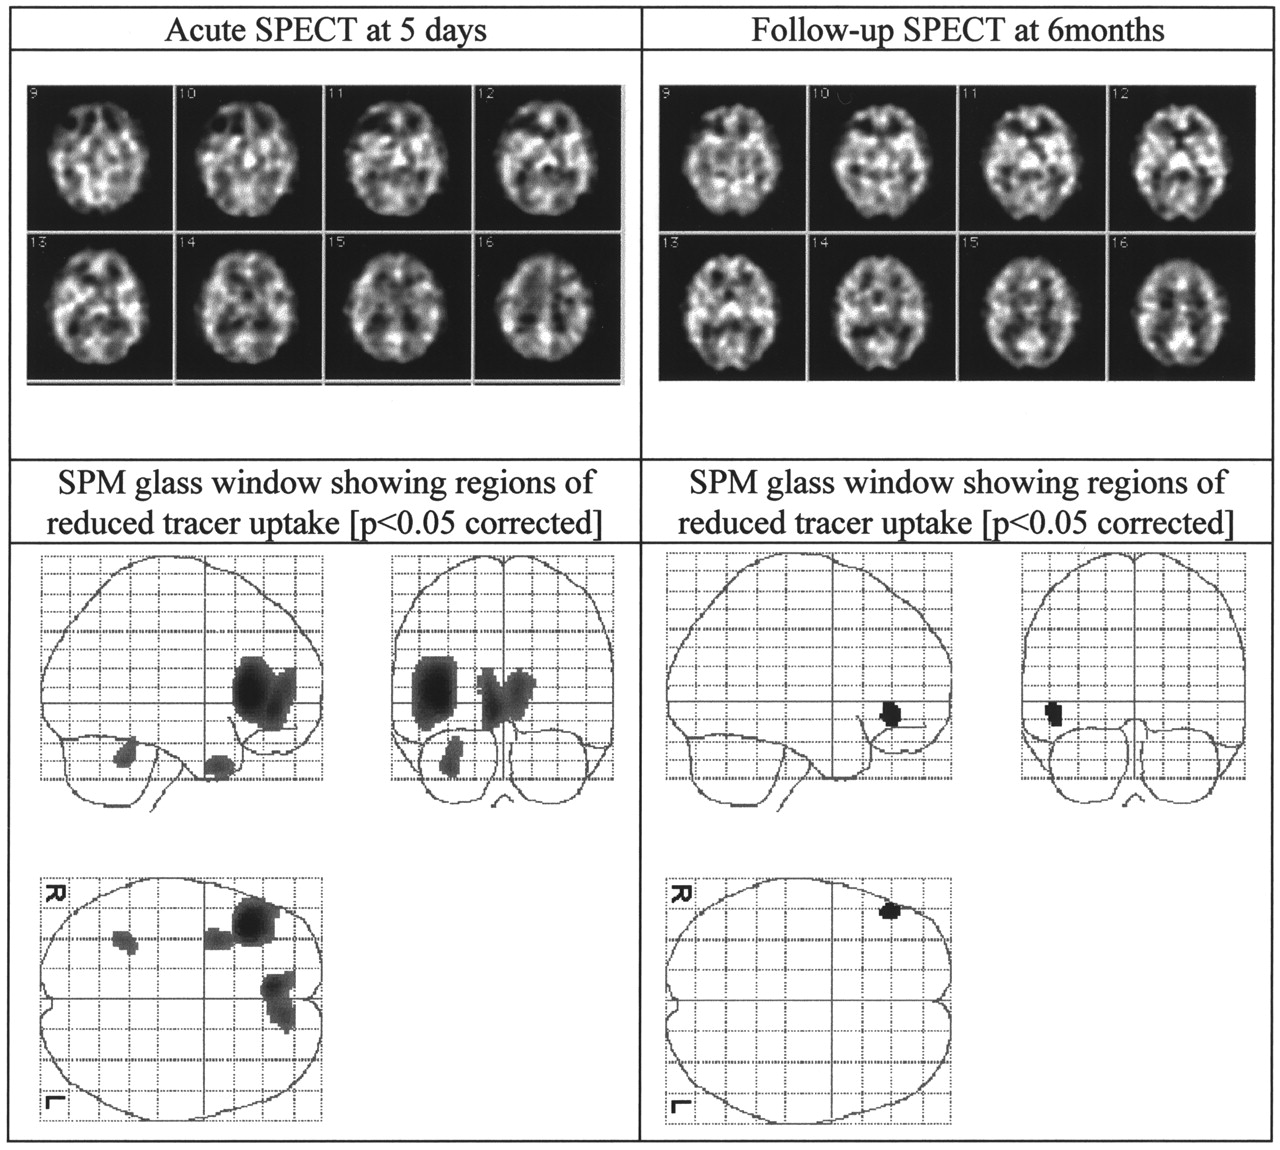
SPECT (midsections) and SPECT SPM images of 33-y-old man after sports injury. He had GCS rating of 15 on admission. Patient was from focal injury group.
Mean Lesion Volumes in Patients with Focal, Diffuse, and All Types of Injury at Acute and Follow-Up Stages and Percentage of Total Lesion Changes from Acute to Follow-Up
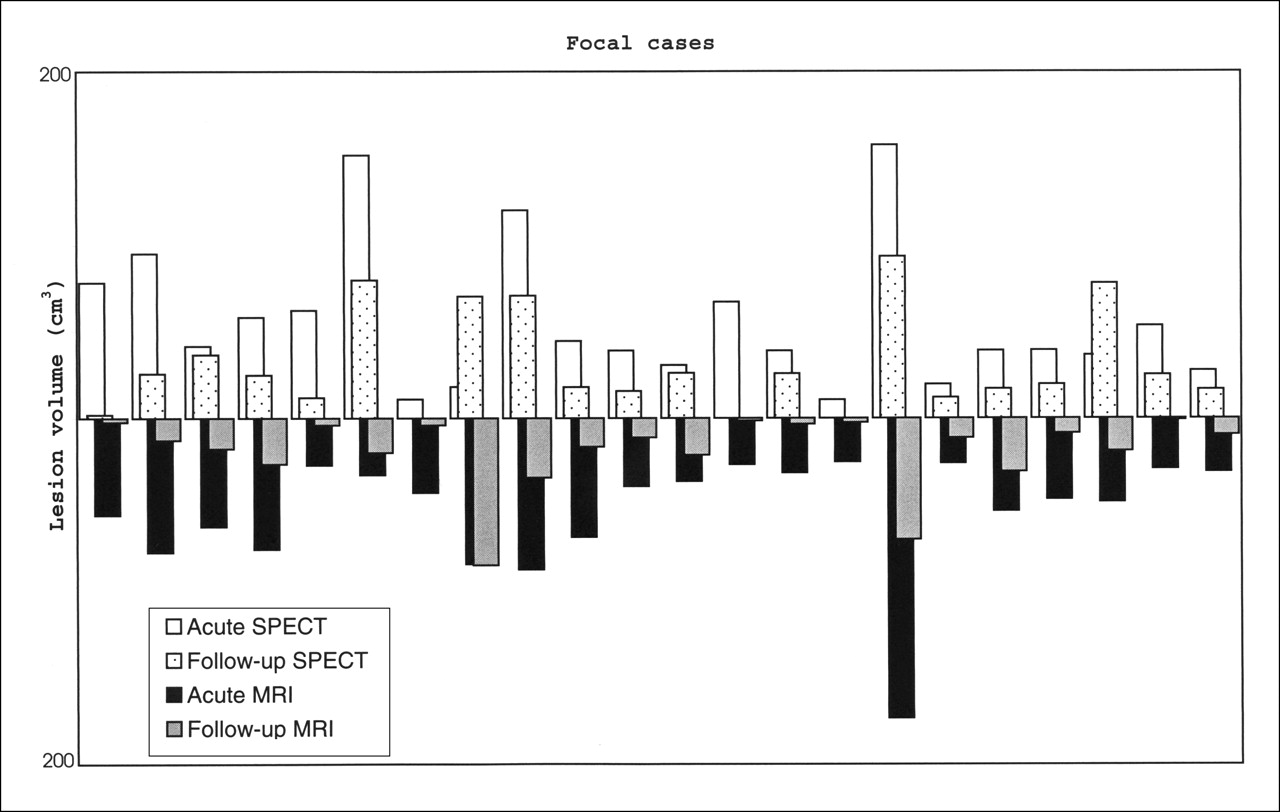
MRI and SPECT detected more extensive abnormality in focal cases than in diffuse cases. SPECT indicated that focal and diffuse injuries do not resolve as entirely as suggested by MRI (54% vs. 35% and 60% vs. 13%) (Table 1). There is considerable variation in the extent to which abnormalities resolve in individual patients (Figs. 2 and 3). At follow-up, MRI showed little or no abnormality in diffuse cases (mean lesion volume, 0.76 cm3) but SPECT yielded a mean total lesion volume of 7.59 cm3 (Table 1).

Total lesion volume (cm3) detected for each of 22 patients with focal injuries.

Total lesion volume (cm3) detected for each of 22 patients with diffuse injuries.
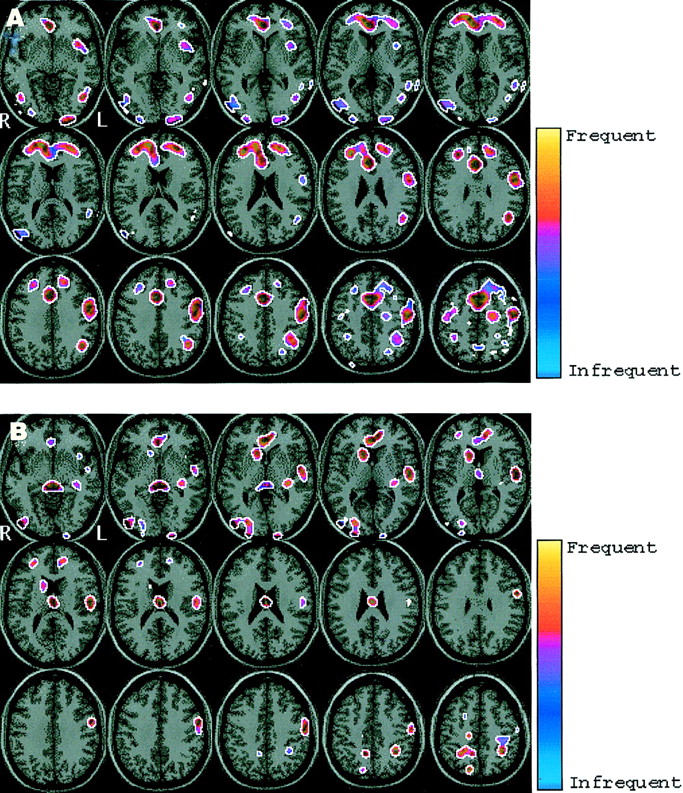
To visualize the number and location of blood flow abnormalities, composite displays were generated for the following groups: focal acute and focal follow-up (Fig. 4) and diffuse acute and diffuse follow-up (Fig. 5). Blood flow deficits identified in each of these groups can be found in Tables 2 and 3. The color scale used in Figures 4 and 5 is in the hot-cold convention. Yellow and red represent higher-frequency blood flow deficits and blue represents lower-frequency blood flow deficits (appeared once or twice in this area over the entire group). These figures show the smoothed aggregate images for the groups. Because image smoothing was also used as a necessary processing step before statistical analysis in SPM, the lesion aggregates appear to contain midline lesions, which is not the case in the actual dataset.

Frequency distribution of blood flow abnormalities in focal patients (n = 22). (A) Acute. (B) Follow-up. Yellow areas signify more frequent blood flow abnormalities and blue areas signify less frequent abnormalities.
Frequency distribution of blood flow abnormalities in diffuse patients (n = 22). (A) Acute. (B) Follow-up. Yellow areas signify more frequent blood flow abnormalities and blue areas signify less frequent abnormalities.
Regions of Decreased Blood Flow Identified in Focal Injury Group
Regions of Decreased Blood Flow Identified in Diffuse Injury Group
DISCUSSION
The SPECT lesion simulation work (22) indicates that the threshold used in this study will tend to underestimate the actual size of abnormalities. However, using a lower threshold would result in an increase in false-positives. The use of a lower threshold would be justified in an analysis confined to abnormalities that correspond to structural lesions on CT or MRI. In such circumstances, a specific localizing hypothesis would permit the use of a less conservative threshold. On the other hand, for an analysis in which regions are not prespecified, a more conservative approach is appropriate.
In this study we were able to analyze SPECT images on a voxel-by-voxel basis and, hence, assess lesion burden on the basis of the total number of abnormal voxels and the extent of abnormality within these voxels. This should be more robust than the lesion counting method (which we (29) and others adopted previously) that can be influenced to a large extent by the cutoff level used to determine a lesion. A single lesion can divide into 2 or more lesions as the threshold rises.
The volume of functional defects as detected by SPECT was consistently larger than the volume of structural defects detected by MRI; this was particularly evident on follow-up scanning and was clearest in diffuse cases at follow-up (Table 1). MRI is more sensitive than CT but does not show all abnormalities present after head injury (1). Therefore, normal tissue on MRI does not guarantee normal blood flow. SPECT assists in defining the range of abnormalities in the brain after injury. SPECT is readily available and allows comparison of structure and function in patients. Problems such as operator subjectivity and low reproducibility usually associated with manual or semiautomated SPECT scan analysis were alleviated by SPM, which has an important role to play in head injury studies and, more generally, in SPECT lesion studies.
The criticism of ROI analysis in SPECT (or PET) does not apply to the same extent to MRI because the high resolution and tissue contrast remove much of the doubt in determining lesion borders. In practice, the limiting factor with MRI is the partial-volume artifact and this affects all methods of volume estimation.
SPM allowed identification of abnormalities on an individual case-by-case basis, as well as group comparisons for different categories of head injury, and facilitated visualization of the spatial distribution of abnormalities in focal and diffuse head injury. Group studies of regional cerebral blood flow in head injury are helpful for assessing the usefulness of classifying head injury and for identifying group trends. SPM allowed group comparisons of regional cerebral blood flow that were performed in a quick objective way without any operator intervention by combining results from individual patients. In some instances, the analysis indicates that the regions that are consistently affected are quite small. Such areas would be missed by an ROI analysis that included large volumes.
Group comparison in focal injury indicated the involvement of frontal and temporal lobes and the anterior cingulate. The same blood flow abnormalities persist (to a lesser extent) on follow-up scans (Table 2). Decreases in frontal flow have been reported by Abdel-Dayem et al. (9) and Roper et al. (11). Wiedmann et al. (30) reported abnormalities in the orbitofrontal and frontal areas in similar group comparisons.
Diffuse brain injury may arise in several ways with diffuse axonal injury (DAI) being one of the distinctive and characteristic lesions after traumatic injury (31). Acute MRI is often able to detect small focal lesions in the brain stem, in the corpus callosum, and at the gray matter-white matter interfaces that are associated with diffuse damage (32,33). Such signs are indirect and, therefore, do not indicate the precise spatial extent of the injury. These lesions may resolve quickly after injury and become undetectable. Diffuse axonal damage can also occur without any macroscopic focal lesions (31). In comparison to MRI, SPECT appears to provide additional information that is useful in assessing dysfunction in diffuse head injury. Our findings are in agreement with research by Prayer et al. (34), who studied 18 patients with severe closed head injury who had normal findings on CT examination. On MRI, they found patterns of lesion typical of DAI in half of the patients. On SPECT, patients with DAI had low blood flow over large areas of the cortex (primarily frontal, temporal, and parietal lobes) and in the thalamus. Ichise et al. (12) detected SPECT abnormalities in frontal and temporal regions in diffuse injury. Our group comparisons suggest low blood flow in the frontal and temporal lobes (including cingulate involvement) that persists at follow-up. Additional involvement of the thalamus at follow-up may reflect transneuronal degeneration consequent to cortical injury (35).
Our results support the view that frontal lobe abnormality is of particular importance in focal and diffuse head injury. Abnormalities were consistently found in the frontal lobes, particularly the anterofrontal regions and the mesiofrontal areas. Frontal lobe abnormalities have been commonly reported on CT and MRI, and most frontal lesions using these modalities are found in lateral frontal and orbitofrontal regions. We found that mesiofrontal abnormalities were common, including abnormality in the anterior cingulate cortex. The involvement of the anterior cingulate is interesting because it is believed to form a central part of an executive/attentional system and to play a key role in cognition (36–38). In a recent PET study using small ROIs, hypometabolism in the anterior cingulate was found to relate to neuropsychologic performance after head injury (39). Our study shows that blood flow abnormality is common in the anterior cingulate and thus lends support to the idea that this may be one of the critical regions underlying cognitive deficits in head injury. A potential strength of SPM is that it also can allow systematic investigation of the correlation between SPECT abnormalities and neuropsychologic test performance or other clinical data. Thus, SPM opens the way for further study of such relationships.
CONCLUSION
A key purpose of this study was to illustrate a method of defining SPECT abnormalities that is more objective than visual inspection. SPM allows better visualization than other methods of quantitative analysis of the spatial distribution of abnormalities in focal and diffuse head injury. The results show that frontal lobe blood flow abnormality (particularly, anterofrontal regions and mesiofrontal areas) is common in both types of injury. The technique allows identification and definition of abnormalities in individual cases, and this makes it potentially of value to the clinician. In the current state of knowledge of relationships between brain injury and cognitive impairment in head injury, caution must be exercised in the interpretation of the results of imaging from individual cases.
Acknowledgments
This work was supported by a grant from the Chief Scientist Office, Scotland. The Wellcome Trust supported the collection of data.
Footnotes
Received Aug. 6, 2001; revision accepted Dec. 20, 2001.
For correspondence or reprints contact: Emmanuel A. Stamatakis, PhD, Department of Experimental Psychology, Center for Speech and Language, University of Cambridge, Cambridge CB2 3BE, United Kingdom.
E-mail: emmanuel{at}csl.psychol.cam.ac.uk
REFERENCES
In this issue


Jump to section
Related Articles
Cited By...
- Traumatic Brain Injury Imaging Research Roadmap
- Imaging Evidence and Recommendations for Traumatic Brain Injury: Advanced Neuro- and Neurovascular Imaging Techniques
- Cognitive Impairment in Mild Traumatic Brain Injury: A Longitudinal Diffusional Kurtosis and Perfusion Imaging Study
- Relationship between regional cerebral metabolism and consciousness disturbance in traumatic diffuse brain injury without large focal lesions: an FDG-PET study with statistical parametric mapping analysis
- Evaluation of Methods to Detect Interhemispheric Asymmetry on Cerebral Perfusion SPECT: Application to Epilepsy