


Abstract
We developed a noninvasive method for the mapping of regional renal blood flow in humans using PET and H215O. Methods: Fifteen subjects participated in the study, 5 with normal renal function and 10 with renal disease. The protocol used a whole-body PET scanner, intravenous bolus injection of 1,110–1,850 MBq H215O and sequential imaging at 3 s per frame. 131I-Iodohippuran was used to independently assess effective renal plasma flow in each subject. Hippuran clearance and renal blood flow (RBF) were measured twice, before and after treatment with probenecid, to verify that RBF is not affected. Flow analysis was based on the Kety model, according to the operational equation: C(t) = F ∫ Ca(u)du − k ∫ C(u)du, where F is the RBF, k is the tissue-to-blood clearance rate, C is the PET concentration, and Ca is the tracer concentration in the abdominal aorta. F and k were estimated by linear least squares on a pixel-by-pixel basis to produce quantitative maps (parametric images) of RBF. The flow maps were analyzed by regions of interest (largely excluding the medulla and collecting system) for each kidney on each slice and pooled to yield mean RBF. Results: In the 5 healthy subjects, mean RBF was 3.4 ± 0.4 mL/min/g. There was no difference in flow between kidneys (t = −0.59; n = 11; P > 0.95). Before treatment with probenecid, RBF was linearly related to hippuran clearance (r2 = 0.92). Probenecid treatment significantly reduced hippuran clearance (P < 0.003), but RBF was unchanged (P > 0.17). Compared with healthy control subjects, RBF was significantly decreased in patients with renal disease (P < 0.002). Flow maps were of good quality in all subjects, exhibiting characteristic patterns, with higher values in regions composed largely of renal cortex. Conclusion: Parametric mapping of RBF with PET and H215O provides a straightforward, noninvasive method for quantitative mapping of RBF, which may prove useful in research applications and in the management of patients whose therapy alters renal tubular transport.
A variety of clinical disorders, including renovascular hypertension and renal failure and drug treatment (e.g., captopril), are known to reduce total renal blood flow (RBF). Less is known about the mechanisms by which events, such as trauma, alter local RBF. Currently, a completely satisfactory method for measuring RBF does not exist. Methods based on the clearance of filtered tracers have been used to compute indices of total RBF but provide neither lateralizing information nor estimates of local RBF. Several methods to measure local RBF in animals have been described but are highly invasive and thus unsuitable for human investigation (1–5).
PET offers the potential for a quantitative, low-risk, and minimally invasive assessment of local RBF. Several reports have described methods for measurement of RBF with PET. One line of investigation uses 13N-ammonia as a flow tracer. Chen et al. (6) validated a method for measurement of local RBF in dogs using 13N-ammonia and PET. This was followed by reports from the same group, extending the technique to swine (7) and healthy human subjects with parametric imaging (8). Previous work in our laboratory (9,10) showed a good agreement between PET measurements of local RBF in dogs by continuous infusion of 82Rb and flows determined with radiolabeled microspheres. Nevertheless, extending this method to human investigation was not pursued because of technical problems inherent to the continuous infusion of a generator-produced radionuclide and the fact that rubidium is not an inert tracer. Another approach to the measurement of RBF uses H215O as the flow tracer. Inaba et al. (11) used a 1-compartment model to measure RBF in human kidney. Nitzsche et al. (8), as part of their work on RBF with 13NH3, also compared the RBF results with measurements using 13NH3. More recently, Juillard et al. (12) compared RBF measured with microspheres and H215O in a porcine model.
The use of H215O is appealing for several reasons: (a) It has a short physical half-life of 123 s, making repeated measurements after pharmacologic intervention possible every 10 min. (b) H215O is an inert tracer that is highly diffusible and consistent with the inherent function of the kidney. (c) Because tritiated water has been used to measuring RBF in animals (13), the validity of a method using H215O depends primarily on the limitations imposed by PET, which are well understood. (d) Mapping of local blood flow with H215O and PET has been validated in other organs.
The purpose of this study was to show the feasibility of quantitative mapping of local RBF with PET and H215O in healthy subjects and those with moderate to severe renal disease. We used an experimental design aimed at providing indirect support for the validity of our RBF measurements. Measurements were performed twice: initially in a basal state, and after 1 wk of treatment with probenecid. RBF measurements were compared with hippuran clearance rates. Two hypotheses were tested: RBF in untreated subjects is linearly related to hippuran clearance, and probenecid treatment reduces hippuran clearance without affecting RBF.
MATERIALS AND METHODS
Human Subjects
Subjects were recruited for this study on the basis of creatinine clearance, predicted from serum creatinine concentration and body weight. Only individuals who were likely to have stable renal function for 1 mo were studied. Table 1 summarizes relevant information about the study cohort. Fifteen subjects were enrolled. Four subjects had kidney transplants and bilateral nephrectomies, all of long duration. The exclusion criteria were evidence of renal inflammatory disease based on clinical evaluation or urinalysis, 24-h urine protein of >1 g, history of gout or renal stones, or history of a hypersensitivity reaction to probenecid.
Basic Information Characterizing Study Cohorts
Study Protocol
On entrance into the study, each subject had a complete medical history, physical examination, urinalysis, complete blood count, platelet count, aspartate aminotransferase (serum glutamic-oxaloacetic transaminase), alkaline phosphatase, and a 24-h urine collection for protein, uric acid, and creatinine clearance. Twenty-four hours later, measurements of effective renal plasma flow (ERPF) (131I-iodohippuran) and RBF (H215O) were performed as described below.
On completion of the imaging and clearance studies, the subjects were treated with probenecid (500 mg twice a day) for 7 d. On the seventh day, while the subjects were still taking the drug, the laboratory tests and radionuclide procedures were repeated.
The human studies protocol was approved by the Massachusetts General Hospital’s committees on human studies, pharmacy, and radioisotopes. All subjects provided informed consent before their participation in the study.
PET Imaging
PET scanning was performed with a GE-4096 whole-body positron tomograph (General Electric Medical Systems, Milwaukee, WI), a device that acquires data in 15 contiguous slices over an axial field of 97 mm. This instrument has been well characterized and described by Kops et al. (14). Data were reconstructed as images of radioactivity concentration using a conventional filtered backprojection algorithm, with the in-plane spatial resolution set to 8-mm full width at half maximum (FWHM). Axial resolution is fixed by the scanner slice geometry at 6.0-mm FWHM. Transmission data, acquired with an orbiting rod source of 68Ge, was used to correct the coincidence data for photon absorption. Additional corrections were applied to account for random coincidences, scattered radiation, and dead-time losses (15).
The tracer used in this study was H215O, administered intravenously as a bolus. Because of the limited axial field of the camera, both kidneys could not be fully imaged in a single run; thus, the scan bed was indexed 84 mm between runs. Accordingly, each subject was studied twice per scan session, with bolus injections consisting of 1,110–1,850 MBq H215O dissolved in <1 mL of saline. The time between injections was 10–15 min. The PET scanner recorded 30 frames, each of 3-s duration, beginning just before injection.
Measurement of RBF
Assuming clearance of tracer in the urine to be negligible, flow analysis was based on the Kety model (6), according to the operational equation:
 Eq. 1 where F is the RBF, k is the tissue-to-blood clearance rate, C is the PET concentration, and Ca is the arterial tracer concentration.
In these studies the arterial concentration history was measured from the descending aorta. This was accomplished by inspection of the early frames to visually localize the aorta. A 1-cm circular region of interest (ROI) was defined and used to measure the activity concentration averaged over each scanning interval. Doppler sonography was used to measure the aortic diameter, and an analytic correction to the activity concentration was applied to account for systematic activity underestimation (arising from the limited spatial resolution). To develop the correction factor, the aorta was modeled as a long circular cylinder. It was assumed that the true aortic activity could be represented by circular slices with uniform concentration. A correction table was developed by convoluting a 2-dimensional gaussian filter with uniform disks of varying diameter.
The image data were processed slice by slice over time. F and k were estimated by linear least squares on a pixel-by-pixel basis to form quantitative maps of RBF. This was accomplished by importing the PET images into a standard data processing system (MATLAB; The Mathworks, Natick, MA) to perform the integrals indicated in Equation 1. Custom-written subroutines were used to perform the pixel-by-pixel matrix inversion needed to solve the normal equations for linear least squares. Processing 1 run in this manner required about 5 min on a model 4000/90 VAX station (Digital Equipment Corp., Maynard, MA), including all input and output operations.
Blood flow maps were analyzed manually by ROI analysis to estimate mean RBF. The ROIs were drawn on each kidney, on each slice (largely excluding the medulla and collecting system), and pooled to yield mean RBF.
Clearance Measurement of Renal Plasma Flow
Peripheral venous catheters were inserted for administration of radiopharmaceuticals and blood sampling. Thirty minutes after oral administration of 5 mg of potassium iodide, a solution of ∼9,250 kBq 131I-iodohippuran in saline (50 mL) was infused over 4 h using a syringe pump. The subjects were instructed not to void for the first hour. At 60 min after the start of the infusion, 5 mL of blood were drawn and the subjects were instructed to empty their bladder and drink a similar volume of water. This procedure was repeated at 30-min intervals. 131I radioactivity was measured in the blood and urine samples. ERPF was calculated using the relation:
 Eq. 2 where U denotes urine radioactivity, V denotes urine production (mL/min), P denotes serum radioactivity, and BSA denotes body surface area in m2 (based on height and weight).
Statistical Analysis
Results are expressed as mean ± SD. Hypotheses regarding group differences were tested with the Student t test, whereas within-subject comparisons were performed as paired t tests. We considered a probability of observing a difference by chance < 0.05 (P < 0.05) to indicate a statistically significant change.
RESULTS
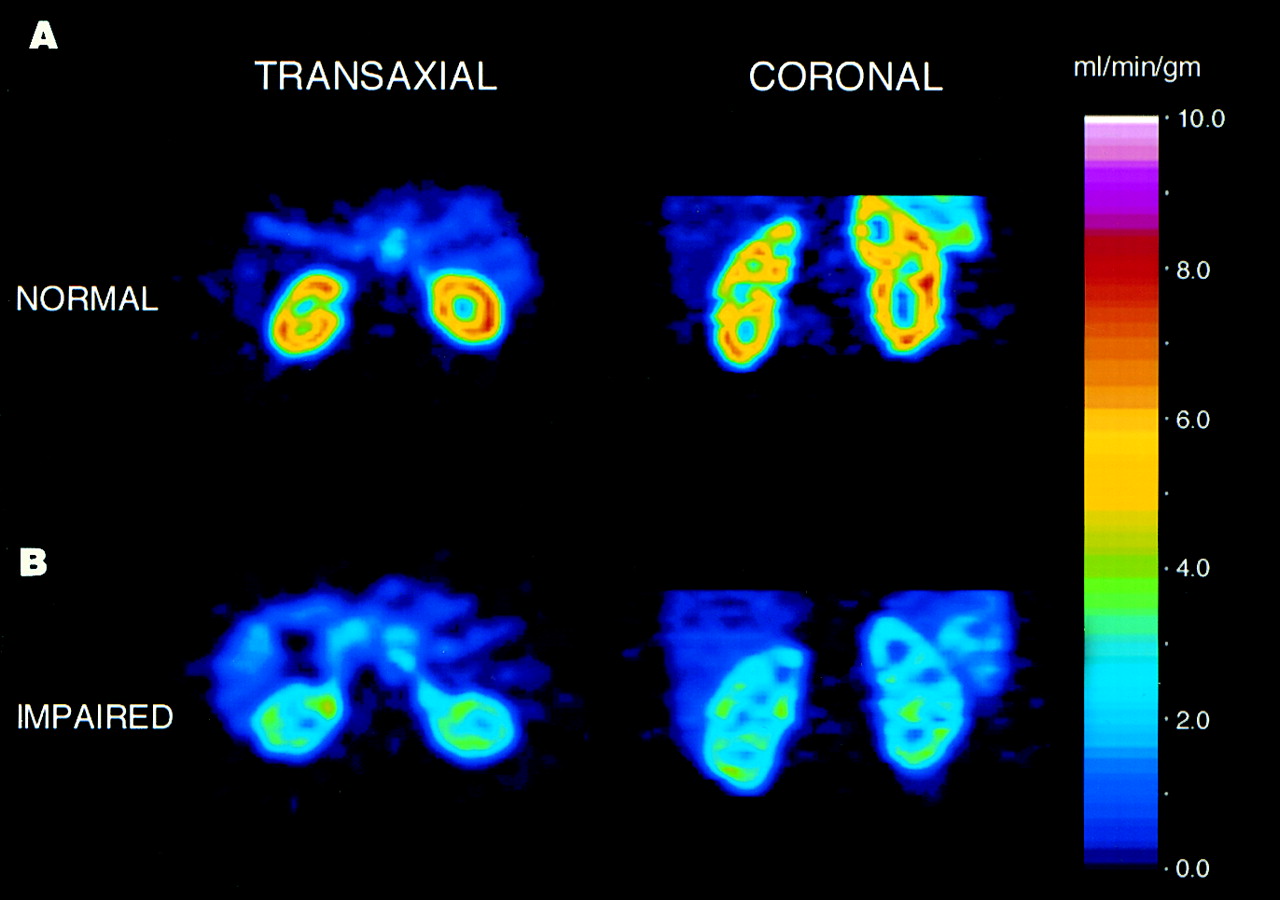
Results of RBF and hippuran measurements are summarized in Table 2. Figure 1 shows representative quantitative RBF maps for a healthy subject (Fig. 1A) and for a patient with severe renal dysfunction (Fig. 1B). The maps all showed a characteristic pattern with highest flow in regions that are composed largely of renal cortex. In the 5 healthy subjects, the distribution of renal cortical blood flow was homogeneous, and the average blood flow was 3.2 ± 0.4 mL/min/g. There was no difference in flow between kidneys (P > 0.95). In contrast, the flow maps for patients with moderate or severe renal dysfunction showed a heterogeneous pattern of cortical flow, and the average flow was significantly reduced: RBF = 2.1 ± 1.1 mL/min/g (P < 0.007; 1-tailed test). RBF was not significantly different in subjects with moderate and severe disease (P = 0.31).

Parametric maps of RBF for healthy subject (A) and for patient with moderate renal disease (B). Left column shows transverse cut through kidneys, whereas right column shows coronal cuts. Color bar provides quantitative scale in units of mL/min/cm3.
Results for Measurement of Hippuran Clearance and RBF
Figure 2 illustrates the relationship between mean RBF determined by PET and hippuran clearance. A linear regression without intercept fits the data well (r2 = 0.78). When the hippuran clearance measurements were repeated after 7 d of treatment with probenecid, ERPF decreased by 35% in healthy subjects (P < 0.003) and by 13% in the patient group (P < 0.04). In contrast, RBF measured in the study group was not significantly reduced by drug treatment (P > 0.17; 1-tailed test). In fact, the data in Figure 3 show good run-to-run reproducibility over the 1-wk interval between measurements.
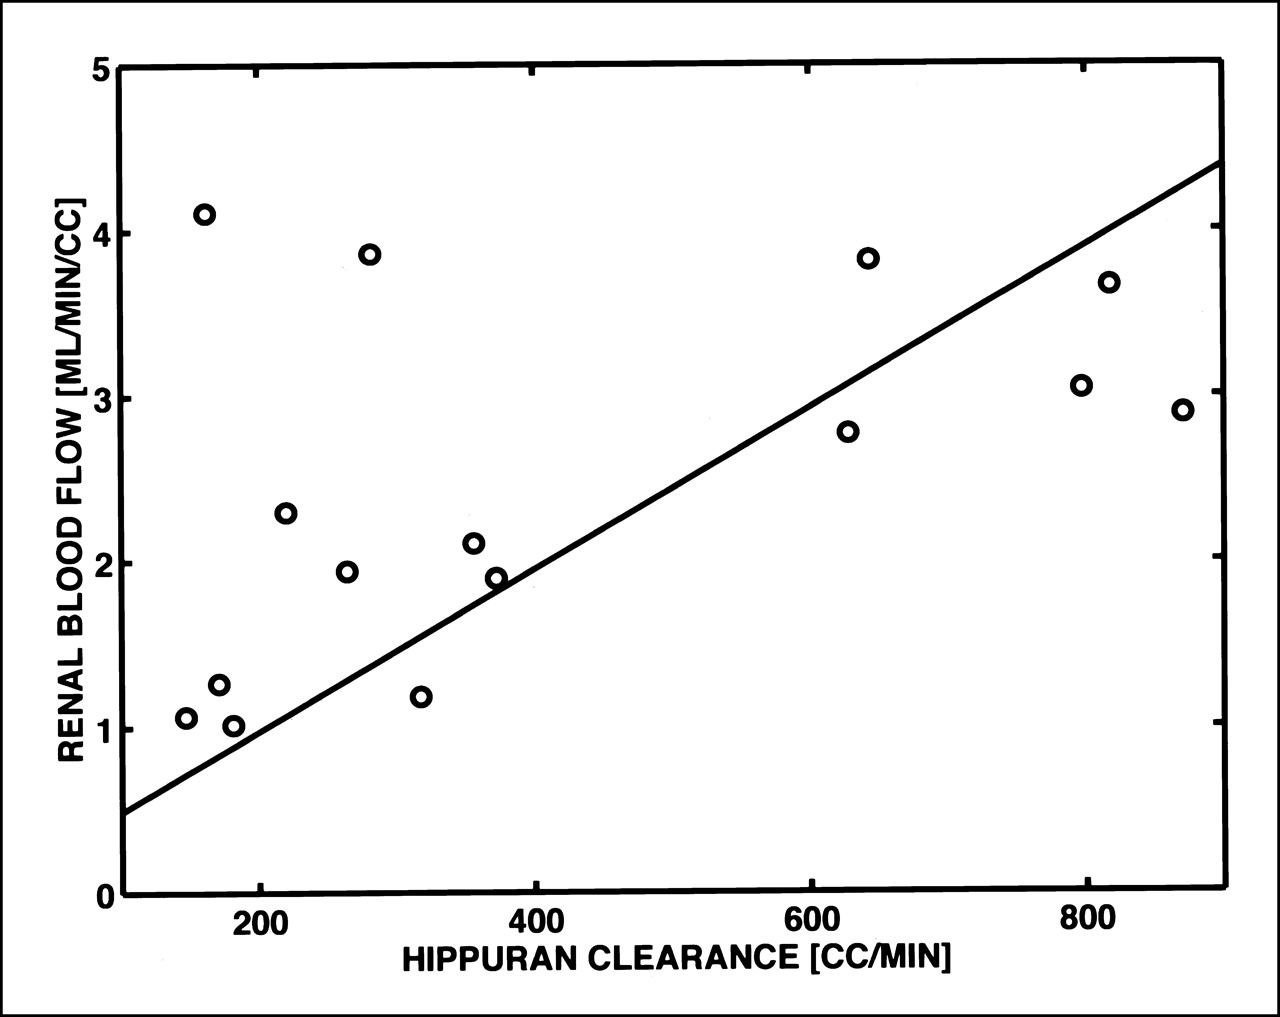
Comparison of hippuran clearance rates (mL/min) and mean RBF (mL/min/cm3) in control state. Solid line is linear regression. RBF = constant · Hippuran clearance rate.
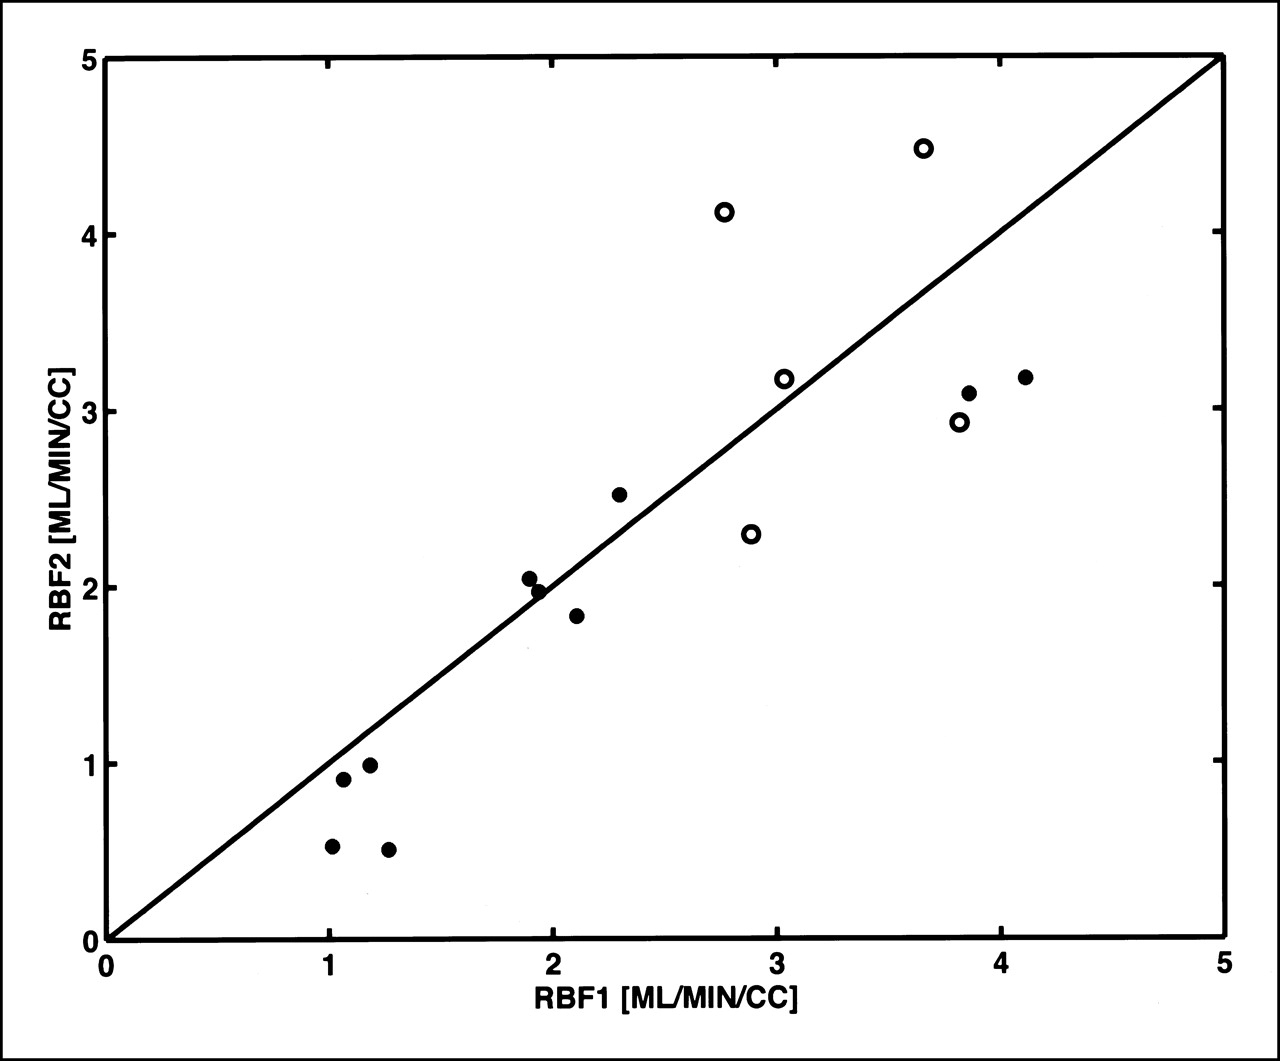
Graph of RBF (mL/min/cm3) for healthy subjects (○) and for patients with renal disease or kidney transplant (•) who were measured before treatment (RBF1) and 7 d after treatment (RBF2) with probenecid.
DISCUSSION
Our study design involves the use of probenecid. Because current methods for measuring RBF use tracers that are secreted by renal tubules (i.e., radioiodinated o-iodohippurate and hippuran and 99mTc-mercaptoacetylglycine) and many therapeutic drugs affect this process, flow measurements can be inaccurate in many clinical situations. Probenecid is a benzoic acid derivative that inhibits renal tubular transport of organic acids. Although its primary clinical application derives from its uricosuric action in the treatment of gout, probenecid also inhibits the tubular transport of a variety of other drugs, including aminohippuric acid, aminosalicylic acid, indomethacin, 17-ketosteroids, pantothenic acid, phenolsulfonphthalein, penicillins, sulfonamides, sulfonylureas, and diagnostic agents such as iodopyracet and related iodinated organic acids. Thus, we measured RBF with H215O before and after treatment with probenecid and compared the results with parallel measurements of ERPF with 131I-iodohippuran. As the data in Table 2 (columns 5 and 6) illustrate, probenecid treatment markedly reduced hippuran clearance in healthy volunteers. However, this effect was much less pronounced in patients with varying degrees of renal failure. Although hippuran clearance was significantly reduced in the patient groups, probenecid treatment produced only a modest further reduction. This finding is probably attributed to the fact that tubular function was dramatically impaired at baseline and probenecid elicited little additional reduction in transport. Alternatively, probenecid-sensitive and probenecid-insensitive transport mechanisms may be present in renal tubules.
A review of the literature revealed that there are discrepancies among the various methods that have been used to measure RBF in animals (13) that cannot be completely explained. Thus a universally accepted, standard method for measurement of RBF has not emerged. One might expect measurement of local RBF with radioactive microspheres to be the definitive technique, as it is in most other tissues (17,18). This has not proven to be true. For example, in animal studies with microspheres, Aukland (19) concluded that the geometry of the renal vasculature and the distribution of microsphere sizes limit accuracy and reproducibility of RBF determinations.
PET with H215O provides a straightforward, noninvasive method for mapping RBF, and this technique may prove useful in the management of patients with renal disease. An earlier study by Inaba et al. (11) using H215O and PET showed that clearance of water from the kidney could be approximated by a single exponential over a period of 1 min after rapid bolus injection. In their study, RBF ranged from 0.9 to 2.9 mL/min/g, with a mean of 1.7 ± 0.6 mL/min/g. Nitzsche et al. (8) measured whole-kidney cortical blood flow from parametric images formed with 13NH3 and from ROI analysis with H215O, finding values of 4.61 and 4.73 mL/min/g, respectively. This study extends the H215O method to allow mapping of local RBF.
We found good reproducibility of RBF over the 1-wk interval between measurements. The correlation of RBF and hippuran clearance (Fig. 1) was reduced somewhat by 2 outliers. Examination of the data showed that both outliers corresponded to patients with bilateral nephrectomy and renal transplants of long duration. Both patients had high RBF before and after treatment with probenecid (Fig. 2), a response more characteristic of healthy subjects. This apparent discrepancy may reflect the effect of the different medications used to treat transplant patients on the clearance of hippuran.
The accuracy of total RBF measurements depends on the properties of the tracer and the Kety model used in blood flow estimation. In the case of water, one might speculate that it is an ideal tracer because of the inherent function of the kidney. Earlier measurements with tritiated water (2) suggest that transcapillary permeability of water is very high and that systematic errors in RBF from transcapillary diffusion are small. Unlike tracers that are cationic, such as 13NH3, this work explicitly showed that measurement of RBF with H215O is not affected by changes in tubular function that are affected by probenecid treatment. The appeal and limitations of the Kety model arise from its basis in compartment modeling. In this study each volume element was modeled as a single compartment and mean RBF was calculated by averaging over the whole kidney, element by element. It should be noted that this is different from assuming the whole kidney can be modeled with a single compartment.
The kinetic model used in this work is the simplest compartment model possible. It does not take account of the complicated vascular and tissue structure of the kidney. It is easy to envision more realistic models, perhaps with more compartments, or using distributed modeling based on an assumed capillary bed geometry. But, the Kety model fits the data well with just 2 parameters, suggesting that with real data (i.e., noisy, with a limited experimental period) it will be very difficult to get reliable parameter estimates with more complex models. Despite its simplicity, applications of the Kety model in other organs have proven to be sufficiently accurate.
The accuracy of local blood flow measurements depends strongly on an additional factor, the 3-dimensional resolution of PET. One expects systematic errors due to finite spatial resolution and partial-volume effects because of the complicated cortical structure of the kidney. These will typically result in underestimation of cortical flow and a blurring of the boundary between cortex and medulla. It is likely that placement of cortical ROIs included an unknown admixture of medullary flow. Such effects may account for differences observed between this study and the study of Nitsche et al. (8) because they used a partial-volume correction and we did not. Although the contrast in the PET flow maps may indicate a relatively sharp cortical boundary, the accuracy of its location should be interpreted cautiously.
CONCLUSION
Despite certain caveats and precautions, application of this technique is appealing. The data we present show good run-to-run reproducibility in human subjects with a spectrum of kidney function. Further support for the parametric mapping technique was established by the linear association found between the hippuran clearance rate and RBF in the control state, the reduced hippuran clearance rates after treatment with probenecid without altering RBF, and the ability to visualize abnormalities in local RBF and to detect changes in RBF in patients with moderate and severe renal disease. We suggest that the H215O parametric mapping technique may find application in the functional assessment of unilateral renal artery stenosis and related conditions. We expect that the technique will be most useful in research applications. With the development of PET cameras adapted for small animal imaging, the method might be useful in rodents. Furthermore, it appears to be ideal for assessing the response of RBF to drug therapies in human subjects. Finally, future applications could exploit the 2-min half-life of 15O to determine the effects of physiologic and pharmacologic manipulations on RBF, both in animals and in human subjects.
Acknowledgments
The authors acknowledge the assistance of Stephen Weise and members of the Cyclotron Laboratory for their work on gathering the PET studies. This work was supported in part by grants from the Shriners Hospitals for Children, the National Institute of General Medical Sciences (P50-GM21700, T32-GM07035), and the National Cancer Institute (T32-CA09362).
Footnotes
Received Apr. 3, 2001; revision accepted Dec. 18, 2001.
For correspondence or reprints contact: Nathaniel M. Alpert, PhD, Division of Nuclear Medicine, Department of Radiology, Massachusetts General Hospital, 32 Fruit St., Boston, MA 02114.
E-mail: alpert{at}pet.mgh.harvard.edu


