


Abstract
In cardiac SPECT, specificity is significantly affected by artifacts due to photon absorption. As the success of attenuation correction depends mainly on high-quality attenuation maps, SPECT low-dose CT devices are promising. We wanted to evaluate the usefulness of a SPECT low-dose CT device in myocardial perfusion scintigraphy. For the evaluation of attenuation correction systems, primarily comparisons with coronary angiography are used. Because the comparison of a method showing myocardial perfusion with an investigation displaying the morphology of vessels yields some difficulties, we chose perfusion PET with 13N-ammonia as the reference method. Methods: We prospectively analyzed 23 patients (6 women, 17 men) with known or suspected coronary artery disease. Rest studies and studies under pharmacologic stress with adenosine were performed. After simultaneous injection of 13N-ammonia and 99mTc-sestamibi, a dynamic PET acquisition was started. The SPECT study was performed about 2 h later. Based on 20-segment polar maps, SPECT with and without attenuation correction was compared with PET-derived perfusion values and ammonia uptake values. The PET uptake images were also smoothed to adjust their resolution to the resolution of the SPECT images. Results: The concordance of SPECT and PET studies was improved after attenuation correction. The main effect was seen in the inferior wall. Especially in the apex and anterolateral wall, there were differences between SPECT and PET studies not attributable to attenuation artifacts. Because these differences diminished after smoothing of the PET studies, they might be due to partial-volume effects caused by the inferior resolution of the SPECT images. Conclusion: The x-ray-derived attenuation correction leads to SPECT images that represent myocardial perfusion more accurately than nonattenuation-corrected SPECT images. The benefit of the method is seen primarily in the inferior wall. The low resolution of the SPECT system may lead to artifacts due to partial-volume effects. This phenomenon must be considered when perfusion PET is used as a reference method to investigate the effect of attenuation correction.
In cardiac SPECT, specificity is significantly affected by artifacts due to photon absorption (1). Breast, diaphragmatic, and thoracic wall attenuation result in marked regional variations in myocardial activity that are not related to myocardial perfusion. For attenuation correction in areas of inhomogeneous attenuation such as the chest, individual determination of an attenuation map is needed, usually achieved by transmission scanning (2). Several solutions for attenuation correction are currently available, many of them based on transmission scanning with external radioactive sources (3). The success of attenuation correction depends mainly on high-quality attenuation maps (4). With the development of combined SPECT low-dose CT devices, high-count and high-resolution transmission maps can be generated in a short time.
For the clinical evaluation of attenuation correction solutions, myocardial perfusion scans are usually compared with the results of coronary angiography (5–7). There are some problems with this approach, raising the question of whether coronary angiography is the best reference method available. First, coronary angiography does not show myocardial perfusion but, rather, the morphology of coronary blood vessels. This does not include information on the possible malfunction of endothelial cells, leading to perfusion defects (8). The presence of endothelial dysfunction may therefore reduce the specificity of SPECT as compared with coronary angiography. On the other hand, myocardial perfusion might be preserved even in supply areas of coronary vessels with major stenosis if collateral blood flow is present. In this case, SPECT will appear to have a reduced sensitivity. Furthermore, due to the variability of the supply areas of coronary vessels and due to the possible stenosis of secondary coronary branches, perfusion defects are sometimes assigned to the wrong coronary artery (9).
In myocardial perfusion imaging using PET, the measurement of patient-specific attenuation sinograms using transmission sources offers a satisfactory solution for attenuation correction. Furthermore myocardial perfusion PET has demonstrated excellent sensitivity and specificity for the identification of coronary heart disease (10–12). Therefore, we chose quantitative myocardial perfusion PET using 13N-ammonia as the reference method to evaluate the efficacy of x-ray-derived attenuation correction in the Millennium VG3 γ-camera with the Hawkeye device (General Electrics Medical Systems).
MATERIALS AND METHODS
Study Population
We prospectively analyzed 23 patients (6 females, 17 males) with known or suspected coronary artery disease. All patients had diabetes. The mean age ± SD was 58 ± 11 y. The mean body mass index ± SD was 28.5 ± 4.2 kg/m2; almost all patients were obese. All subjects signed an informed consent form before participation in the study. The study was approved by the local ethics committee and the Federal Office for Radiation Protection.
Patient Investigations
On day 1, a quantitative PET perfusion study at rest was performed. Patients were placed in the supine position with arms up on the patient tray of an ECAT EXACT HR+ PET scanner (CTI/Siemens Medical Systems). After simultaneous injection of the PET perfusion tracer (370–600 MBq 13N-ammonia) and 370–500 MBq 99mTc-methoxyisobutylisonitrile (99mTc-MIBI) (Cardiolite; Bristol-Myers Squibb Pharma), a dynamic PET acquisition was started. After the PET acquisition, an interval of at least 2 h was allowed for the decay of the PET tracer. Then a SPECT acquisition was performed at the Millennium VG3 γ-camera with the Hawkeye device (General Electric Medical Systems). On day 2, pharmacologic stress with adenosine (Adenoscan; Sanofi-Synthelabo GmbH) (0.14 mg/kg body weight/min) was performed. After 2 min of infusion, simultaneous tracer injections took place and the PET scan was started. The adenosine infusion was continued for an additional 4 min. Further proceedings did not differ from that on day 1.
PET Data Acquisition and Processing
Segmented attenuation correction was performed on the basis of a 5-min transmission scan (68Ge/68Ga rod source) done before tracer application. PET scans were acquired dynamically (12 × 10 s, 5 × 30 s, 2 × 120 s, 1 × 450 s) after bolus injection of 13N-ammonia. Transaxial images were reconstructed iteratively using 4 iterations with 8 subsets of the ordered-subset expectation maximization algorithm (OSEM). Dynamic area-conserving polar maps were generated using the software created by van den Hoff et al. (13). The program was written in MATLAB (release 13, The MathWorks). Quantification of the ammonia studies was based on the irreversible 2-tissue-compartment model described by Hutchins et al. (14). An averaged metabolite correction of the input function was performed based on the results presented by Rosenspire et al. (15). Additionally, frames 15–20 of the dynamic studies were added up to create static uptake images. These were exported to an Odyssey LX workstation (Philips Medical Systems) for further analysis with the 4D-MSPECT software (University of Michigan Medical Center). Polar maps were created as described and normalized to 100% peak activity (16). Then the average pixel value of each segment of a 20-segment model (17) was calculated.
Furthermore, the static uptake images were smoothed by convolution with a 3-dimensional gaussian kernel (full width at half maximum, 21 mm; kernel size, 19 × 19 × 19 pixels) to match the resolution of the SPECT images. The resolution of PET and SPECT has been determined from scans of line sources, which have been reconstructed using the same parameters as in patient studies. The smoothed PET uptake images were transformed to area-conserving polar maps (MATLAB).
SPECT Data Acquisition and Processing
Patients were placed in the supine position with arms up because arms placed at the sides of the body frequently extend beyond the transaxial field of view of the CT scan and have been observed to reduce the image quality (18). Randomly, either emission or transmission scanning was done first. The detector heads were positioned opposing each other (H-mode) and were equipped with low-energy, high-resolution collimators (VP 45). Automatic body contouring was used to obtain the optimum detector-to-patient distance. Emission data were acquired with a 20% energy window centered at 140 keV. Further acquisition parameters were 3° per step, 180° each head, and 25 s per projection. For the rest studies, a gated SPECT acquisition was performed. CT slices were acquired only for the region of the heart—not for the whole axial field of view of the γ-camera—to reduce radiation exposure to the patients. The Hawkeye device has a fixed slice thickness of 10 mm. Other fixed parameters are 140-kV voltage, 2.5-mA current, and 14-s half-scan. CT images are reconstructed on the VG3 system (acquisition software versions 5.1 and 6.0) with direct fanbeam filtered backprojection. The pixel-by-pixel attenuation coefficient is calculated by scaling the CT numbers measured with a known effective x-ray energy. The attenuation map is smoothed by convolution with a 3-dimensional gaussian kernel to equate its resolution with the emission images (19). For SPECT image reconstruction, all data were transferred to an eNTEGRA workstation (General Electric Medical Systems). Transaxial images of 64 × 64 pixels were reconstructed using 2 iterations with 10 subsets of OSEM. Data were filtered with a Butterworth filter (critical frequency, 0.25; power, 5.0). Reconstructed transaxial slices with and without attenuation correction were exported, and area-conserving polar maps were calculated with the same software as used for the PET studies (MATLAB). In addition, the studies were transferred to an Odyssey LX workstation and further analyzed using 4D-MSPECT. For gated SPECT analysis, the Emory Cardiac Toolbox was used (20).
Statistical Analysis
For all further analyses, each PET and SPECT polar map was scaled to its own maximum. Therefore, the numbers given in the tables are mean percentages within a myocardial segment relative to the segment with maximum flow (PET) or uptake (SPECT). Within 1 analysis, PET and SPECT polar maps were generated using the same software to prevent systematic errors caused by different algorithms. Mean and SD were calculated for each myocardial segment over the population. No sex-specific analysis was done due to the small number of patients. A 2-sided paired t test was performed to compare PET and SPECT studies. P < 0.05 was considered statistically significant. In addition, PET perfusion and uptake values and SPECT uptake values were tested for linear regression. Statistical analysis was performed using StatView 5.0 (SAS Institute Inc.).
RESULTS
Gated SPECT Analysis of Rest Studies
A gated SPECT analysis of the rest study was performed in all but 1 patient. The results are given in Table 1. In 1 patient, gated SPECT could not be acquired due to technical problems with the trigger unit. In 2 patients, a reduced left ventricular ejection fraction was observed. Using an end-diastolic volume upper limit of 119 mL for men and of 91 mL for women (21), cardiomegaly was observed in 7 men and 1 woman.
Rest Studies: Results of Gated SPECT Analysis
PET Perfusion Values Compared with SPECT
The results for the dynamic PET studies under rest and stress conditions are listed in Tables 2 and 3 and depicted in Figure 1. For comparison, the results of the SPECT studies without (NC) and with attenuation correction (AC) are given. Under rest as well as under stress conditions, the maximum mean flow in the PET studies is located in the mid inferior segment. Overall, the flow distribution within the myocardium in the PET studies appears relatively homogeneous compared with the uptake distribution in the SPECT studies. The NC studies are characterized by relatively low mean uptake values in the inferior, inferoseptal, and inferolateral wall. The maximum uptake is located in the anterolateral wall. On the other hand, the AC studies do not show a minimum of regional uptake in the inferior wall. The activity distribution appears to be more homogeneous than that in the NC studies.

Polar maps display mean perfusion (PET) and mean uptake (SPECT) of 23 normalized patient studies. Top row, rest studies. Bottom row, stress studies. (A) Mean perfusion per segment, PET. (B) Mean uptake per segment, SPECT without attenuation correction (NC). (C) Mean uptake per segment, SPECT with attenuation correction (AC).
Rest Studies: Comparison of SPECT 99mTc-MIBI Uptake with 13N-Ammonia PET Perfusion (n = 23)
Stress Studies: Comparison of SPECT 99mTc-MIBI Uptake with 13N-Ammonia PET Perfusion (n = 23)
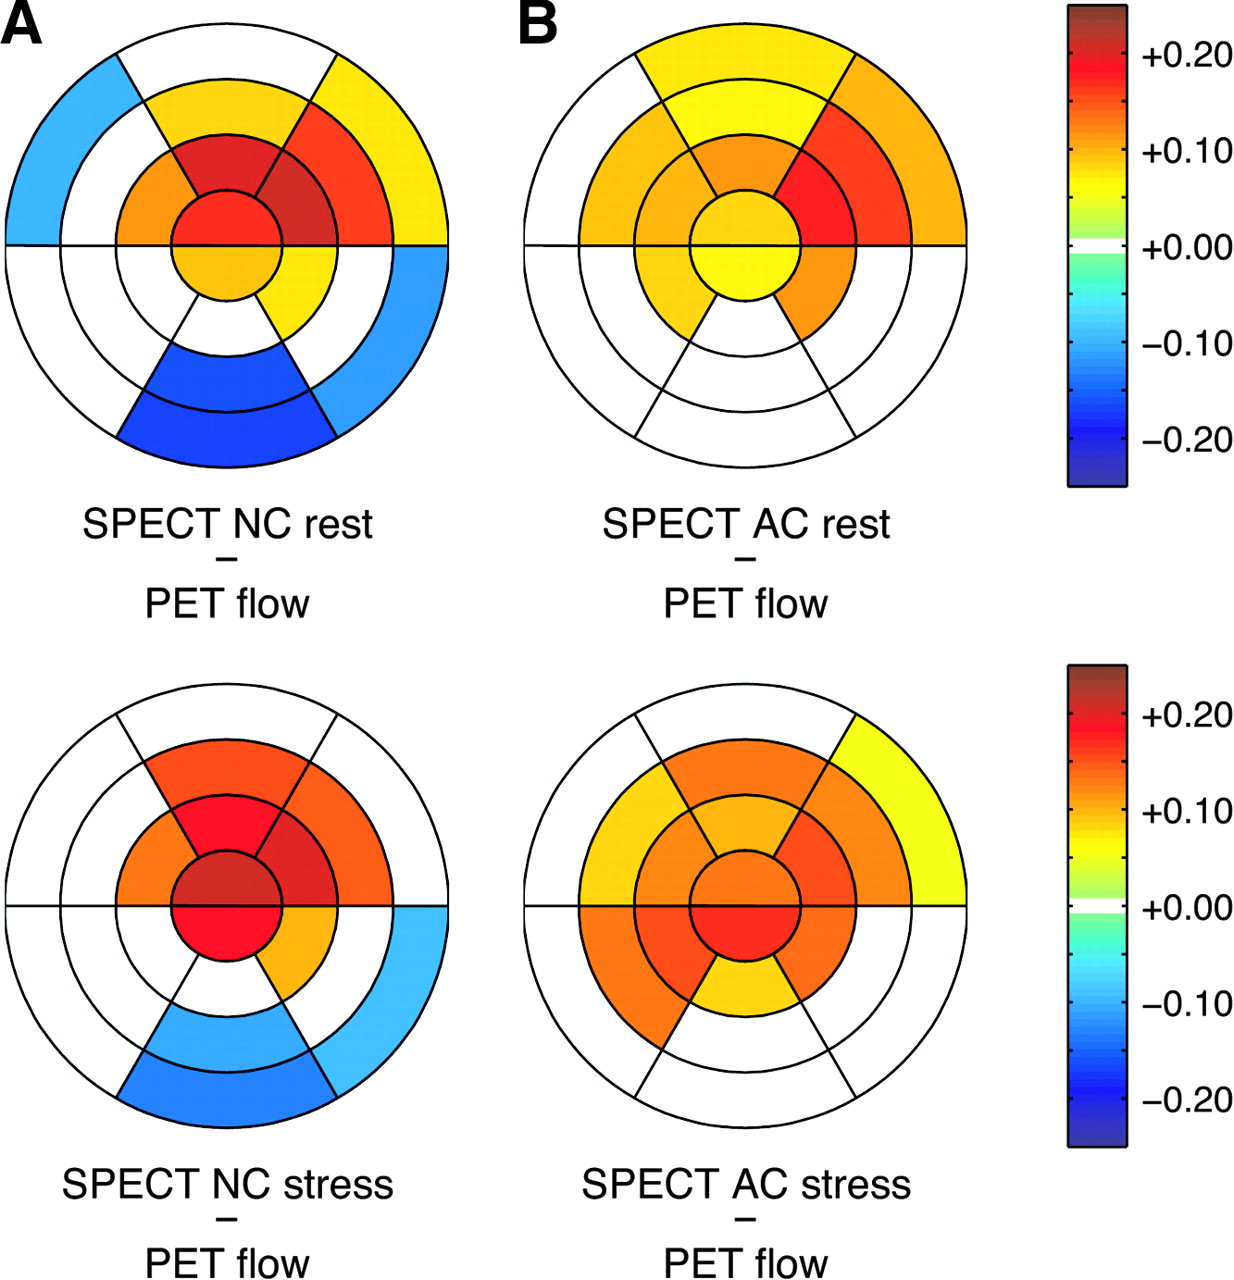
The comparison of PET and SPECT studies is shown in Figure 2. In the NC studies, the regional perfusion is underestimated in the mid and basal inferior as well as the basal inferolateral segment. On the other hand, perfusion is overestimated in the apex as well as the apical and mid anterior and the apical and mid anterolateral segments. For the AC studies, the perfusion in the inferior and basal inferolateral wall is no longer underestimated. The overestimation of perfusion in the apex, the anterior, and the anterolateral wall is still detectable. Compared with the NC studies, the overestimation is less pronounced in the apex and the apical anterior and the anterolateral wall but affects more segments.

Comparison of SPECT uptake, without (NC) and with attenuation correction (AC), with PET perfusion. Top row, rest studies. Bottom row, stress studies. (A) Mean differences between NC SPECT and PET perfusion. (B) Mean differences between AC SPECT and PET perfusion. 0 = no significant difference between regional SPECT uptake and regional PET perfusion.
PET Uptake Values Compared with SPECT
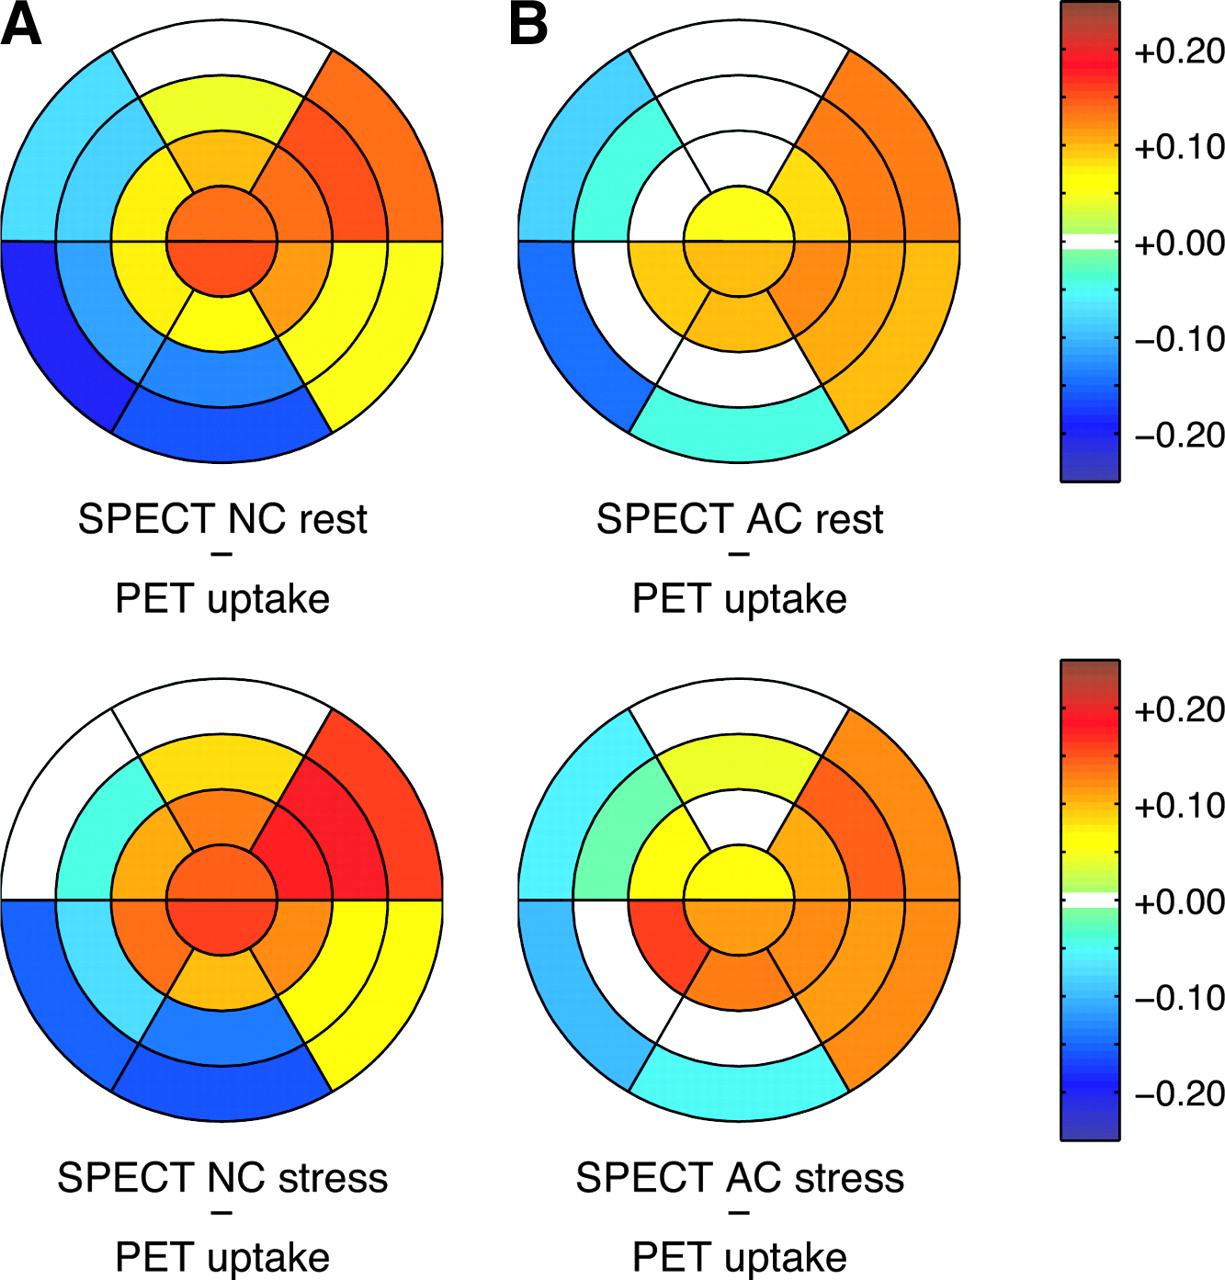
The comparison of PET and SPECT uptake values, based on the 4D-MSPECT analysis, is shown in Figure 3. For the NC studies, under both stress and rest conditions, there are significant differences in almost all segments. NC SPECT does underestimate uptake or perfusion in the mid and basal inferior segment and in the basal inferoseptal segment. As in the first analysis, there is overestimation of perfusion within the apex and the anterolateral wall. In the comparison of AC studies and PET uptake values, significant differences are found in fewer segments and the overall mean differences are smaller. No major differences are present in anterior, septal, or inferior wall. The main difference between PET and AC studies is the overestimation of perfusion in the anterolateral wall, the inferolateral wall, and the apex in the AC studies.

SPECT without (NC) and with attenuation correction (AC) compared with 13N-ammonia uptake (based on 4D-MSPECT). Top row, rest studies. Bottom row, stress studies. (A) Mean differences between NC SPECT and PET uptake. (B) Mean differences between AC SPECT and PET uptake. 0 = no significant difference between regional SPECT uptake and regional 13N-ammonia uptake.
PET Uptake Values After Smoothing Compared with SPECT
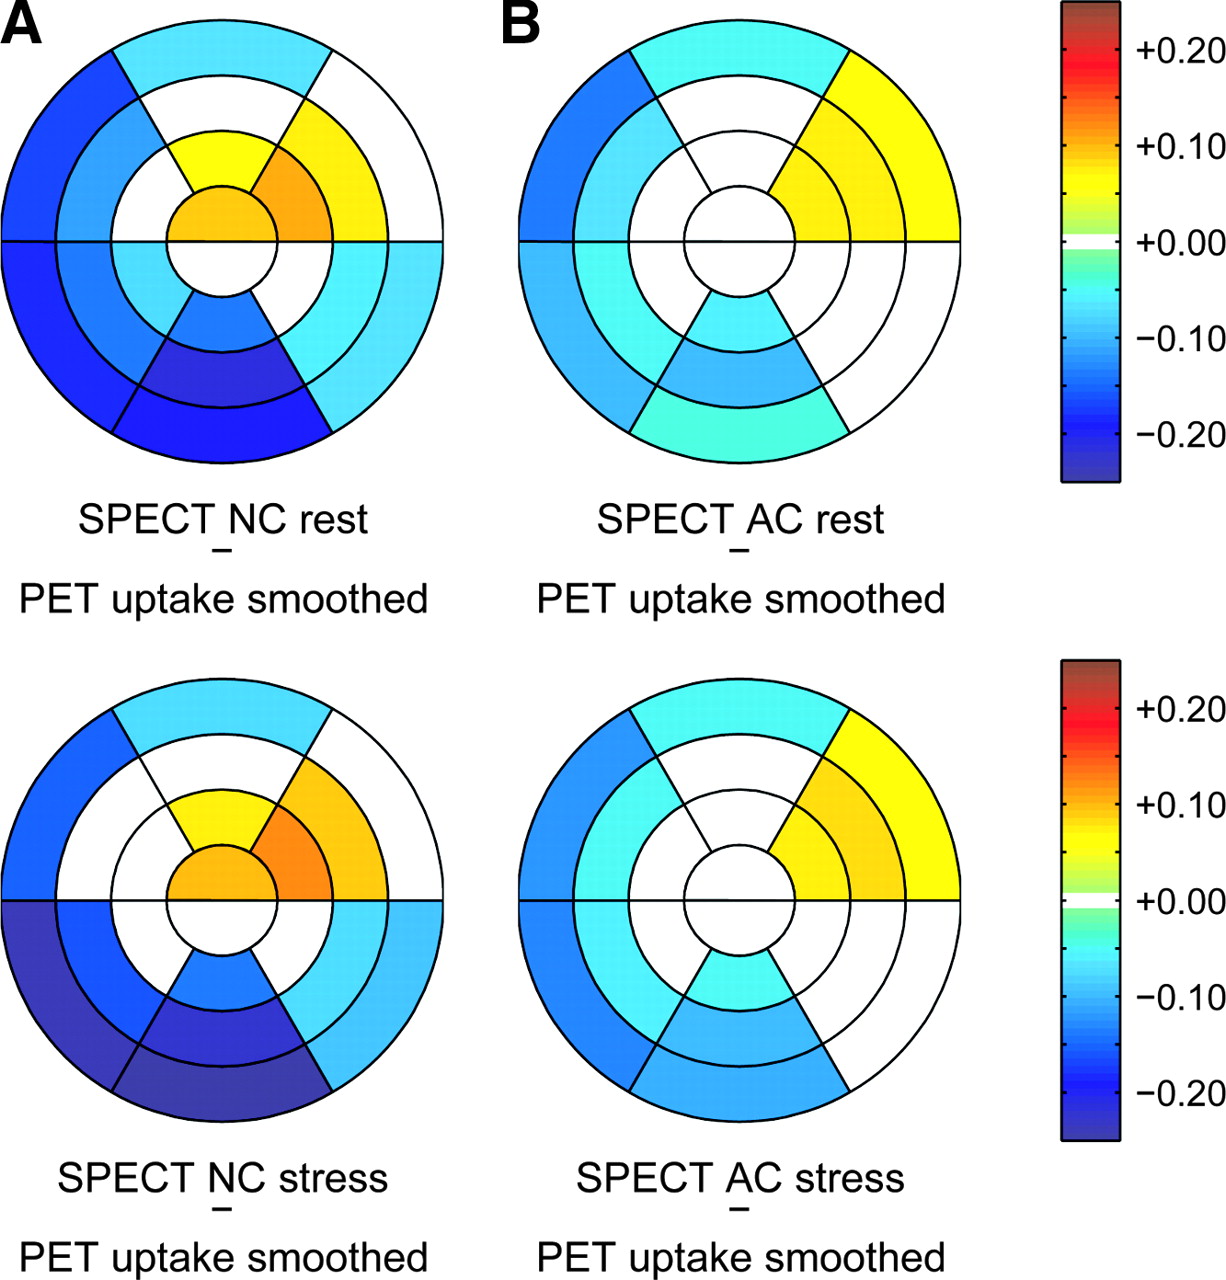
The results for the smoothed PET uptake studies compared with the SPECT studies are given in the Tables 4 and 5. The mean differences between the studies are shown in Figure 4. For the NC studies, the main difference is seen in the inferior wall, followed by the inferoseptal and inferolateral wall. Slight differences in the form of overestimation of regional perfusion are visible in the anteroapical, apical anterior, and apical and mid anterolateral segments. For the AC studies, the overall mean differences are quite small, being less than 10% in most segments. Compared with the previous analyses, now there is a slight underestimation of perfusion in the inferior wall. There is still some overestimation of perfusion in the anterolateral wall.

Comparison of SPECT without (NC) and with attenuation correction (AC) with smoothed PET 13N-ammonia uptake. Top row, rest studies. Bottom row, stress studies. (A) Mean differences between NC SPECT and 13N-ammonia uptake from smoothed images. (B) Mean differences between AC SPECT and 13N-ammonia uptake from smoothed images. 0 = no significant difference between regional SPECT uptake and regional 13N-ammonia uptake (smoothed images).
Rest Studies: Comparison of SPECT 99mTc-MIBI Uptake with 13N-Ammonia PET Uptake (Smoothed Images) (n = 23)
Stress Studies: Comparison of SPECT 99mTc-MIBI Uptake with 13N-Ammonia PET Uptake (Smoothed Images) (n = 23)
Regression Analysis
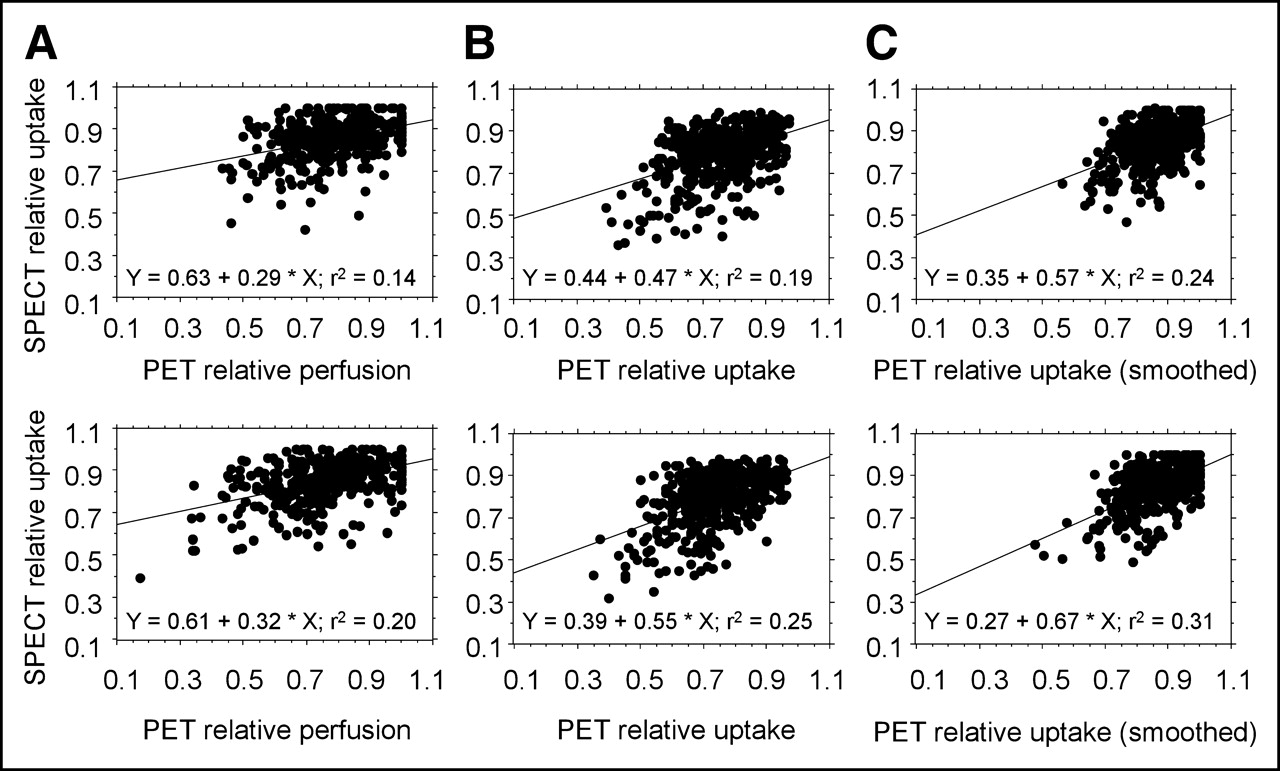
The linear regression of PET and SPECT studies is shown in Figure 5. When normalized perfusion values for PET are given (Fig. 5A), it is apparent that the range of values is higher for the PET than for the SPECT studies. The highest regression coefficient is obtained when smoothed PET uptake values are compared with SPECT uptake values (Fig. 5C).

Linear regression of SPECT and PET segments. Top row, rest studies. Bottom row, stress studies. (A) SPECT relative uptake vs. PET relative perfusion. (B) SPECT relative uptake vs. PET relative uptake. (C) SPECT relative uptake vs. PET relative uptake (smoothed). Regression coefficient (r2) is given.
DISCUSSION
The aim of this study was to evaluate the efficacy of x-ray-derived attenuation correction in myocardial perfusion scintigraphy. Because of the reasons given in the introduction, myocardial perfusion PET using 13N-ammonia was used as the reference method. By choosing this reference method, we ran into some methodic problems. Which PET-derived parameter should be used as a reference: the perfusion values derived from kinetic analysis or the static ammonia uptake values? One might argue that quantitative perfusion values are the best reference method available. On the other hand, the differences between the methods might mask the effect of the attenuation correction that we are trying to observe. Therefore, we decided to use both PET flow and PET uptake as a reference and to compare the results.
Indeed, the regression coefficient between PET and SPECT is higher if ammonia uptake is used instead of perfusion. This can be explained by the different tracer kinetics of 99mTc-MIBI and 13N-ammonia, because the first-pass myocardial extraction of 99mTc-MIBI is only in the 55%–65% range (22). The first-pass myocardial extraction of 13N-ammonia is in the 82% ± 6% range (23), which is relevantly higher. Minor flow differences might not be represented as well with 99mTc-MIBI as with 13N-ammonia. Ammonia uptake, on the other hand, is related to metabolism because the trapping of ammonia depends on the conversion of ammonia to glutamine by the glutamine synthetase pathway. Independent on the method used, the correlation of PET and SPECT in our study is limited. This phenomenon might be due to the relatively low flow differences between the myocardial segments in this study. Potentially, an improved correlation would be observed if the intraindividual flow differences within the myocardium were more pronounced.
SPECT overestimates the relative perfusion in the apex and in the anterolateral wall, regardless of the PET parameter used as a reference. This phenomenon is more pronounced in the NC studies but is detectable in the AC studies as well. We suppose that the comparably low resolution of the SPECT system leads to a more pronounced partial-volume effect. According to Sharir et al. (24), thickening of the left ventricle decreases substantially along the longitudinal axis from the apex to the basal segments. Thus, the partial-volume effect might be responsible for the accentuation of the apex in the SPECT studies. Three-dimensional measurements of the left ventricular geometric indices using CT revealed the thickening in the lateral wall to be stronger than in other walls (25). This effect, combined with the fact that the papillary muscle is located close to the apical anterolateral wall, might be responsible for the overestimation of the regional perfusion in the anterolateral wall in SPECT studies. In a study on patients with left bundle branch block, Nowak et al. outlined the strong influence of differences in wall thickening on the measured regional distribution of 99mTc-MIBI uptake (26). The comparison between SPECT and smoothed PET uptake supports our assumption: The regional differences between PET and SPECT in the apex disappear, especially for the AC studies, and the differences in the anterolateral wall are less pronounced.
Back to the question of whether attenuation correction with the Hawkeye device does improve the quality of the SPECT images. In general, the results of our study confirm the usefulness of the system. The assessment of the inferior wall seems to benefit most from attenuation correction. This finding is in agreement with the results of other studies using various systems for attenuation correction and both 201Tl and 99mTc-labeled radiotracers (6,7,27–31). In the noncorrected studies, we did not find attenuation artifacts in the anterolateral wall as could have been expected due to breast attenuation. This finding might be due to the fact that few women were included in the study. Furthermore, breast attenuation seems to be more important in younger women, likely due to the higher density of the breast (32).
There were no segments in the myocardium of the left ventricle in which the correlation of PET and SPECT was worse after attenuation correction. From this, we conclude that no artifacts introduced by attenuation correction were observed in this small patient cohort.
CONCLUSION
The x-ray-derived attenuation correction of the Millennium VG3 γ-camera with the Hawkeye device leads to SPECT images that represent the distribution of perfusion within the myocardium more accurately than SPECT alone. The largest correction effect is seen in the inferior wall.
When compared with PET-derived perfusion, there are still major differences in regional perfusion in the apex and the anterolateral wall. These differences most likely do not indicate a malfunction of the attenuation correction but are caused by differences in the resolution of the scanning systems. The inferior resolution of the SPECT system leads to artifacts due to partial-volume effects. This phenomenon must be considered if PET perfusion imaging is used as the reference method for the evaluation of attenuation correction systems.
Acknowledgments
This research project was supported by a grant from Bristol-Myers Squibb Pharma, Belgium S.A.
Footnotes
Received Nov. 12, 2004; revision accepted Jan. 11, 2005.
For correspondence or reprints contact: Eva Fricke, MD, Institut für Molekulare Biophysik, Radiopharmazie und Nuklearmedizin, Herz- und Diabeteszentrum Nordrhein-Westfalen, Georgstrasse 11, D-32545 Bad Oeynhausen, Germany.
E-mail: efricke{at}hdz-nrw.de
REFERENCES
In this issue


Jump to section
Related Articles
Cited By...
- Role of Noninvasive Testing in the Clinical Evaluation of Women With Suspected Ischemic Heart Disease: A Consensus Statement From the American Heart Association
- SNMMI/ASNC/SCCT Guideline for Cardiac SPECT/CT and PET/CT 1.0
- Improved Outcome Prediction by SPECT Myocardial Perfusion Imaging After CT Attenuation Correction
- Validation of CT Attenuation Correction for High-Speed Myocardial Perfusion Imaging Using a Novel Cadmium-Zinc-Telluride Detector Technique
- Risk Assessment and Predictive Value of Coronary Artery Disease Testing
- The Year in Cardiac Imaging
- CT Attenuation Correction Is Clinically Superior to Supine-Prone MPS.