


Article Figures & Data
Figures
- FIGURE 1.
Polar maps display mean perfusion (PET) and mean uptake (SPECT) of 23 normalized patient studies. Top row, rest studies. Bottom row, stress studies. (A) Mean perfusion per segment, PET. (B) Mean uptake per segment, SPECT without attenuation correction (NC). (C) Mean uptake per segment, SPECT with attenuation correction (AC).
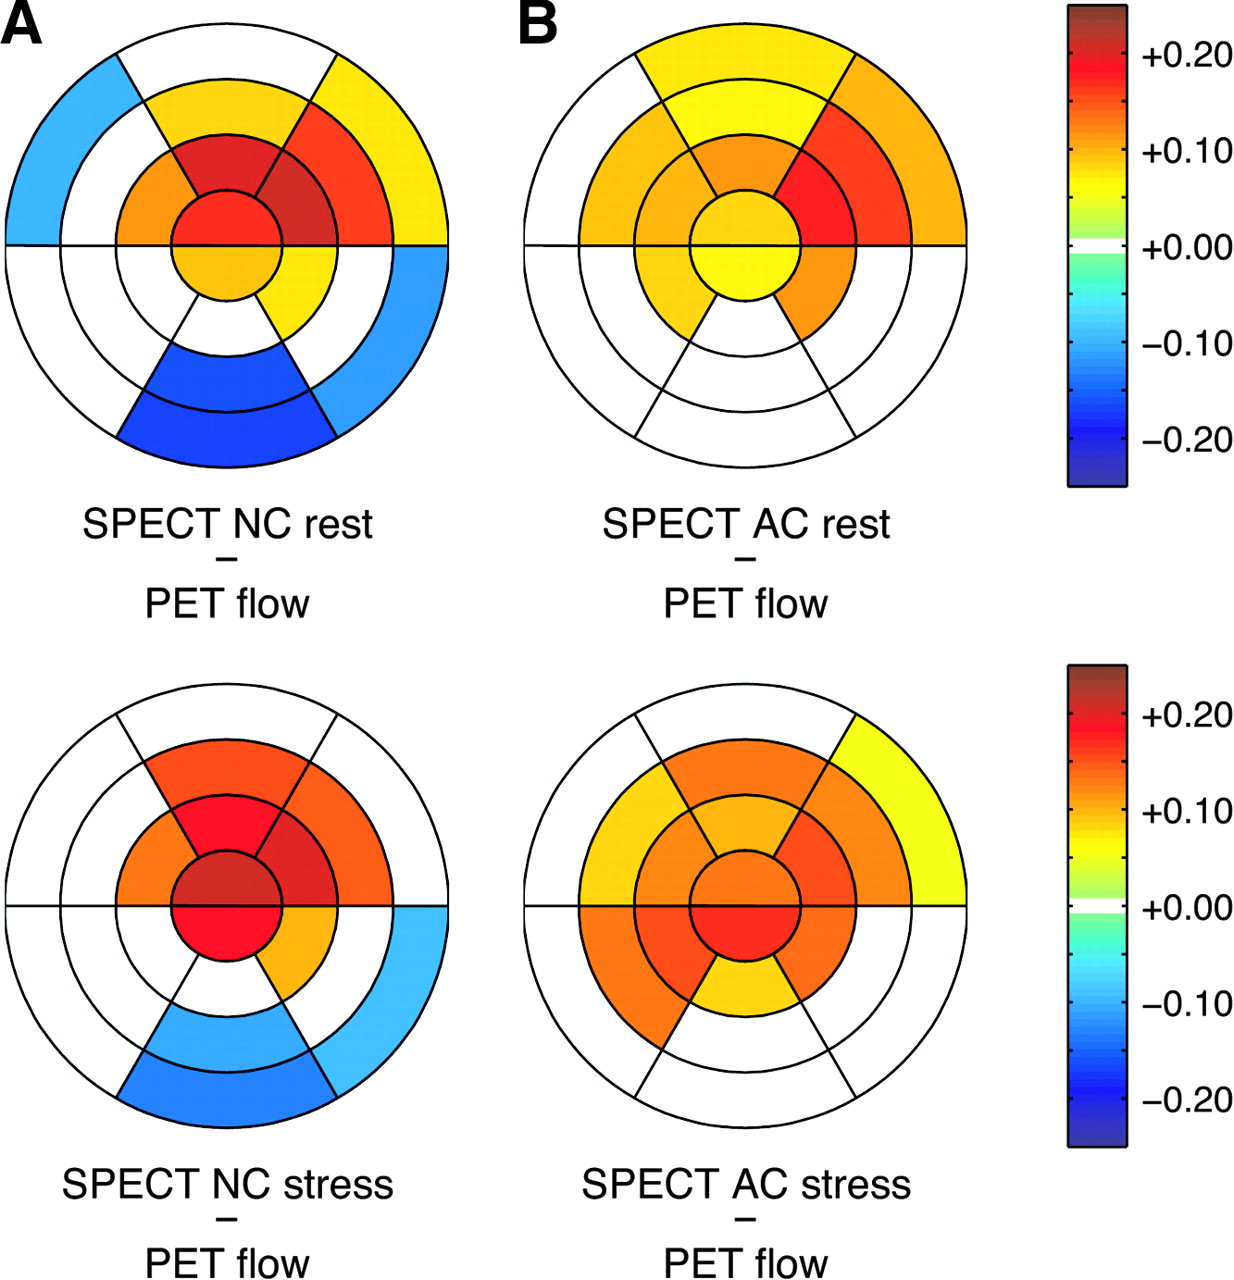
- FIGURE 2.
Comparison of SPECT uptake, without (NC) and with attenuation correction (AC), with PET perfusion. Top row, rest studies. Bottom row, stress studies. (A) Mean differences between NC SPECT and PET perfusion. (B) Mean differences between AC SPECT and PET perfusion. 0 = no significant difference between regional SPECT uptake and regional PET perfusion.
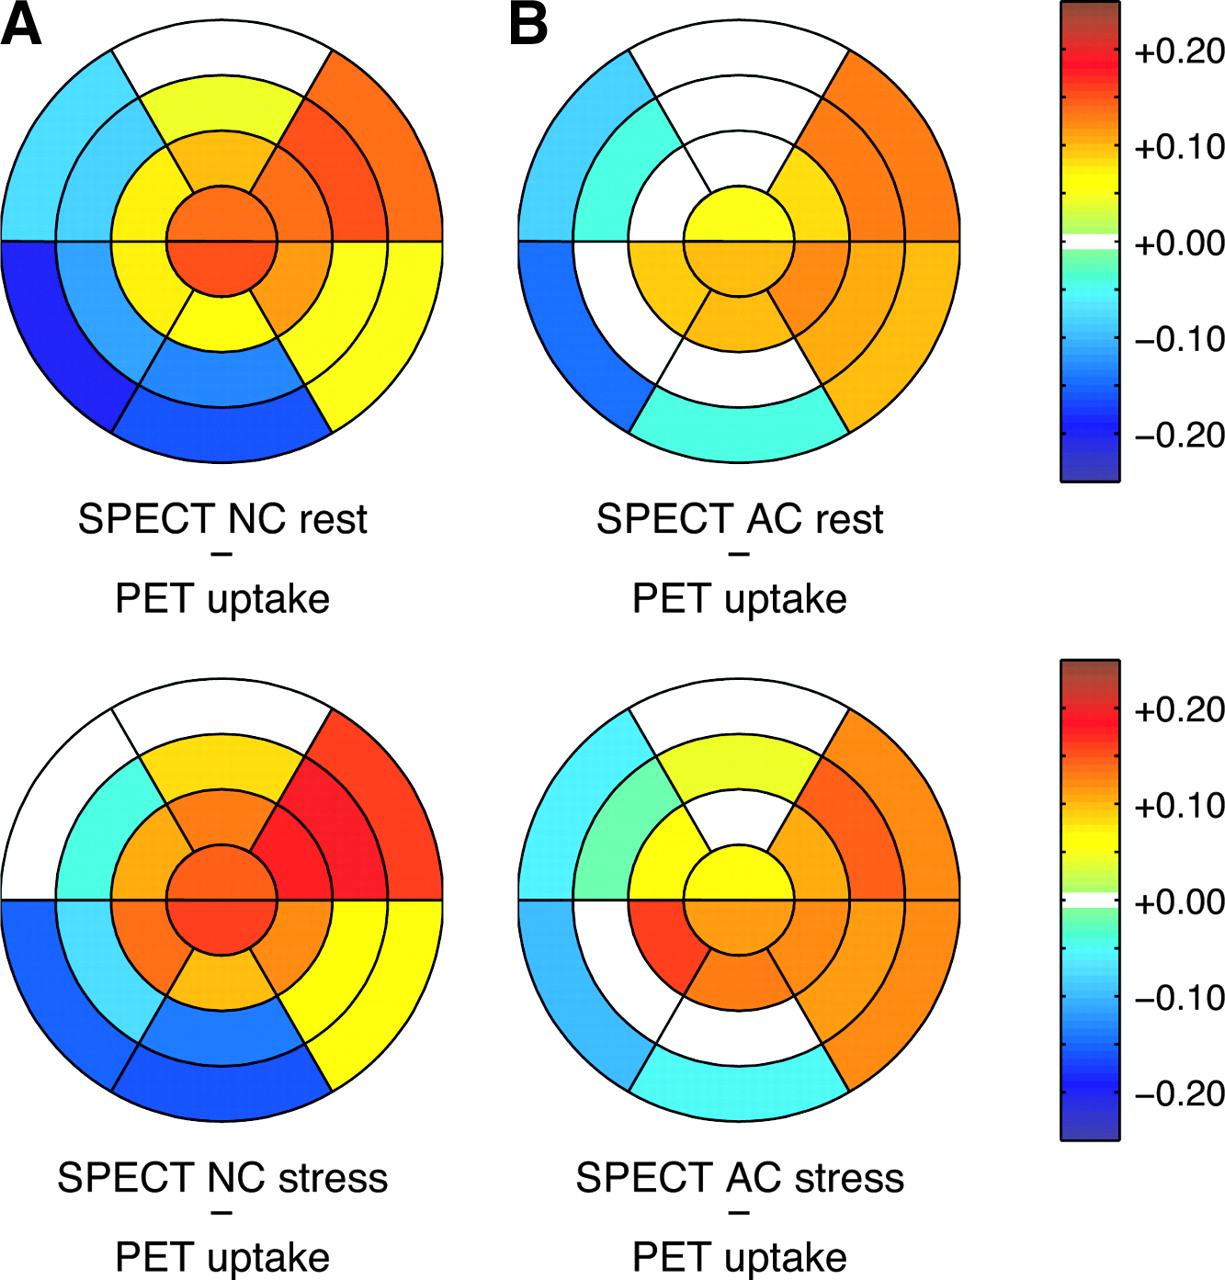
- FIGURE 3.
SPECT without (NC) and with attenuation correction (AC) compared with 13N-ammonia uptake (based on 4D-MSPECT). Top row, rest studies. Bottom row, stress studies. (A) Mean differences between NC SPECT and PET uptake. (B) Mean differences between AC SPECT and PET uptake. 0 = no significant difference between regional SPECT uptake and regional 13N-ammonia uptake.
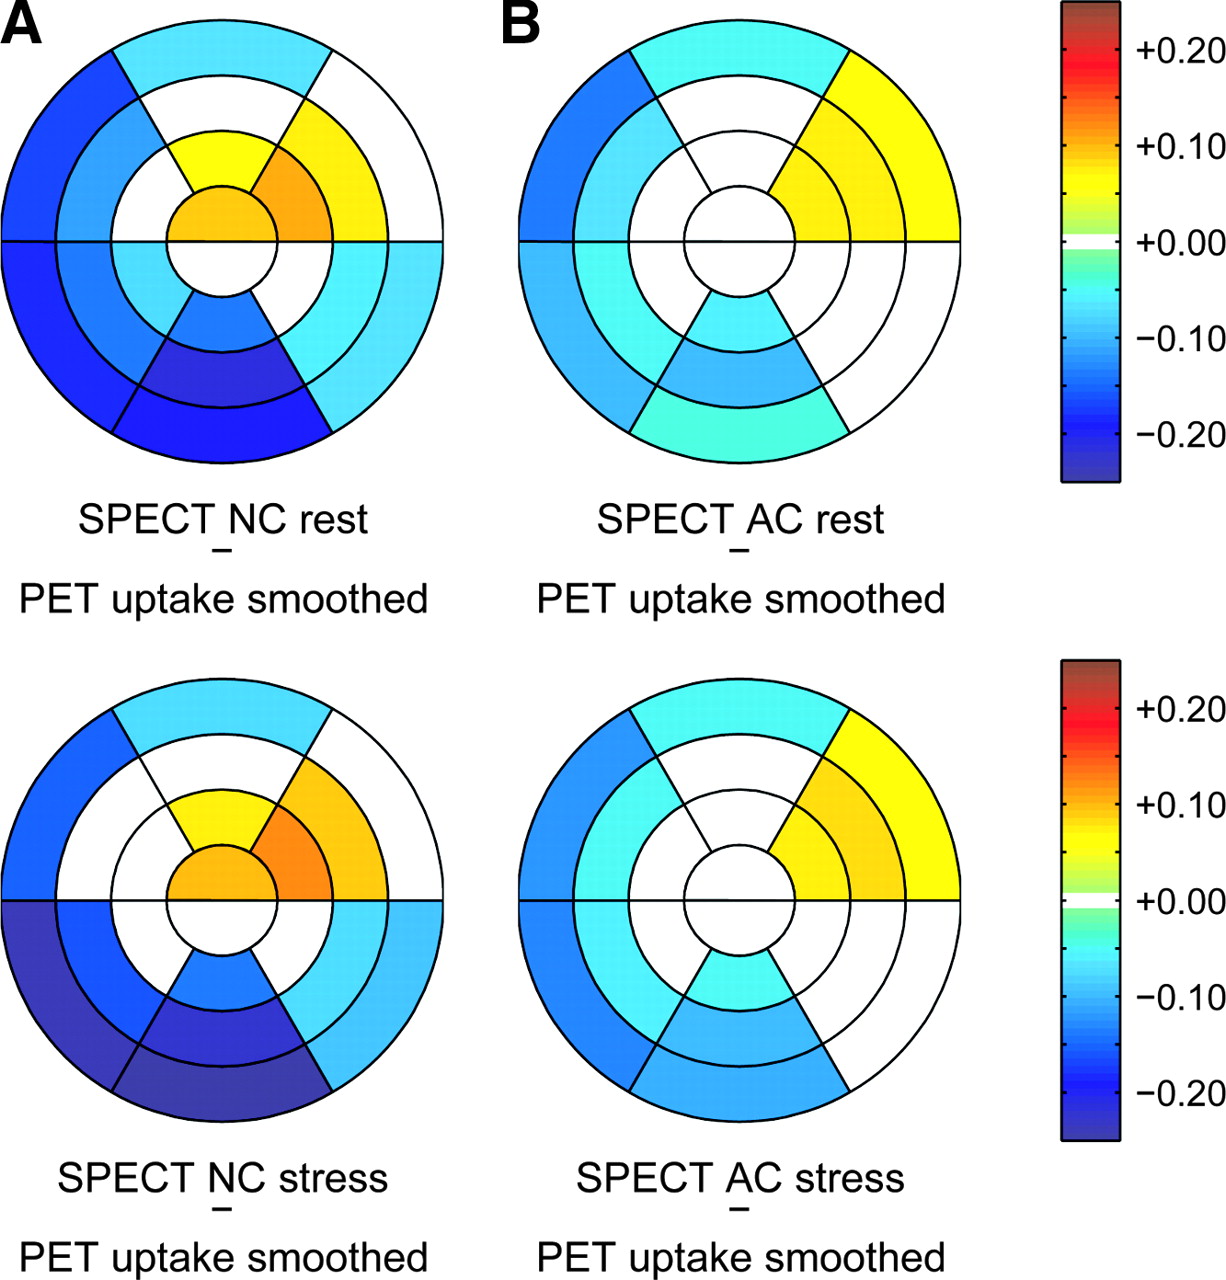
- FIGURE 4.
Comparison of SPECT without (NC) and with attenuation correction (AC) with smoothed PET 13N-ammonia uptake. Top row, rest studies. Bottom row, stress studies. (A) Mean differences between NC SPECT and 13N-ammonia uptake from smoothed images. (B) Mean differences between AC SPECT and 13N-ammonia uptake from smoothed images. 0 = no significant difference between regional SPECT uptake and regional 13N-ammonia uptake (smoothed images).
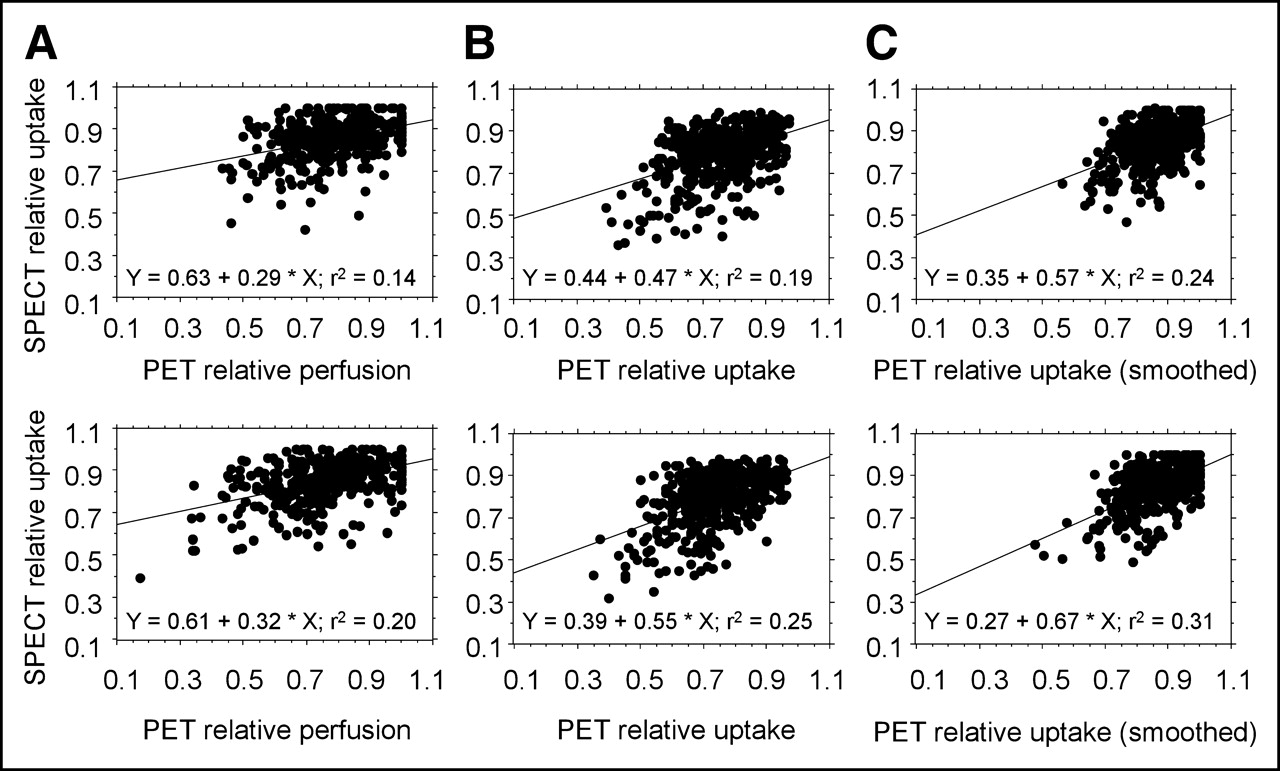
- FIGURE 5.
Linear regression of SPECT and PET segments. Top row, rest studies. Bottom row, stress studies. (A) SPECT relative uptake vs. PET relative perfusion. (B) SPECT relative uptake vs. PET relative uptake. (C) SPECT relative uptake vs. PET relative uptake (smoothed). Regression coefficient (r2) is given.


Tables
Patient no. Sex LVEF (%) EDV (mL) ESV (mL) Myocardial infarction 1 M 69 101 31 None 2 M 55 94 42 None 3 M 61 102 39 None 4 M 54 115 52 None 5 M * * * Nontransmural basal anterolateral and inferolateral wall 6 M 55 135 60 Transmural basal inferolateral wall 7 M 61 155 60 None 8 F 81 53 10 None 9 M 62 140 53 None 10 M 55 86 38 None 11 M 64 73 26 None 12 F 61 55 21 None 13 F 62 69 26 Nontransmural basal inferolateral wall 14 F 66 53 18 None 15 F 20 178 142 Transmural mid and basal inferolateral wall 16 F 75 57 14 None 17 M 61 109 42 None 18 M 66 121 41 None 19 M 63 86 31 Transmural mid and basal inferior wall 20 M 65 98 34 None 21 M 33 127 85 Nontransmural apical and mid anteroseptal wall 22 M 58 125 52 Nontransmural mid inferior wall 23 M 52 123 58 Nontransmural anteroapical and inferoapical wall ↵* Missing data.
LVEF = left ventricular ejection fraction; EDV = end-diastolic volume; ESV = end-systolic volume.
- TABLE 2
Rest Studies: Comparison of SPECT 99mTc-MIBI Uptake with 13N-Ammonia PET Perfusion (n = 23)
Segment PET SPECT NC SPECT AC Flow (mL/100 mL · min) % % MD* P* % MD† P† Anteroapical 68.2 ± 15.2 70.8 ± 11.3 88.1 ± 9.9 16.7 <0.0001 79.5 ± 8.7 8.2 0.0100 Inferoapical 71.7 ± 15.1 74.7 ± 12.4 82.5 ± 10.0 8.8 0.0207 80.1 ± 8.7 6.4 0.0340 Apical anterolateral 71.4 ± 11.4 74.8 ± 10.2 95.2 ± 5.9 20.9 <0.0001 91.6 ± 5.6 17.2 <0.0001 Apical anterior 67.9 ± 13.1 70.9 ± 11.0 91.0 ± 7.6 20.0 <0.0001 82.9 ± 7.7 11.7 0.0002 Apical anteroseptal 74.2 ± 15.9 75.3 ± 10.9 85.8 ± 8.6 11.2 0.0074 84.2 ± 8.6 9.6 0.0074 Apical inferoseptal 81.3 ± 22.6 83.5 ± 16.8 85.3 ± 8.1 2.8 NS 90.5 ± 8.3 8.0 0.0148 Apical inferior 78.0 ± 17.7 83.3 ± 13.4 77.5 ± 8.6 −6.8 NS 86.0 ± 7.5 2.0 NS Apical inferolateral 72.1 ± 12.4 76.4 ± 10.5 84.0 ± 7.6 7.6 0.0305 87.8 ± 7.3 11.4 0.0014 Mid anterolateral 75.1 ± 11.9 78.5 ± 10.3 94.1 ± 7.2 16.3 <0.0001 94.5 ± 7.8 16.3 <0.0001 Mid anterior 77.0 ± 13.8 80.4 ± 9.6 88.9 ± 6.5 8.3 0.0023 87.7 ± 7.4 6.4 0.0023 Mid anteroseptal 75.8 ± 18.1 79.0 ± 12.3 82.0 ± 9.2 4.9 NS 86.6 ± 9.0 9.3 0.0030 Mid inferoseptal 83.7 ± 20.4 85.1 ± 13.6 78.6 ± 9.6 −5.7 NS 89.0 ± 8.9 4.9 NS Mid inferior 84.9 ± 17.5 90.3 ± 11.7 73.0 ± 10.4 −16.4 <0.0001 87.4 ± 11.1 −1.5 NS Mid inferolateral 78.3 ± 16.5 82.5 ± 9.3 78.9 ± 11.6 −4.5 NS 87.0 ± 11.0 −4.0 NS Basal anterolateral 72.9 ± 14.1 76.2 ± 12.8 82.9 ± 8.5 7.3 0.0232 86.3 ± 7.8 10.1 0.0004 Basal anterior 70.4 ± 12.3 73.5 ± 7.4 78.4 ± 9.0 5.5 NS 80.9 ± 6.8 7.4 0.0034 Basal anteroseptal 64.7 ± 12.8 72.2 ± 11.4 61.4 ± 9.6 −9.4 0.0153 64.9 ± 9.5 −6.0 NS Basal inferoseptal 62.3 ± 13.8 71.0 ± 11.1 59.5 ± 10.2 −9.0 NS 68.5 ± 9.8 2.8 NS Basal inferior 78.6 ± 21.7 83.1 ± 14.8 65.0 ± 13.2 −16.5 <0.0001 79.9 ± 13.4 −1.9 NS Basal inferolateral 79.9 ± 19.5 83.6 ± 11.3 70.9 ± 13.6 −11.5 0.0012 80.4 ± 13.1 −2.0 NS ↵* Comparison of PET and NC.
↵† Comparison of PET and AC.
NC = nonattenuation-corrected SPECT rest study; AC = attenuation-corrected SPECT rest study; % = studies normalized to segment with maximum flow (PET) or uptake (SPECT); MD = mean difference; NS = not significant.
Data are given as mean of 23 studies ± SD.
- TABLE 3
Stress Studies: Comparison of SPECT 99mTc-MIBI Uptake with 13N-Ammonia PET Perfusion (n = 23)
Segment PET SPECT NC SPECT AC Flow (mL/100 mL · min) % NC MD* P* AC MD† P† Anteroapical 195.6 ± 56.9 67.9 ± 12.0 88.7 ± 10.5 20.8 <0.0001 80.6 ± 8.8 12.7 <0.0001 Inferoapical 191.0 ± 59.9 65.0 ± 12.8 83.3 ± 9.8 18.6 <0.0001 81.8 ± 7.8 17.1 <0.0001 Apical anterolateral 213.6 ± 75.0 73.8 ± 14.1 94.0 ± 6.0 20.3 <0.0001 89.2 ± 8.9 15.4 <0.0001 Apical anterior 207.0 ± 58.3 72.0 ± 12.0 90.5 ± 9.4 18.5 <0.0001 81.8 ± 9.5 9.8 0.0011 Apical anteroseptal 218.0 ± 69.4 75.4 ± 14.6 88.6 ± 8.1 13.1 0.0001 87.6 ± 9.3 11.9 0.0007 Apical inferoseptal 219.3 ± 96.1 78.1 ± 16.1 89.0 ± 9.7 11.0 NS 95.0 ± 7.5 15.6 0.0041 Apical inferior 215.6 ± 76.6 77.2 ± 16.5 78.9 ± 11.0 −1.0 NS 87.7 ± 8.4 8.0 0.0406 Apical inferolateral 212.9 ± 73.4 73.1 ± 12.3 83.2 ± 8.2 10.1 0.0001 86.4 ± 8.2 13.3 <0.0001 Mid anterolateral 223.5 ± 69.6 78.2 ± 14.7 92.4 ± 9.9 14.2 <0.0001 90.1 ± 10.9 11.9 0.0002 Mid anterior 208.4 ± 70.1 73.2 ± 14.1 88.3 ± 6.7 15.6 <0.0001 85.7 ± 8.8 13.1 0.0003 Mid anteroseptal 221.7 ± 77.3 80.6 ± 11.9 84.9 ± 9.0 4.1 NS 88.9 ± 8.5 8.3 0.0358 Mid inferoseptal 257.6 ± 140.9 77.7 ± 19.1 79.7 ± 10.1 2.2 NS 90.4 ± 8.3 12.7 0.0305 Mid inferior 255.1 ± 99.1 84.4 ± 12.7 72.7 ± 12.0 −10.6 0.0022 86.9 ± 10.7 3.6 NS Mid inferolateral 239.1 ± 86.8 82.0 ± 13.5 78.6 ± 10.7 −3.2 NS 86.2 ± 11.7 5.4 NS Basal anterolateral 222.3 ± 77.2 76.9 ± 15.1 81.7 ± 10.5 4.7 NS 82.4 ± 10.2 5.4 0.0421 Basal anterior 221.1 ± 85.2 74.8 ± 14.5 77.1 ± 8.5 1.8 NS 79.4 ± 7.6 4.4 NS Basal anteroseptal 200.6 ± 75.1 64.4 ± 13.3 62.6 ± 11.3 3.9 NS 65.8 ± 10.2 5.3 NS Basal inferoseptal 216.4 ± 102.8 64.4 ± 17.6 57.8 ± 10.1 −1.9 NS 68.1 ± 9.7 6.5 NS Basal inferior 245.9 ± 117.0 77.1 ± 23.8 64.0 ± 11.7 −12.9 0.0156 79.0 ± 12.0 1.0 NS Basal inferolateral 191.1 ± 59.9 80.0 ± 13.4 71.2 ± 12.7 −9.1 0.0314 79.1 ± 12.9 −1.0 NS ↵* Comparison of PET and NC.
↵† Comparison of PET and AC.
NC = nonattenuation-corrected SPECT stress study; AC = attenuation-corrected SPECT stress study; % = studies normalized to segment with maximum flow (PET) or uptake (SPECT); MD = mean difference; NS = not significant.
Data are given as mean of 23 studies ± SD.
- TABLE 4
Rest Studies: Comparison of SPECT 99mTc-MIBI Uptake with 13N-Ammonia PET Uptake (Smoothed Images) (n = 23)
Segment PET, % SPECT NC SPECT AC % MD* P* % MD† P† Anteroapical 80.5 ± 5.6 88.1 ± 9.9 9.1 0.0006 79.5 ± 8.7 0.4 NS Inferoapical 81.5 ± 5.6 82.5 ± 10.0 2.5 NS 80.1 ± 8.7 −0.2 NS Apical anterolateral 84.6 ± 8.2 95.2 ± 5.9 10.9 <0.0001 91.6 ± 5.6 7.2 <0.0001 Apical anterior 86.1 ± 6.9 91.0 ± 7.6 6.2 0.0031 82.9 ± 7.7 −1.7 NS Apical anteroseptal 88.5 ± 4.7 85.8 ± 8.6 −1.7 NS 84.2 ± 8.6 −3.2 NS Apical inferoseptal 93.2 ± 4.7 85.3 ± 8.1 −7.7 0.0015 90.5 ± 8.3 −2.3 NS Apical inferior 92.4 ± 6.0 77.5 ± 8.6 −13.9 <0.0001 86.0 ± 7.5 −6.0 0.0016 Apical inferolateral 85.0 ± 5.8 84.0 ± 7.6 0.0 NS 87.8 ± 7.3 3.3 NS Mid anterolateral 86.3 ± 10.0 94.1 ± 7.2 7.4 0.0013 94.5 ± 7.8 7.7 <0.0001 Mid anterior 92.0 ± 7.3 88.9 ± 6.5 −2.0 NS 87.7 ± 7.4 −2.7 NS Mid anteroseptal 94.4 ± 5.1 82.0 ± 9.2 −11.1 <0.0001 86.6 ± 9.0 −6.5 0.0006 Mid inferoseptal 95.0 ± 3.9 78.6 ± 9.6 −13.8 <0.0001 89.0 ± 8.9 −5.2 0.0166 Mid inferior 95.4 ± 5.4 73.0 ± 10.4 −21.7 <0.0001 87.4 ± 11.1 −9.4 0.0011 Mid inferolateral 85.6 ± 7.9 78.9 ± 11.6 −6.2 0.0349 87.0 ± 11.0 1.3 NS Basal anterolateral 80.1 ± 9.4 82.9 ± 8.5 3.7 NS 86.3 ± 7.8 5.8 0.0035 Basal anterior 86.7 ± 7.1 78.4 ± 9.0 −6.8 0.0058 80.9 ± 6.8 −4.8 0.0102 Basal anteroseptal 79.2 ± 9.2 61.4 ± 9.6 −16.6 <0.0001 64.9 ± 9.5 −13.5 <0.0001 Basal inferoseptal 79.5 ± 7.6 59.5 ± 10.2 −18.3 <0.0001 68.5 ± 9.8 −9.7 0.0010 Basal inferior 87.2 ± 6.6 65.0 ± 13.2 −19.0 <0.0001 79.9 ± 13.4 −4.4 0.0128 Basal inferolateral 79.3 ± 8.0 70.9 ± 13.6 −6.3 0.0225 80.4 ± 13.1 2.3 NS - TABLE 5
Stress Studies: Comparison of SPECT 99mTc-MIBI Uptake with 13N-Ammonia PET Uptake (Smoothed Images) (n = 23)
Segment PET, % SPECT NC SPECT AC % MD* P* % MD† P† Anteroapical 80.4 ± 5.6 88.7 ± 10.5 10.0 0.0003 80.6 ± 8.8 1.6 NS Inferoapical 82.5 ± 5.5 83.3 ± 9.8 1.7 NS 81.8 ± 7.8 −0.1 NS Apical anterolateral 82.0 ± 9.8 94.0 ± 6.0 11.9 <0.0001 89.2 ± 8.9 7.7 <0.0001 Apical anterior 84.8 ± 6.8 90.5 ± 9.4 7.2 0.0031 81.8 ± 9.5 −1.4 NS Apical anteroseptal 90.8 ± 4.9 88.6 ± 8.1 −1.5 NS 87.6 ± 9.3 −2.2 NS Apical inferoseptal 94.2 ± 3.5 89.0 ± 9.7 −4.5 NS 95.0 ± 7.5 1.6 NS Apical inferior 94.0 ± 6.1 78.9 ± 11.0 −13.4 0.0001 87.7 ± 8.4 −5.2 0.0014 Apical inferolateral 86.5 ± 7.8 83.2 ± 8.2 −1.9 NS 86.4 ± 8.2 1.2 NS Mid anterolateral 82.0 ± 11.0 92.4 ± 9.9 9.3 0.0001 90.1 ± 10.9 7.9 0.0003 Mid anterior 89.6 ± 7.4 88.3 ± 6.7 −0.7 NS 85.7 ± 8.8 −2.6 NS Mid anteroseptal 95.4 ± 5.3 84.9 ± 9.0 −9.5 NS 88.9 ± 8.5 −5.1 0.0028 Mid inferoseptal 96.0 ± 3.8 79.7 ± 10.1 −16.4 0.0010 90.4 ± 8.3 −5.6 0.0075 Mid inferior 95.0 ± 6.7 72.7 ± 12.0 −22.0 0.0005 86.9 ± 10.7 −10.0 0.0054 Mid inferolateral 86.0 ± 8.4 78.6 ± 10.7 −7.6 0.0136 86.2 ± 11.7 0.8 NS Basal anterolateral 76.1 ± 8.7 81.7 ± 10.5 4.8 NS 82.4 ± 10.2 6.1 0.0046 Basal anterior 84.9 ± 5.7 77.1 ± 8.5 −7.1 0.0058 79.4 ± 7.6 −4.7 0.0158 Basal anteroseptal 78.7 ± 8.7 62.6 ± 11.3 −15.6 <0.0001 65.8 ± 10.2 −12.4 <0.0001 Basal inferoseptal 81.4 ± 7.3 57.8 ± 10.1 −23.6 <0.0001 68.1 ± 9.7 −13.0 <0.0001 Basal inferior 91.1 ± 7.6 64.0 ± 11.7 −24.6 <0.0001 79.0 ± 12.0 −10.2 0.0003 Basal inferolateral 82.5 ± 5.5 71.2 ± 12.7 −9.3 0.0077 79.1 ± 12.9 −0.5 NS
In this issue


Jump to section
Related Articles
Cited By...
- Role of Noninvasive Testing in the Clinical Evaluation of Women With Suspected Ischemic Heart Disease: A Consensus Statement From the American Heart Association
- SNMMI/ASNC/SCCT Guideline for Cardiac SPECT/CT and PET/CT 1.0
- Improved Outcome Prediction by SPECT Myocardial Perfusion Imaging After CT Attenuation Correction
- Validation of CT Attenuation Correction for High-Speed Myocardial Perfusion Imaging Using a Novel Cadmium-Zinc-Telluride Detector Technique
- Risk Assessment and Predictive Value of Coronary Artery Disease Testing
- The Year in Cardiac Imaging
- CT Attenuation Correction Is Clinically Superior to Supine-Prone MPS.