


Abstract
The purpose of this study was to describe baseline 18F-FDG PET voxel characteristics in pediatric diffuse intrinsic pontine glioma (DIPG) and to correlate these metrics with baseline MRI apparent diffusion coefficient (ADC) histogram metrics, progression-free survival (PFS), and overall survival. Methods: Baseline brain 18F-FDG PET and MRI scans were obtained in 33 children from Pediatric Brain Tumor Consortium clinical DIPG trials. 18F-FDG PET images, postgadolinium MR images, and ADC MR images were registered to baseline fluid attenuation inversion recovery MR images. Three-dimensional regions of interest on fluid attenuation inversion recovery MR images and postgadolinium MR images and 18F-FDG PET and MR ADC histograms were generated. Metrics evaluated included peak number, skewness, and kurtosis. Correlation between PET and MR ADC histogram metrics was evaluated. PET pixel values within the region of interest for each tumor were plotted against MR ADC values. The association of these imaging markers with survival was described. Results: PET histograms were almost always unimodal (94%, vs. 6% bimodal). None of the PET histogram parameters (skewness or kurtosis) had a significant association with PFS, although a higher PET postgadolinium skewness tended toward a less favorable PFS (hazard ratio, 3.48; 95% confidence interval [CI], 0.75–16.28 [P = 0.11]). There was a significant association between higher MR ADC postgadolinium skewness and shorter PFS (hazard ratio, 2.56; 95% CI, 1.11–5.91 [P = 0.028]), and there was the suggestion that this also led to shorter overall survival (hazard ratio, 2.18; 95% CI, 0.95–5.04 [P = 0.067]). Higher MR ADC postgadolinium kurtosis tended toward shorter PFS (hazard ratio, 1.30; 95% CI, 0.98–1.74 [P = 0.073]). PET and MR ADC pixel values were negatively correlated using the Pearson correlation coefficient. Further, the level of PET and MR ADC correlation was significantly positively associated with PFS; tumors with higher values of ADC–PET correlation had more favorable PFS (hazard ratio, 0.17; 95% CI, 0.03–0.89 [P = 0.036]), suggesting that a higher level of negative ADC–PET correlation leads to less favorable PFS. A more significant negative correlation may indicate higher-grade elements within the tumor leading to poorer outcomes. Conclusion: 18F-FDG PET and MR ADC histogram metrics in pediatric DIPG demonstrate different characteristics with often a negative correlation between PET and MR ADC pixel values. A higher negative correlation is associated with a worse PFS, which may indicate higher-grade elements within the tumor.
See an invited perspective on this article on page 1262.
In children, brain tumors are the leading cause of death from solid tumors. In 2017, an estimated 4,820 new pediatric brain tumors will be diagnosed in the United States, with an incidence of 5.67 cases per 100,000 in children 0–14 y old (1,2). Brain stem gliomas account for about 12% of the primary brain tumors in this age group, and approximately 80% arise in the pons (1,2). Radiation improves neurologic function, but no therapies have provided benefit and the prognosis for diffuse intrinsic pontine glioma (DIPG) is poor, with mean survival of less than 12 mo (3,4).
The diagnosis of a DIPG is based on symptoms and an MRI appearance (T1 hypointense and T2 hyperintense) demonstrating little to no enhancement. Baseline enhancement is associated with decreased survival (5,6). Recent research suggests that sites of tumor enhancement correlate with sites of reduced diffusivity, lower apparent diffusion coefficient (ADC) values, and more aggressive disease (6–8). Volumetric ADC histogram metrics are significantly correlated with survival, with lower diffusion values being associated with shorter survival (9). Despite significant advances in the MRI techniques used to characterize DIPG, MRI remains limited in distinguishing functioning tumor. PET with 18F-FDG shows sites of metabolically active disease, albeit with limited anatomic detail. Further, the intensity of 18F-FDG uptake may reflect malignancy grade and predict survival (10–14). Thus, there is a potential benefit to fused PET and MR images, with the ADC values on MRI and the intensity of 18F-FDG uptake on PET possibly providing synergistic information on tumor grade and prognosis.
The aim of this study was to describe baseline 18F-FDG PET voxel characteristics in pediatric DIPG as characterized by histogram metrics and to correlate these metrics with baseline MRI ADC metrics, progression-free survival (PFS), and overall survival (OS).
MATERIALS AND METHODS
Study Description
The institutional review boards of the Pediatric Brain Tumor Consortium (PBTC) institutions approved the studies before patient enrollment, and continuing approval was maintained throughout. Patients or legal guardians gave written informed consent; assent was obtained as appropriate. Baseline PET and MRI studies were from children enrolled in 1 of 4 clinical trials designed to investigate the efficacy of radiation therapy and molecular targeting agents for newly diagnosed DIPG. PBTC-006 included children on twice-daily imatinib and concurrent irradiation at doses of 200–800 mg/m2. Phase I PBTC-007 included children on once-daily gefitinib at doses of 100–375 mg/m2; those from the phase II trial received 250 mg/m2 with concurrent radiotherapy. Children in phase I PBTC-014 received twice-daily tipifarnib at doses of 100–150 mg/m2; those in phase II received doses of 125 mg/m2 with concurrent radiotherapy. Children in phase I PBTC-021 received capecitabine, 650 mg/m2/dose twice daily concurrently with radiotherapy and 1,250 mg/m2/dose twice daily after radiotherapy.
Images from participating institutions were electronically transferred to the PBTC Operations, Biostatistics, and Data Management Core and, after anonymization, to the PBTC Neuroimaging Center for analysis (15). Neuroimaging Center investigators were masked to patient outcome at the time of image evaluation. The consistency of MRI and PET data was maintained by a standard quality assurance program (16–19).
MR Image Acquisition
Standard MR images were acquired at each institution using either a 1.5-T or a 3-T scanner with axial fluid attenuation inversion recovery (FLAIR), axial T2 weighting, axial diffusion, and axial T1-weighted postgadolinium imaging. The imaging parameters were similar for the 1.5-T and 3-T scanners. FLAIR images were obtained as 4-mm-thick contiguous slices using a repetition time/inversion time/echo time of 10,000/2,200/162 ms, a 256 × 192 matrix, an 18- to 24-cm field of view, and 1 excitation. Axial T2-weighted fast spin echo images were obtained with a repetition time/effective echo time of 4,000–6,000/80–100 ms, an echo train length of 10–16, a radiofrequency band of ±16 kHz, an 18- to 24-cm field of view, interleaved 4-mm-thick slices with no gap, 2 excitations, a 256 × 192 matrix, the flow compensation option, and a frequency direction of anterior to posterior. Diffusion images were obtained as single-shot echoplanar spin echo images with a repetition time/echo time of 2000/80 ms, a 128 × 128 matrix, b-factors of 5 and 1,000 s/mm2, 3 directions (x, y, and z) for trace imaging, a receiver bandwidth of ±64 kHz, a frequency direction of right to left, and a slice thickness of 4 mm with no gap. Postcontrast axial T1-weighted spin echo images were obtained as 4-mm-thick contiguous slices using a repetition time/minimum full echo time of 500–700 ms, 2 excitations, and a 256 × 192 matrix.
PET Acquisition and Reconstruction
The 18F-FDG PET scans were acquired on a variety of scanners (Advance NXI, Discovery LS, and Discovery STE [GE Healthcare]; G-PET [Philips]; and HR+ and HiRez Bioscan [Siemens]) in 3-dimensional (3D) mode for 10 min, at 40–60 min after the intravenous administration of 5.55 MBq of 18F-FDG per kilogram (minimum dose, 18 MBq; maximum dose, 370 MBq). All patients fasted for 4 h before undergoing PET. Attenuation correction was performed using either a 3-min segmented transmission scan with 68Ge/68Ga rods or a CT-based approach, depending on whether the scanner was a PET scanner or a PET/CT scanner, respectively. The acquired data were reconstructed using Fourier rebinning followed by 2-dimensional ordered-subset expectation maximization. The PET data analyzed in this study were transmitted by the different centers to the Neuroimaging Center in a variety of formats: pixel values were represented as either raw counts, activity concentration (in Bq/mL), or SUV. Consistency of PET data was maintained by adherence to a standard quality assurance program with daily blank scans and quarterly normalization, calibration, and preventive maintenance. Two phantoms were imaged at each site for consistent quantitation (18,19). To standardize region-of-interest (ROI) values, they were normalized by values obtained in a comparison region (18). The mean pixel values within the tumor ROI were normalized by those for normal white matter.
Image Analysis
To generate the MRI ADC histogram (Fig. 1), the ADC images and the contrast-enhanced images were separately registered to the FLAIR images using the software library of the Oxford Centre for Functional MRI of the Brain (20). If FLAIR images were unavailable, axial T2-weighted images were substituted and registered to the ADC and contrast-enhanced images. Next, both the FLAIR images and the contrast-enhanced images were used to determine their respective 3D volumetric tumor ROIs using the thresholding feature available in Fiji (21), along with ImageJ (National Institutes of Health). The same 3D ROIs were applied to the registered ADC maps, and the histogram of the ADC values of all voxels in each ROI was generated. All ADC histograms were then uniformly constrained to a lower threshold of 600 × 10−6 mm2/s and an upper threshold of 2,600 × 10−6 mm2/s, and a uniform bin width of 10 was used to facilitate comparison of metrics between histograms by excluding areas of necrosis, hemorrhage, or cystic degeneration.
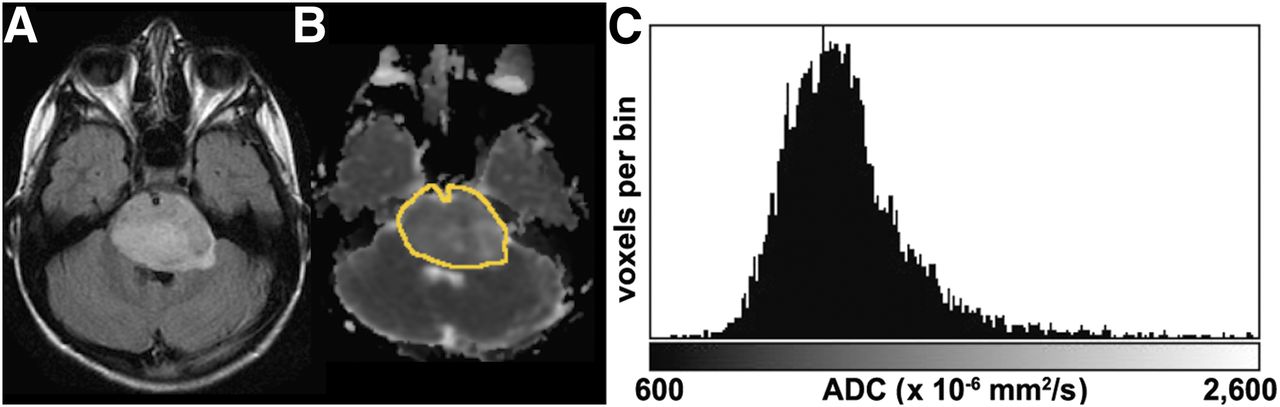
ADC histogram generation. (A) ADC and postcontrast images are registered to FLAIR image using software library of Oxford Centre for Functional MRI of Brain. Tumor 3D volume of interest is generated from FLAIR images using thresholding feature in Fiji. This VOI is then used as mask on registered ADC map. (B) Outline of VOI overlaid on ADC image. (C) Histogram of resulting ADC values within VOI constrained to a 600–2,600 threshold, excluding cysts, hemorrhage, and necrotic tissue.
The 18F-FDG PET images were fused with the MR FLAIR images and the contrast-enhanced images using a Hermes workstation (Hermes Medical Solutions) and a mutual-information approach with the PET data resampled along the planes of the MR images. All PET and fused PET/MR images were evaluated by a pediatric neuroradiologist and a nuclear medicine physicist with experience in interpreting 18F-FDG PET of the brain. This method provided excellent results, with median errors of less than 2 mm on the fused images (22). For each patient, subjective assessment of image registration quality was based on the alignment of the cortical surface and gray matter. The 3D ROIs defined on the FLAIR and contrast-enhanced images were applied to the fused 18F-FDG PET images. The 18F-FDG PET image voxel values were normalized by the mean PET voxel value in a comparative ROI defined in normal white matter, the 18F-FDG ratio. The homogeneity of 18F-FDG uptake within the tumor as defined on MR FLAIR images was subjectively evaluated by consensus. If the 18F-FDG uptake was essentially uniform in more than 80% of the region defined by FLAIR, without notable areas of intense uptake, it was deemed homogeneous; otherwise, it was deemed heterogeneous.
Statistical Analysis
For both the MRI and the 18F-FDG PET histograms, the metrics evaluated included the number of peaks, peak skewness (symmetry of the distribution around the mean), and peak kurtosis (height and sharpness of the peak relative to remaining data). The 18F-FDG PET pixel values within the 3D tumor ROI were plotted against the ADC values for the same ROI, and their correlation was evaluated using the Pearson correlation coefficient. Cox proportional-hazards models were used to investigate associations of 18F-FDG PET and ADC histogram metrics with PFS and OS. Each child was followed for up to 3 y from the time of trial enrollment. PFS was measured from the treatment start date to either the date of progression or the date of death from any cause, whichever was earlier. Progression was determined at the local site and defined as any of the following: worsening neurologic status or increased steroid requirements unexplained by causes other than tumor progression, a more than 25% increase in MRI tumor bidimensional measurement, the appearance of a new lesion, or an increasing dexamethasone requirement to maintain stable neurologic status or imaging. OS was measured from the treatment start date until the date of death. Patients who did not experience an event for PFS or OS were censored at their last follow-up date. The P values were not adjusted for multiplicity, and the results were considered within the hypothesis-generating context. For primary variables of interest, such as correlation between ADC and PET FLAIR, PET FLAIR skewness, and kurtosis, the sample size was 33. Some datasets could not undergo a specific analysis. Namely, between ADC and PET FLAIR skewness and kurtosis, the sample size was 25.
RESULTS
Thirty-three children (25 girls and 8 boys) underwent baseline brain 18F-FDG PET and MRI within 2 wk of each other. The age range of the patients was 3.7–18.8 y (median, 7.6 y). Two children were enrolled in PBTC-006, 15 in PBTC-007, 11 in PBTC-014, and 5 in PBTC-021 (Table 1). In each PBTC trial, PFS and OS were similar and overall poor. There was no evidence that the subset of children for any of the 4 trials was biased with respect to PFS or OS distribution.
Patient Demographics
18F-FDG PET histograms were almost always unimodal (94%, vs. 6% bimodal). Although none of the 18F-FDG PET histogram parameters (skewness or kurtosis) had a significant association with PFS, the 18F-FDG PET histogram of the enhancing portion of the tumor had a higher skewness, with a tendency toward a less favorable PFS distribution (hazard ratio, 3.48; 95% confidence interval [CI], 0.75–16.28 [P = 0.11]). The skewness and kurtosis of the 18F-FDG PET histogram of the tumor as defined on FLAIR was not significantly associated with OS or PFS. In 21 of the 33 patients, 18F-FDG uptake was deemed heterogeneous; in 12 patients it was homogeneous. In 29 of the 33 patients, the 18F-FDG pattern was similar to that on FLAIR.
There was a significant association between the MR ADC histogram of the enhancing portion of the tumor and PFS, with higher skewness being significantly associated with a shorter PFS (hazard ratio, 2.56; 95% CI, 1.11–5.91 [P = 0.028]). Further, there was the suggestion of shorter OS (hazard ratio, 2.18; 95% CI, 0.95–5.04 [P = 0.067]). When the MR ADC histogram of the enhancing portion of the tumor had higher kurtosis, there was a tendency toward shorter PFS (hazard ratio, 1.30; 95% CI, 0.98–1.74 [P = 0.073]).
For all but 3 patients, the 18F-FDG PET and MR ADC histogram pixel values were negatively correlated using the Pearson correlation coefficient (Fig. 2), ranging from −0.61 to 0.15, with a median correlation of −0.44. The correlation between the 18F-FDG PET pixel values within the 3D tumor ROI and the MR ADC values for the same ROI was significantly associated with PFS (Fig. 3); tumors with no correlation between 18F-FDG PET and ADC histogram pixel values had a more favorable PFS (hazard ratio, 0.17; 95% CI, 0.03–0.89 [P = 0.036]). A stronger negative correlation between these values suggested a less favorable PFS distribution. No such association was detected for OS.

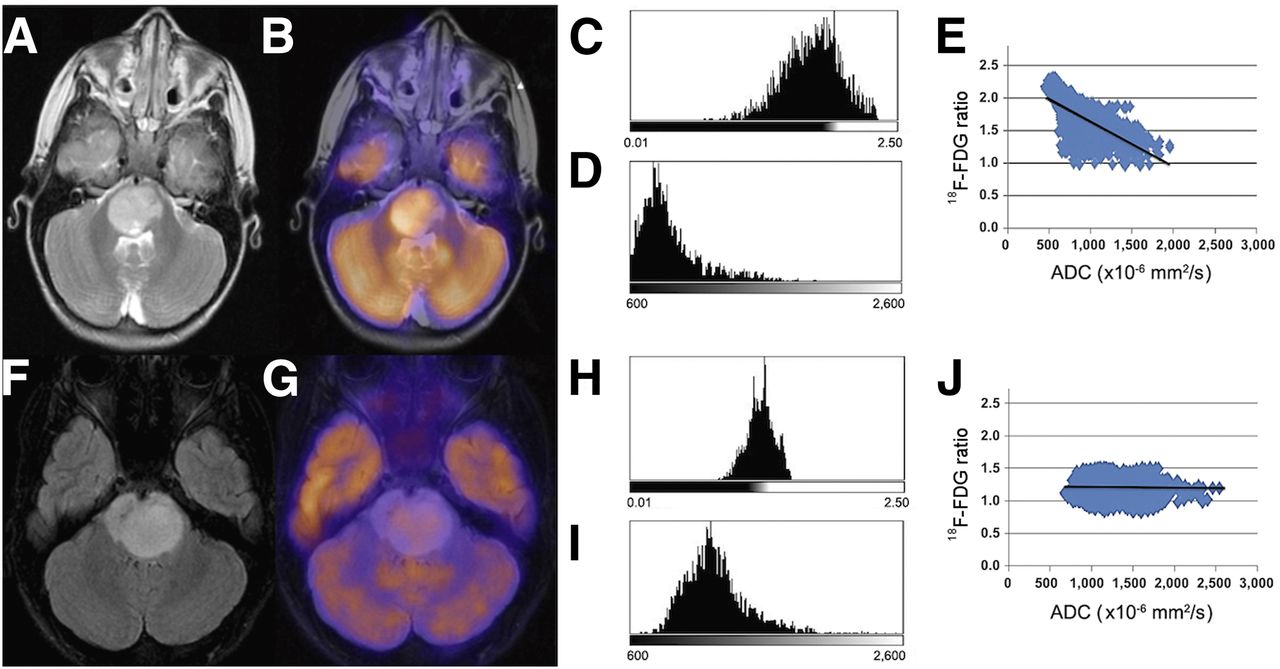
Two representative patients showing high and low negative Pearson correlation between 18F-FDG uptake and ADC. (A–D) T2-weighted MR image (A) and fused 18F-FDG PET/T2-weighted MR image (B) generated on Hermes workstation, with corresponding PET (C) and ADC (D) histograms for tumor, which demonstrate high 18F-FDG uptake and low ADC. (E) Corresponding scatterplot of 18F-FDG uptake ratio vs. ADC, with Pearson correlation coefficient of −0.6133. PFS was 60 d. (F–I) FLAIR MR image (F) and fused PET/FLAIR MR image (G) showing characteristics very different from those of first patient, with lower uptake on PET histogram (H) and higher ADC histogram (I). (J) Corresponding scatterplot of 18F-FDG ratio vs. ADC, with Pearson correlation coefficient of −0.0225. PFS was higher, at 370 d. 18F-FDG ratio refers to 18F-FDG PET image voxel values normalized by mean PET voxel value in comparative ROI defined in normal white matter.
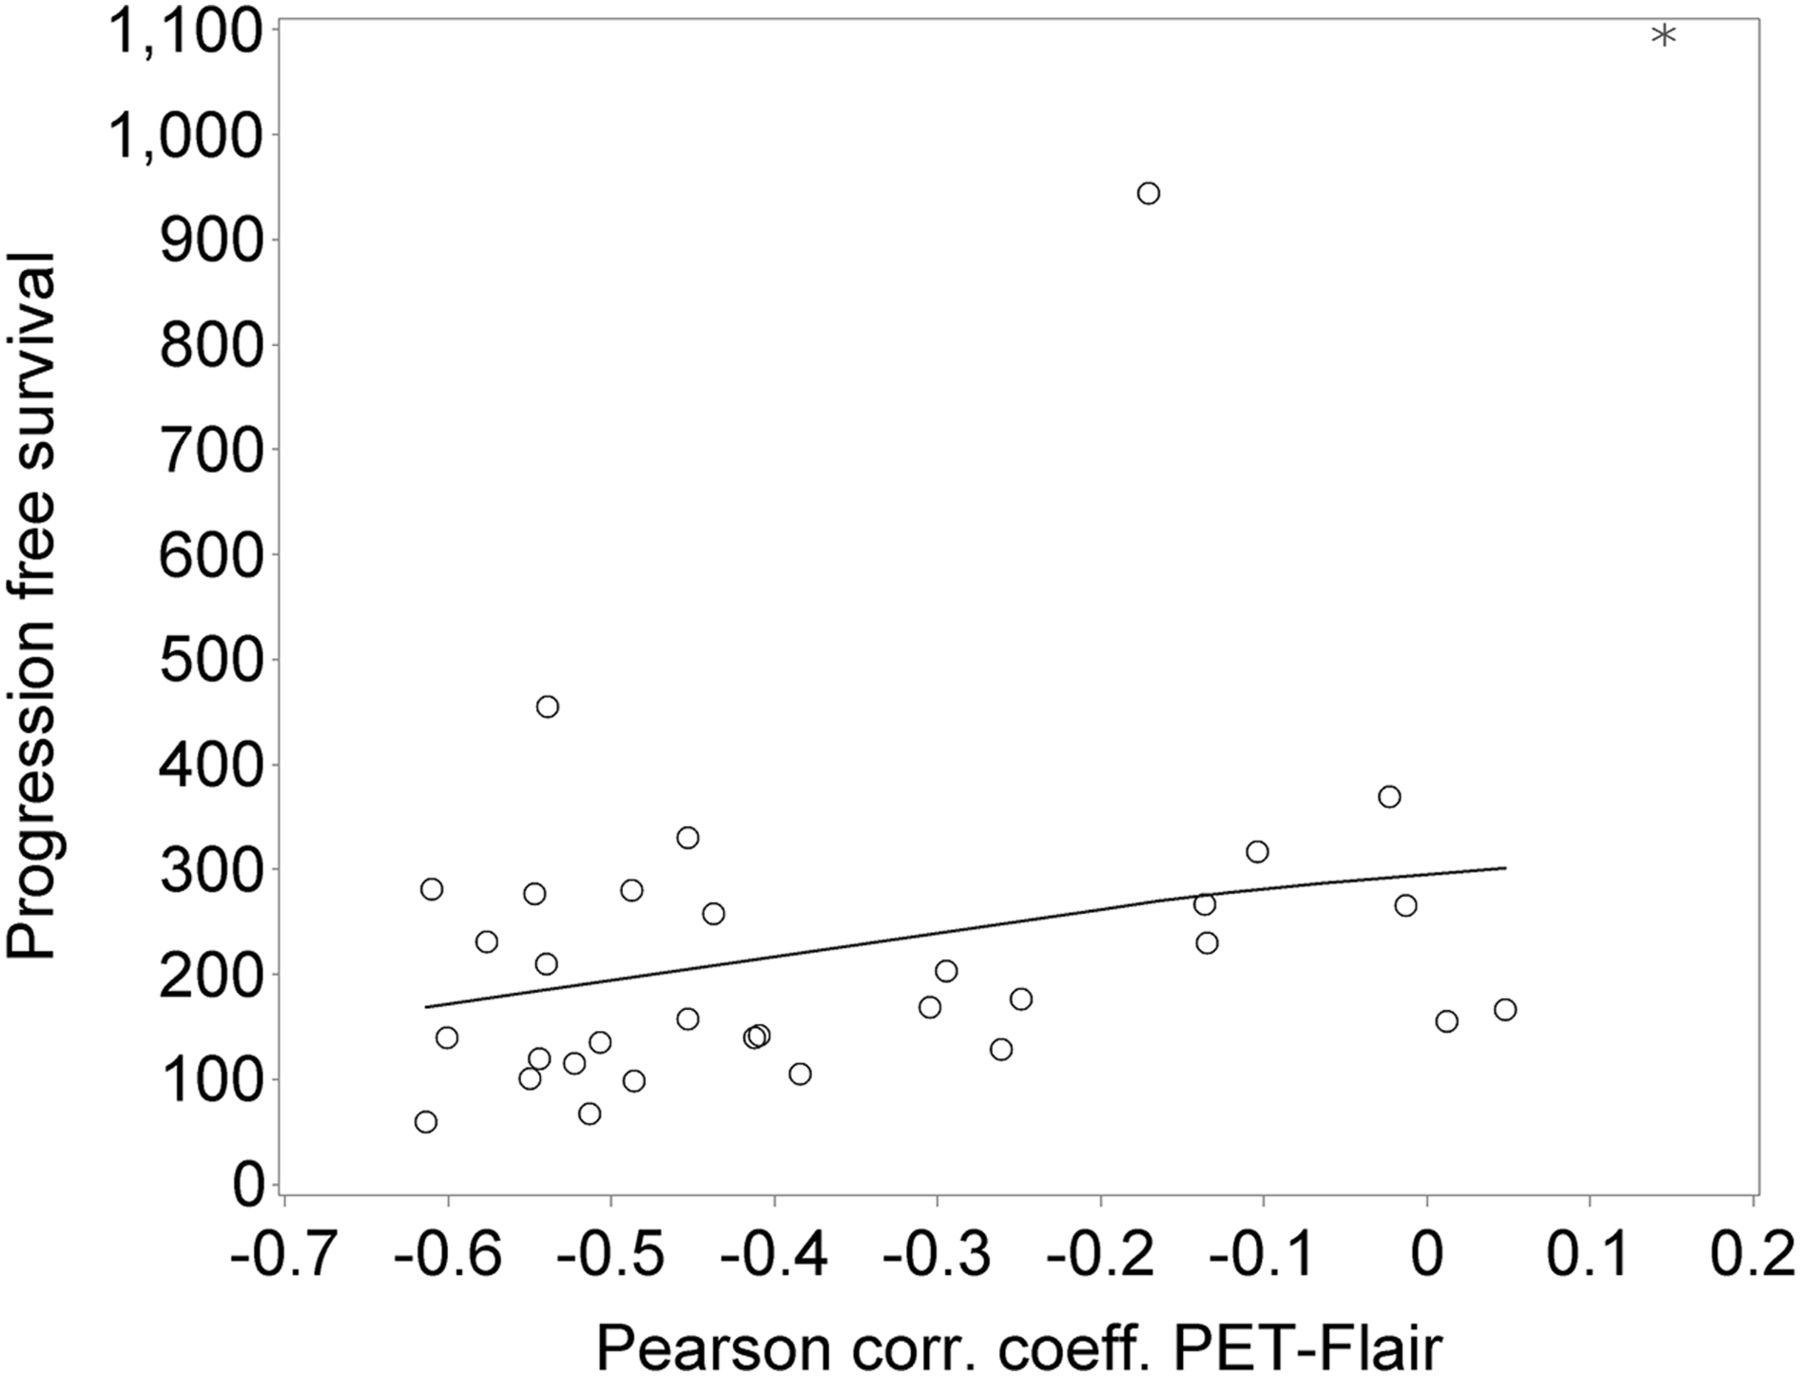
PFS plotted against PET/FLAIR ADC Pearson correlation coefficient (neuroimaging metric of interest). Patients with correlation coefficients that were more negative had lower PFS, with hazard ratio of 0.17 (95% CI, 0.03–0.89) (P = 0.036). There was no such correlation for OS. Asterisk is single nonprogression patient; circles are patients with progression; solid line is spline smoothing line to illustrate direction of association.
DISCUSSION
Tissue sampling is typically the mainstay for making an accurate oncologic diagnosis; however, for children with DIPG, tissue sampling is difficult because of tumor location. Although biopsy of DIPG is becoming more common, imaging continues to play a central role in the evaluation of these children. Standard MRI has been used to anatomically define tumor extent and therapy response. Over the last few decades, MRI techniques such as diffusion imaging have been developed to study the diffusion of water in order to assess tumor cellularity and response to treatment.
Diffusion is restricted when boundaries in tissue prevent water molecules from freely moving, possibly as a function of cell size, cell density, or cell membrane orientation (23–26). There is an increasing understanding of the relationship between tissue structure, advanced MRI techniques, and intratumoral heterogeneity at baseline and after treatment. Löbel et al. postulated that focal DIPG anaplasia was associated with sites of low ADC (7), and Steffen-Smith et al. found that DIPG patients on treatment had intratumoral differences on diffusion tensor histogram analyses (27). Ultimately, it has been concluded that precise registration between ADC maps and anatomic slices is needed if imaging findings are to be validated histologically without edema, necrosis, or cystic changes, which can overwhelm the ADC decrease from cell proliferation (28).
One method to evaluate volumetric tumor diffusion characteristics is the use of ADC histogram metrics. Several studies have evaluated ADC histograms in brain tumors. Bull et al. found that ADC histograms could be used to discriminate between pediatric brain tumor types (29), and Rodriguez Gutierrez et al. found that ADC histogram features could provide a tool for classifying pediatric posterior fossa tumors (30). Studies in adults have suggested that changes in ADC histogram metrics may predict therapy response (31–33). It has been reported that DIPGs with a lower ADC (restricted diffusion) are associated with shorter survival (34). We found that increased skewness of the ADC histogram for the enhancing portion of the tumor was significantly associated with a shorter PFS (hazard ratio, 2.56; 95% CI, 1.11–5.91 [P = 0.028]), and there was the suggestion that this led to shorter OS (hazard ratio, 2.18; 95% CI, 0.95–5.04 [P = 0.067]). We found that the ADC histogram of the enhancing portion of the tumor had a higher kurtosis with a tendency toward shorter PFS (hazard ratio, 1.30; 95% CI, 0.98–1.74 [P = 0.073]). These findings suggest that when the enhancing portion of DIPG has decreased ADC (restricted diffusion), this reflects increased cellularity and more aggressive elements.
Functional imaging with 18F-FDG PET provides complementary information by identifying metabolically active disease. Papers have shown that the intensity of 18F-FDG uptake is associated with tumor grade and survival (10–14). Kwon et al. found that hypermetabolic tumors were more likely to be glioblastoma than were tumors with little or no 18F-FDG uptake, which were anaplastic or low-grade astrocytomas (14). Pirotte et al. found that brain stem gliomas with high 18F-FDG uptake were associated with a shorter survival than were brain stem gliomas with absence of or moderate 18F-FDG uptake (35). Our results show that 18F-FDG PET histograms are almost always unimodal (94%, vs. 6% bimodal). ADC histograms are more commonly bimodal (9), strengthening the argument that ADC and 18F-FDG PET histogram metrics may provide uniquely different information. Further, it suggests that there may be an underlying homogeneity in cell density and 18F-FDG uptake. Although neither of the 18F-FDG PET histogram parameters (skewness or kurtosis) had a significant association with PFS, when the 18F-FDG PET histogram of the enhancing portion of the tumor had a higher skewness, there was a tendency toward a less favorable PFS distribution (hazard ratio, 3.48; 95% CI, 0.75–16.28 [P = 0.11]). This may suggest that the enhancing portion of the tumor has greater cellularity, more uniform 18F-FDG uptake, and therefore shorter PFS.
For all but 3 patients, the 18F-FDG PET and corresponding ADC histogram values were negatively correlated using the Pearson correlation coefficient. Also, the correlation coefficient between the 18F-FDG PET pixel values and the ADC values within the same 3D tumor ROI was significantly associated with PFS. Specifically, tumors with no correlation between the 18F-FDG PET and ADC pixel values had a more favorable PFS (hazard ratio, 0.17; 95% CI, 0.03–0.89 [P = 0.036]). A stronger negative correlation suggested a less favorable PFS distribution. Although the histologic milieu in children with a DIPG is unknown without a biopsy, these findings may imply that increased tumor cellularity, a greater number of viable cells throughout the tumor, and the presence of higher-grade elements within the tumor are all contributing factors to shorter PFS. Subsequent studies with more patients may provide additional insight and be helpful to assess the relative difference between baseline and follow-up 18F-FDG PET histogram metrics in the evaluation of children with DIPG. With genomic analyses of DIPG from biopsies improving knowledge of associated mutations (such as K27M–H3.1 mutations) (36–38), ADC (39) and PET histogram analyses may be incorporated into future prospective DIPG treatment protocols.
There were limitations in this study, specifically the small sample size and heterogeneous treatments, although outcome was poor and did not significantly differ according to treatment regimen. Also, the evaluation of maximum 18F-FDG uptake by such parameters as SUVmax or SUVpeak may have been limited in small or heterogeneous lesions. The limited spatial resolution in PET can lead to spread of the signal over a larger region, yielding a loss in contrast. However, in most cases, the tumors were 3 cm or larger, mitigating this effect.
CONCLUSION
As parameterized by histogram metrics in DIPG, there are differences between baseline 18F-FDG PET and MR ADC voxel characteristics, with often a negative correlation between the 18F-FDG PET pixel values within the 3D tumor ROI and the ADC values for the same ROI. A stronger negative correlation is associated with a worse PFS and may indicate higher-grade histologic components within the tumor. As knowledge of the associated genetic mutations associated with DIPG increases, PET and MRI/genomic analyses may provide additional valuable information.
DISCLOSURE
This work was supported by NIH grant U01 CA81457 for the PBTC, the PBTC Foundation, the Pediatric Brain Tumor Foundation of the United States, and American Lebanese Syrian Associated Charities. No other potential conflict of interest relevant to this article was reported.
Acknowledgments
We acknowledge the site PET and MR physicians, technologists, physicists, and support staff from all of the PBTC institutions.
Footnotes
Published online Mar. 30, 2017.
- © 2017 by the Society of Nuclear Medicine and Molecular Imaging.
REFERENCES
- Received for publication October 12, 2016.
- Accepted for publication February 26, 2017.


Jump to section
Related Articles
Cited By...
- MR Imaging Correlates for Molecular and Mutational Analyses in Children with Diffuse Intrinsic Pontine Glioma
- Advanced ADC Histogram, Perfusion, and Permeability Metrics Show an Association with Survival and Pseudoprogression in Newly Diagnosed Diffuse Intrinsic Pontine Glioma: A Report from the Pediatric Brain Tumor Consortium
- Evaluation of 11C-Methionine PET and Anatomic MRI Associations in Diffuse Intrinsic Pontine Glioma
- Role of the Apparent Diffusion Coefficient as a Predictor of Tumor Progression in Patients with Chordoma
- MRI and PET: Noninvasive Tools to Probe the Biology of Diffuse Intrinsic Pontine Glioma