


Abstract
PET radioligand binding to the 18-kD translocator protein (TSPO) in the brains of patients with multiple sclerosis (MS) primarily reflects activated microglia and macrophages. We previously developed genetic stratification for accurate quantitative estimation of TSPO using second-generation PET radioligands. In this study, we used 18F-PBR111 PET and MR imaging to measure relative binding in the lesional, perilesional, and surrounding normal-appearing white matter of MS patients, as an index of the innate immune response. Methods: 18F-PBR111 binding was quantified in 11 MS patients and 11 age-matched healthy volunteers, stratified according to the rs6971 TSPO gene polymorphism. Fluid-attenuated inversion recovery and magnetization transfer ratio (MTR) MR imaging were used to segment the white matter in MS patients as lesions, perilesional volumes, nonlesional white matter with reduced MTR, and nonlesional white matter with normal MTR. Results: 18F-PBR111 binding was higher in the white matter lesions and perilesional volumes of MS patients than in white matter of healthy controls (P < 0.05). Although there was substantial heterogeneity in binding between different lesions, a within-subject analysis showed higher 18F-PBR111 binding in MS lesions (P < 0.05) and in perilesional (P < 0.05) and nonlesional white matter with reduced MTR (P < 0.005) than in nonlesional white matter with a normal MTR. A positive correlation was observed between the mean 18F-PBR111 volume of distribution increase in lesions relative to nonlesional white matter with a normal MTR and the MS severity score (Spearman ρ = 0.62, P < 0.05). Conclusion: This study demonstrates that quantitative TSPO PET with a second-generation radioligand can be used to characterize innate immune responses in MS in vivo and provides further evidence supporting an association between the white matter TSPO PET signal in lesions and disease severity. Our approach is practical for extension to studies of the role of the innate immune response in MS for differentiation of antiinflammatory effects of new medicines and their longer term impact on clinical outcome.
A prominent neuropathologic feature of multiple sclerosis (MS) is the activation of microglia, resident brain innate immune response cells, in the white matter (WM), particularly within demyelinating lesions but also extending into adjacent WM tissue (1–4).
MR imaging markers specifically associated with microglial and macrophage activation are limited. Correlational postmortem neuropathology and MR imaging in MS have confirmed that T1-weighted gadolinium contrast enhancement and associated T2-weighted hyperintensity changes in WM reflect the adaptive immune response but do not specifically inform on relative macrophage or microglial involvement (5). T2-weighted WM hyperintensities also are nonspecifically associated with other pathologic features including demyelination, axonal loss, and astrogliosis (6). A recent study found that subtle reductions in the MR imaging magnetization transfer ratio (MTR) in perilesional WM volumes are associated with increased microglia density (7). However, decreases in MTR reflect other changes in tissue microstructure, such as demyelination, as well and do not provide specific biomarker for innate immune activation.
PET radioligand binding to the 18-kD translocator protein (TSPO) in the brains of patients with MS primarily reflects activated microglia and macrophages (8,9). However, the interpretation of the findings of early studies, using the first-generation PET tracer 11C-(R)-PK11195, is limited by the rather poor signal-to-noise ratio for this tracer and nonspecific binding, which challenge accurate quantitation of the signal (8,10–12).
Several second-generation TSPO PET radioligands with improved signal-to-noise ratio relative to 11C-(R)-PK11195 have been developed (13). Unexpectedly, the first 2 studies using newer TSPO radioligands did not report increases in WM binding of MS patients relative to healthy controls (14,15). However, the analyses did not take into consideration the population variation in binding of radioligands associated with the rs6971 TSPO gene single nucleotide polymorphism (SNP) (16). The heterogeneity of binding across carriers of different alleles may have contributed to the failure to differentiate brain TSPO radioligand binding between MS patients and healthy controls successfully.
18F-PBR111 is a second-generation TSPO ligand with promising imaging characteristics (17). A recent study showed increased 18F-PBR111 uptake corresponding specifically to activated microglia in experimental autoimmune encephalomyelitis (18). We have developed a robust approach for quantitative in vivo assessment of specific 18F-PBR111 binding to TSPO (19).
Here, we have used 18F-PBR111 PET coregistered with MR imaging to evaluate regional binding to WM in healthy volunteers and in MS patients who were stratified genetically according to the rs6971 SNP. On the basis of postmortem descriptions of activated microglia and macrophage distributions (1,7,20), we predicted increased 18F-PBR111 binding in regions of T2 hyperintense lesions, in the immediate perilesional volumes, and in nonlesional volumes with reduced MTR, compared with that in the WM of healthy volunteers and WM with a normal MTR (normal appearing) in MS patients. The reproducibility of 18F-PBR111 signal also was assessed in 5 subjects (4 healthy volunteers and 1 MS patient).
MATERIALS AND METHODS
Study Design
This was an open-label study in patients with relapsing-remitting MS and age-matched healthy volunteers (n = 11 per group; the supplemental data provide details [supplemental materials are available at http://jnm.snmjournals.org]). All subjects were genotyped for the rs6971 SNP, which determines variations in affinity between subjects (who express either a high affinity [HAB] or low affinity [LAB] or coexpression of both binding states [MAB]) for second-generation TSPO radioligands (16). Patients with MS and healthy volunteers were matched for the rs6971 SNP (Supplemental Table 1).
Each participant underwent an MR imaging scan and an 18F-PBR111 PET scan on the same day. Four healthy volunteers and 1 MS patient (all HABs) underwent a second 18F-PBR111 PET scan on the following day to evaluate the reproducibility of the PET signal.
Disability was assessed by an experienced consultant neurologist using the expanded disability status scale. The MS severity score (MSSS) was calculated using expanded disability status scale scores and disease duration according to Roxburgh et al. (21).
Imaging Methods
Details on radioligand synthesis, PET protocol, and MR imaging protocol are described in the supplemental data.
18F-PBR111 was injected as an intravenous bolus over approximately 20 s and PET emission data collected in 3-dimensional mode for 120 min after injection. The injected activity was similar in healthy volunteers and MS patients (164.6 MBq ± 9 and 169.7 MBq ± 12.4 [mean ± SD], respectively).
Definition of Volumes of Interest (VOIs)
The definition of the whole WM and T2 fluid-attenuated inversion recovery (FLAIR) hyperintense WM volumes is described in detail in the supplemental methods.
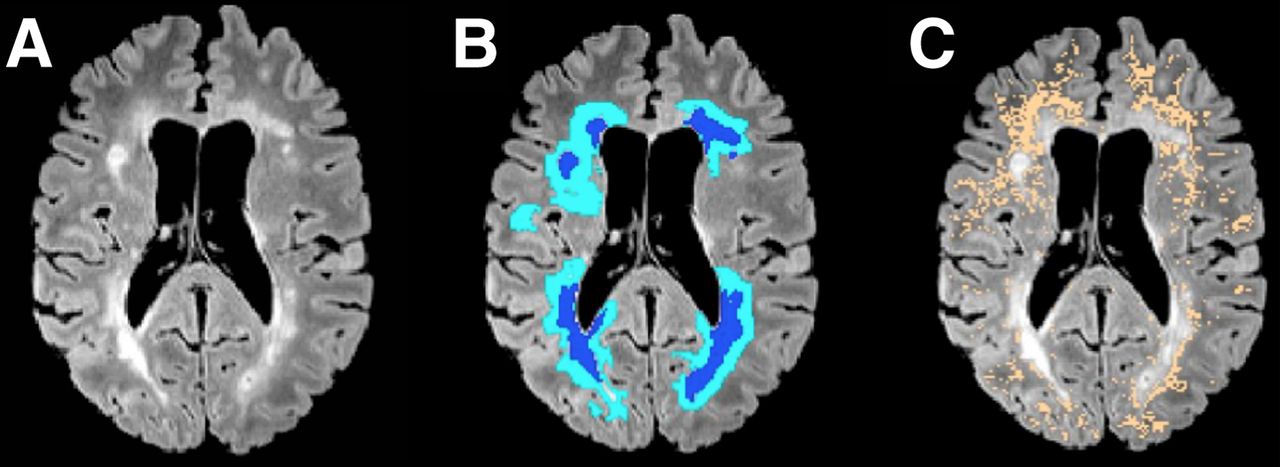
The remaining WM in the MS patients (remaining after exclusion of the T2 FLAIR hyperintense lesions) was further segmented to 3 VOIs as follows: perilesional volumes, including voxels within a 6-mm-thick volume disposed around T2 hyperintense lesions (Figs. 1A and 1B); nonlesional low MTR (NLLM) voxels, with MTR ranging between 90% and 98% of the nonlesional mean WM MTR (7) (Fig. 1C); and nonlesional high MTR (NLHM) voxels, showing an MTR of 98% or greater of the nonlesional mean WM MTR (7). The NLHM VOI was assumed to be representative of the normal WM tissue.

(A) T2 FLAIR image of representative MS patient (patient 1, Supplemental Table 1). Hyperintense areas correspond to demyelinating lesions. (B) Lesion (dark blue) and perilesional areas (light blue) corresponding to intersection of 6-mm-diameter sphere traced around lesions within image plane. (C) Nonlesional voxels with MTR values ranging between 90% and 98% of mean MTR of nonlesional WM tissue (NLLM) (copper).
PET Quantification
Dynamic PET data were corrected for motion via frame-to-frame image registration and aligned with the individual’s structural T1 MR image using SPM5 (Wellcome Trust Center for Neuroimaging, http://www.fil.ion.ucl.ac.uk/spm) with a mutual information cost function.
A 2-tissue-compartment kinetic model with a metabolite-corrected plasma input function was applied to the dynamic PET data using a fixed blood volume correction of 5% (19). For each VOI examined, the total volume of distribution (VT) was estimated from the rate constants as described previously (22). The Logan graphical method (23) using a plasma input, with a fixed blood volume correction of 5% and a linear start time at 35 min, was also used to estimate the VT of each VOI and further applied at the voxel level to produce parametric VT maps. Model fitting and parameter estimation were performed using software implemented in Matlab R2008b (The MathWorks Inc.).
Summary of Statistics
We expressed 18F-PBR111 VT for the whole WM as  . For each subject, the mean 18F-PBR111 VT uptake of all lesions larger than 100 voxels (
 ) and perilesional volumes
  , respectively, was computed. The uptake of 18F-PBR111 in NLLM and NLHM was expressed as
  and
and  , respectively. We used nonparametric statistic analysis with contrasts of
  in healthy controls to each of the MS patients’ regions of interest (
 ). Similarly we used nonparametric tests for the contrasts within MS patients (
 were separately compared with
  ). Details of the statistical analyses are presented in the supplemental methods. The relative increase (Δ) in 18F-PBR111 uptake in lesions, perilesional, and NLLM volumes versus NLHM was computed as follows:


The variability across individual lesions, within each MS patient, was expressed using the coefficient of variation (CV) in  across individual lesions, as follows:
The test–retest variability of  was studied in 4 healthy volunteers and 1 MS patient and was expressed as the absolute difference between the 2 consecutive-days scans divided by the mean of the 2 scans. For the MS patient who was studied twice in consecutive days, we assessed test–retest variability of individual
  and
and  . Additionally, we calculated the test–retest variability of individual normalized lesional and perilesional distribution volume ratio (DVR) by normalizing the corresponding VT values by
  . The DVR was computed as follows:

Details on correlational analyses are presented in the supplemental methods.
RESULTS
The demographic and clinical characteristics of study participants are presented in Supplemental Table 1. MS patients (10 women, 1 man) and healthy controls (5 women, 6 men) were matched for genotype (7 HABs, 2 MABs, and 2 LABs in each group) and had similar age distributions (healthy controls: median age, 51 y [range, 28–65 y] and MS patients: median age, 42 y [range, 28–59 y]; Wilcoxon rank P = 0.80).
Between-Subjects Contrasts
We observed a significant effect of TSPO genotype on WM binding of 18F-PBR111 over the whole population ( , HABs: median, 3.53 [range, 2.12–5.40], MABs: median, 3.00 [range, 2.50–4.43], and LABs: median, 1.47 [range, 1.18–1.70]; Kruskal–Wallis P < 0.01).
Whole WM
We saw a trend toward lower whole WM binding in healthy controls than in MS patients ( , healthy controls: median, 2.50 [range, 1.18–5.23], MS patients: median, 3.53 [range, 1.62–4.55]; Wilcoxon rank P = 0.06) (Fig. 2A; Supplemental Fig. 1). In MS patients, the
  correlated with disease duration in HABs (Fig. 2B) (Spearman ρ = 0.86; P = 0.03, corrected for age). The relationship between
  and disease duration was not assessed in the MAB and LAB groups separately, as each of these groups had only 2 subjects per group.
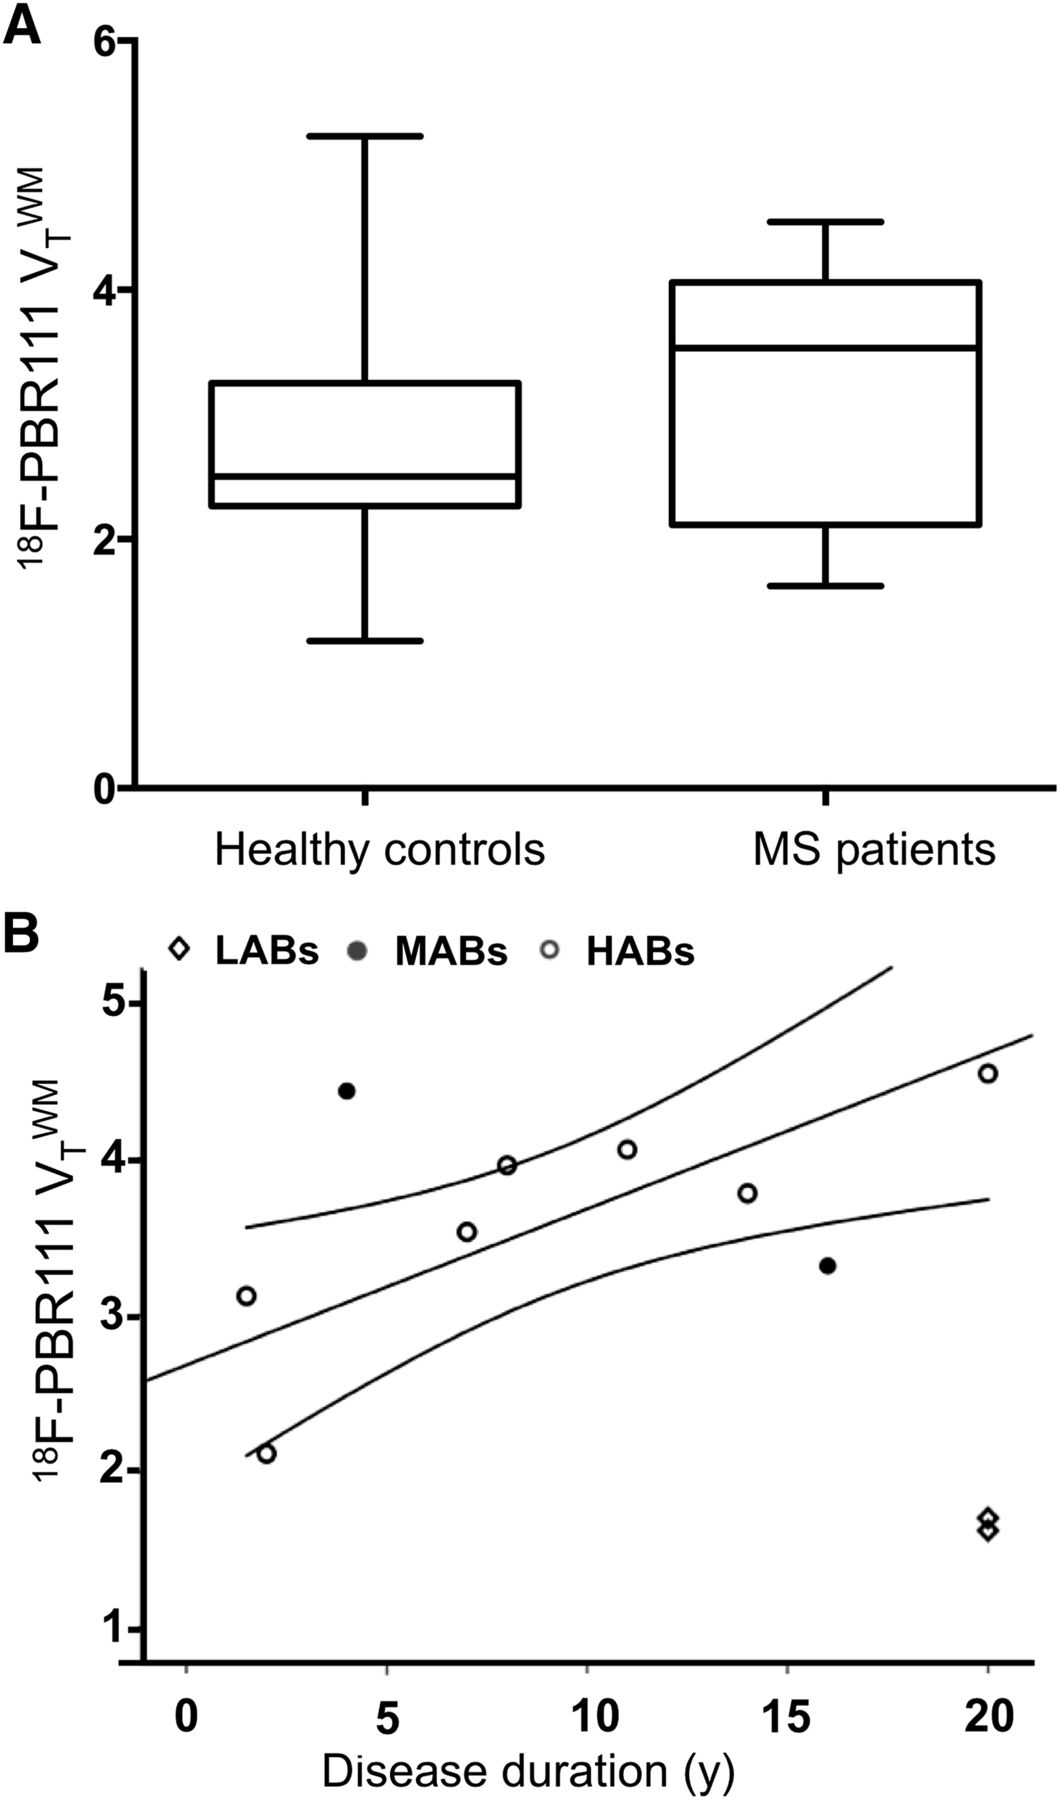
(A) 18F-PBR111 VT in whole WM of MS patients and genotype- and age-matched healthy control subjects. Lines in middle of boxes are median values, whereas hinges represent 25th and 75th percentiles, respectively. Whiskers represent maximum and minimum values. Contrast between MS patients and healthy controls showed trend for higher 18F-PBR111  in MS patients (Wilcoxon rank P = 0.062). (B) Relationship between whole WM 18F-PBR111 VT and disease duration in MS patients for patients with different rs6971 genotypes (Spearman partial correlation in HABs: ρ = 0.86; P < 0.05, corrected for age).
MR Imaging Segmentation-Based VOIs
One hundred sixty-three T2 FLAIR lesions were identified in the patients (median total lesion volume per patient, 12,708 mm3 [range, 392–32,672 mm3]). Ninety-six of 163 individual lesions were larger than 100 voxels in volume (median number of lesions larger than 100 voxels per patient, 8 mm3; range, 1–17 mm3).
Both  (median, 3.88; range, 1.44–5.50) and
  (median, 3.61; range, 1.59–4.66) were greater than the
  from healthy controls (median, 2.50; range, 1.18–5.23; Wilcoxon rank P = 0.02 and 0.03, respectively, for
  and
and  ; Fig. 3). Direct contrasts between healthy controls’
  and MS patients’
  and
and  demonstrated trends to greater binding in the patients’ VOIs (Wilcoxon rank P = 0.09 and 0.06, respectively) (Fig. 3; Supplemental Fig. 1).
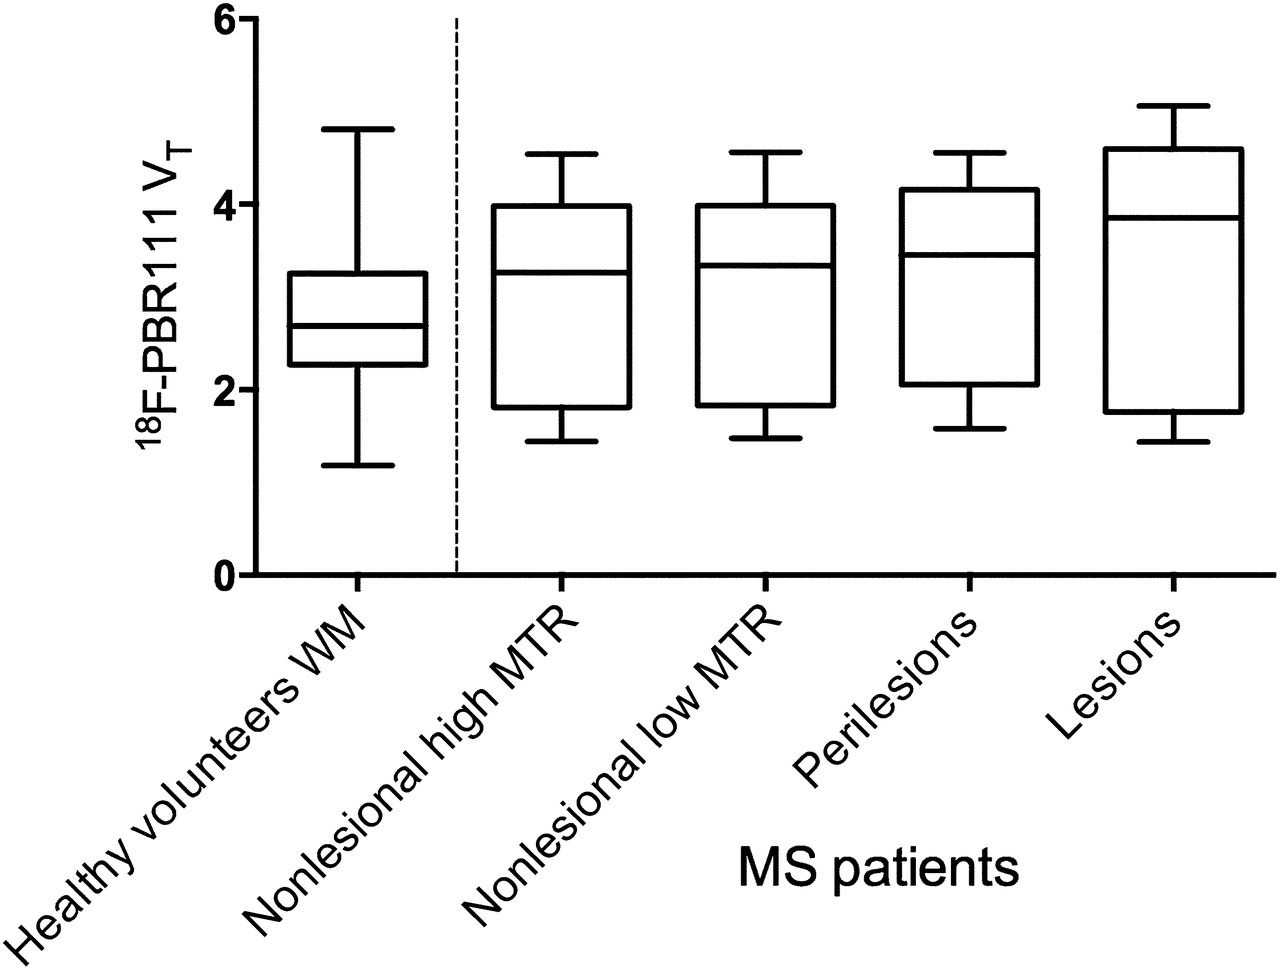
18F-PBR111 uptake in healthy volunteers and across MS patient ROIs. Lines in middle of boxes are median values, whereas hinges represent 25th and 75th percentiles, respectively. Whiskers represent maximum and minimum values. Between-group contrasts showed that MS patients’ 18F-PBR111  and
and  were greater than healthy volunteers’
  (Wilcoxon rank P < 0.05). Within–MS patient contrasts showed
  was greater than
  and
and  was greater than
  (Wilcoxon rank P < 0.05), and
  was greater than
  (Wilcoxon rank P < 0.005).
Within-Subjects Contrasts
Relative 18F-PBR111 VT values for individual lesions and perilesional volumes, and in the NLHM and NLLM voxels, are presented separately for each MS patient (Fig. 4). The median CV in  across individual lesions within the patients was 15.2% (range, 9%–25%).
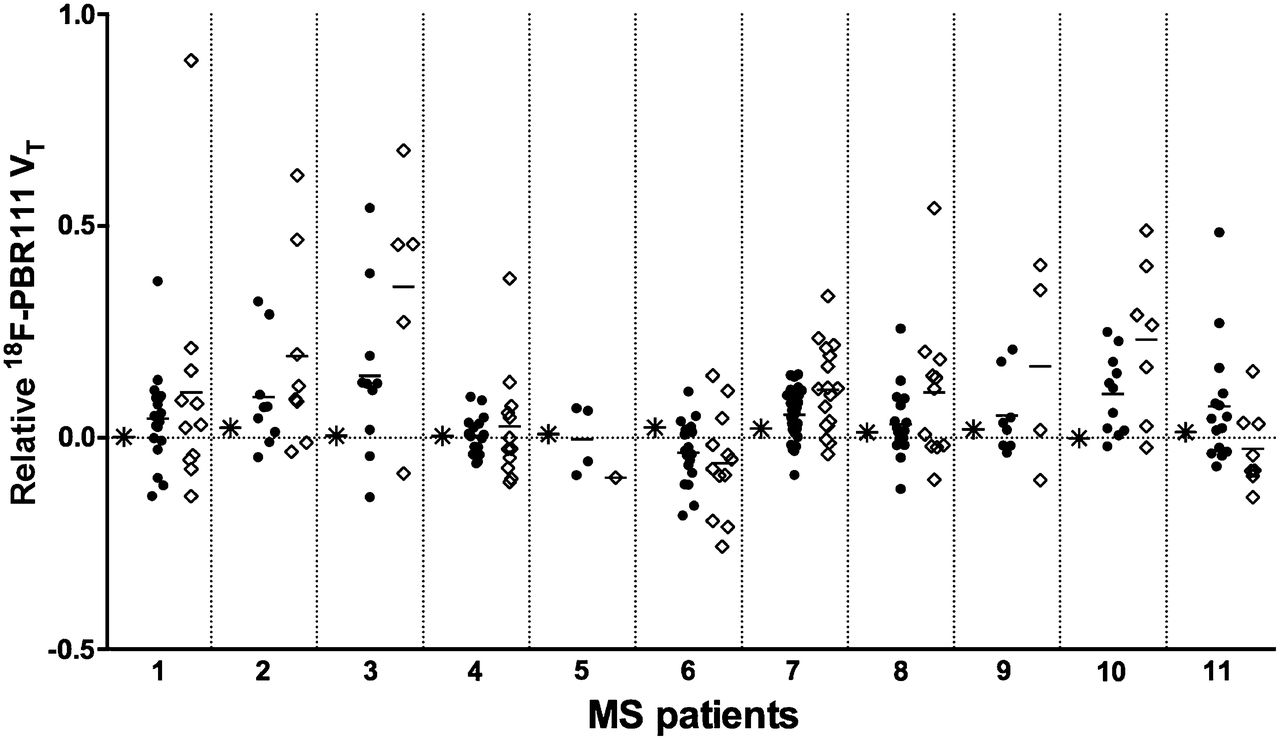
Relative 18F-PBR111 uptake (relative to NLHM WM) in NLLM WM, in individual T2 FLAIR lesions, and in perilesional volumes for MS patients studied. Ordinant represents relative difference in 18F-PBR111 VT in lesions (♢), in perilesional volumes (●), and in NLLM WM (*) relative to normal-appearing WM (NLHM WM). On abscissa, MS patients (Supplemental Table 1) are separately indicated.
We found that VT in lesional (ΔL, median, 10.7% [range, −9.5 to 35.6]; Wilcoxon rank P = 0.03), perilesional (ΔPL, median, 5.2% [range, −3.5 to 14.6]; Wilcoxon rank P = 0.01), and NLLM volumes (ΔNLLM, median, 1.2% [range, 0–2.4]; Wilcoxon rank P = 0.004) was increased relative to the VT in NLHM volumes within the MS patients. The maximum 18F-PBR111 uptake increase relative to NLHM volumes was higher in lesions (89%) than in the perilesional volumes (54%). Sixty percent of lesions and 67% of perilesional volumes had higher 18F-PBR111 VT relative to NLHM.
Figures 5A–5C overlay locally thresholded 18F-PBR111 VT increases on T2 FLAIR hyperintense volumes in 2 patients with different clinical characteristics. In a patient who had experienced high disease activity (5 relapses in the last 2 y; Supplemental Table 1, patient 9), T2 FLAIR hyperintense lesion areas correspond to areas of increased 18F-PBR111 signal. Conversely, in a patient with a more benign disease course and with no history of new neurologic symptoms reported over the past 2 y (Supplemental Table 1, patient 4), focal areas of increased radiotracer binding correspond poorly with T2 hyperintense regions of WM (Figs. 5D–5F).
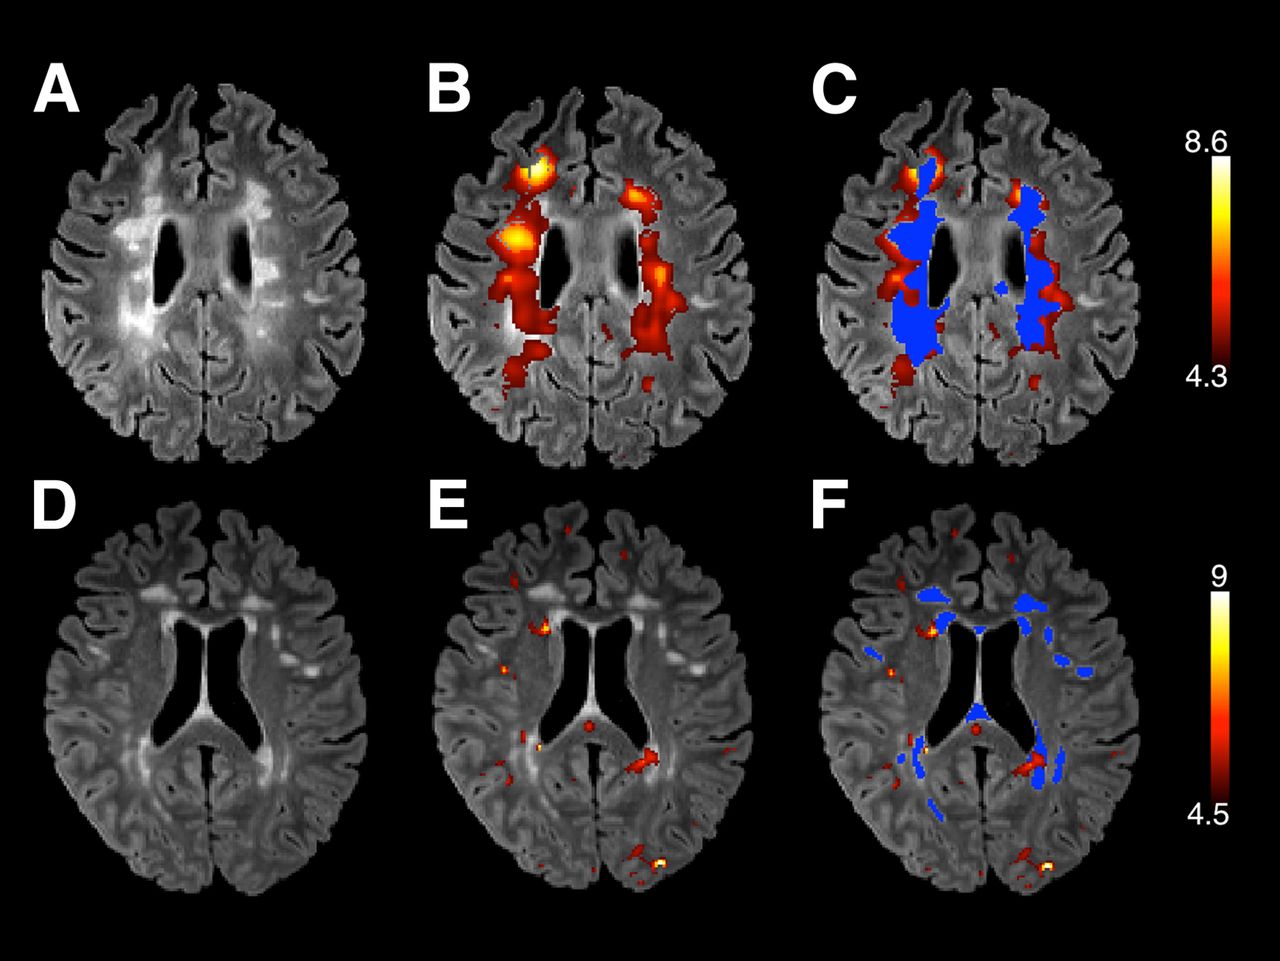
T2 FLAIR images (A and D), 18F-PBR111 VT parametric maps (B and E) overlaid (in warm colors) on T2 FLAIR images, and overlap between T2 FLAIR lesions (marked in blue) and 18F-PBR111 VT (in warm colors) (C and F) from 2 illustrative patients. Lower threshold for VT parametric maps corresponds to value of 18F-PBR111 VT in NLHM volume for each of 2 patients. Upper threshold is twice VT in NLHM. Upper row illustrates patient with recent active disease (Supplemental Table 1, patient 9). Here, T2 FLAIR hyperintense lesional areas correspond to areas of increased 18F-PBR111 signal. Lower row illustrates patient (Supplemental Table 1, patient 4) with relatively benign disease course showing focal regions of increased 18F-PBR111 VT that correspond poorly to T2 FLAIR hyperintense areas.
Disease severity, as assessed from MSSSs, correlated with the mean 18F-PBR111 VT increase in lesions for each patient (expressed relative to that in individual NLHM WM) (Spearman ρ = 0.62; P = 0.05; Fig. 6).
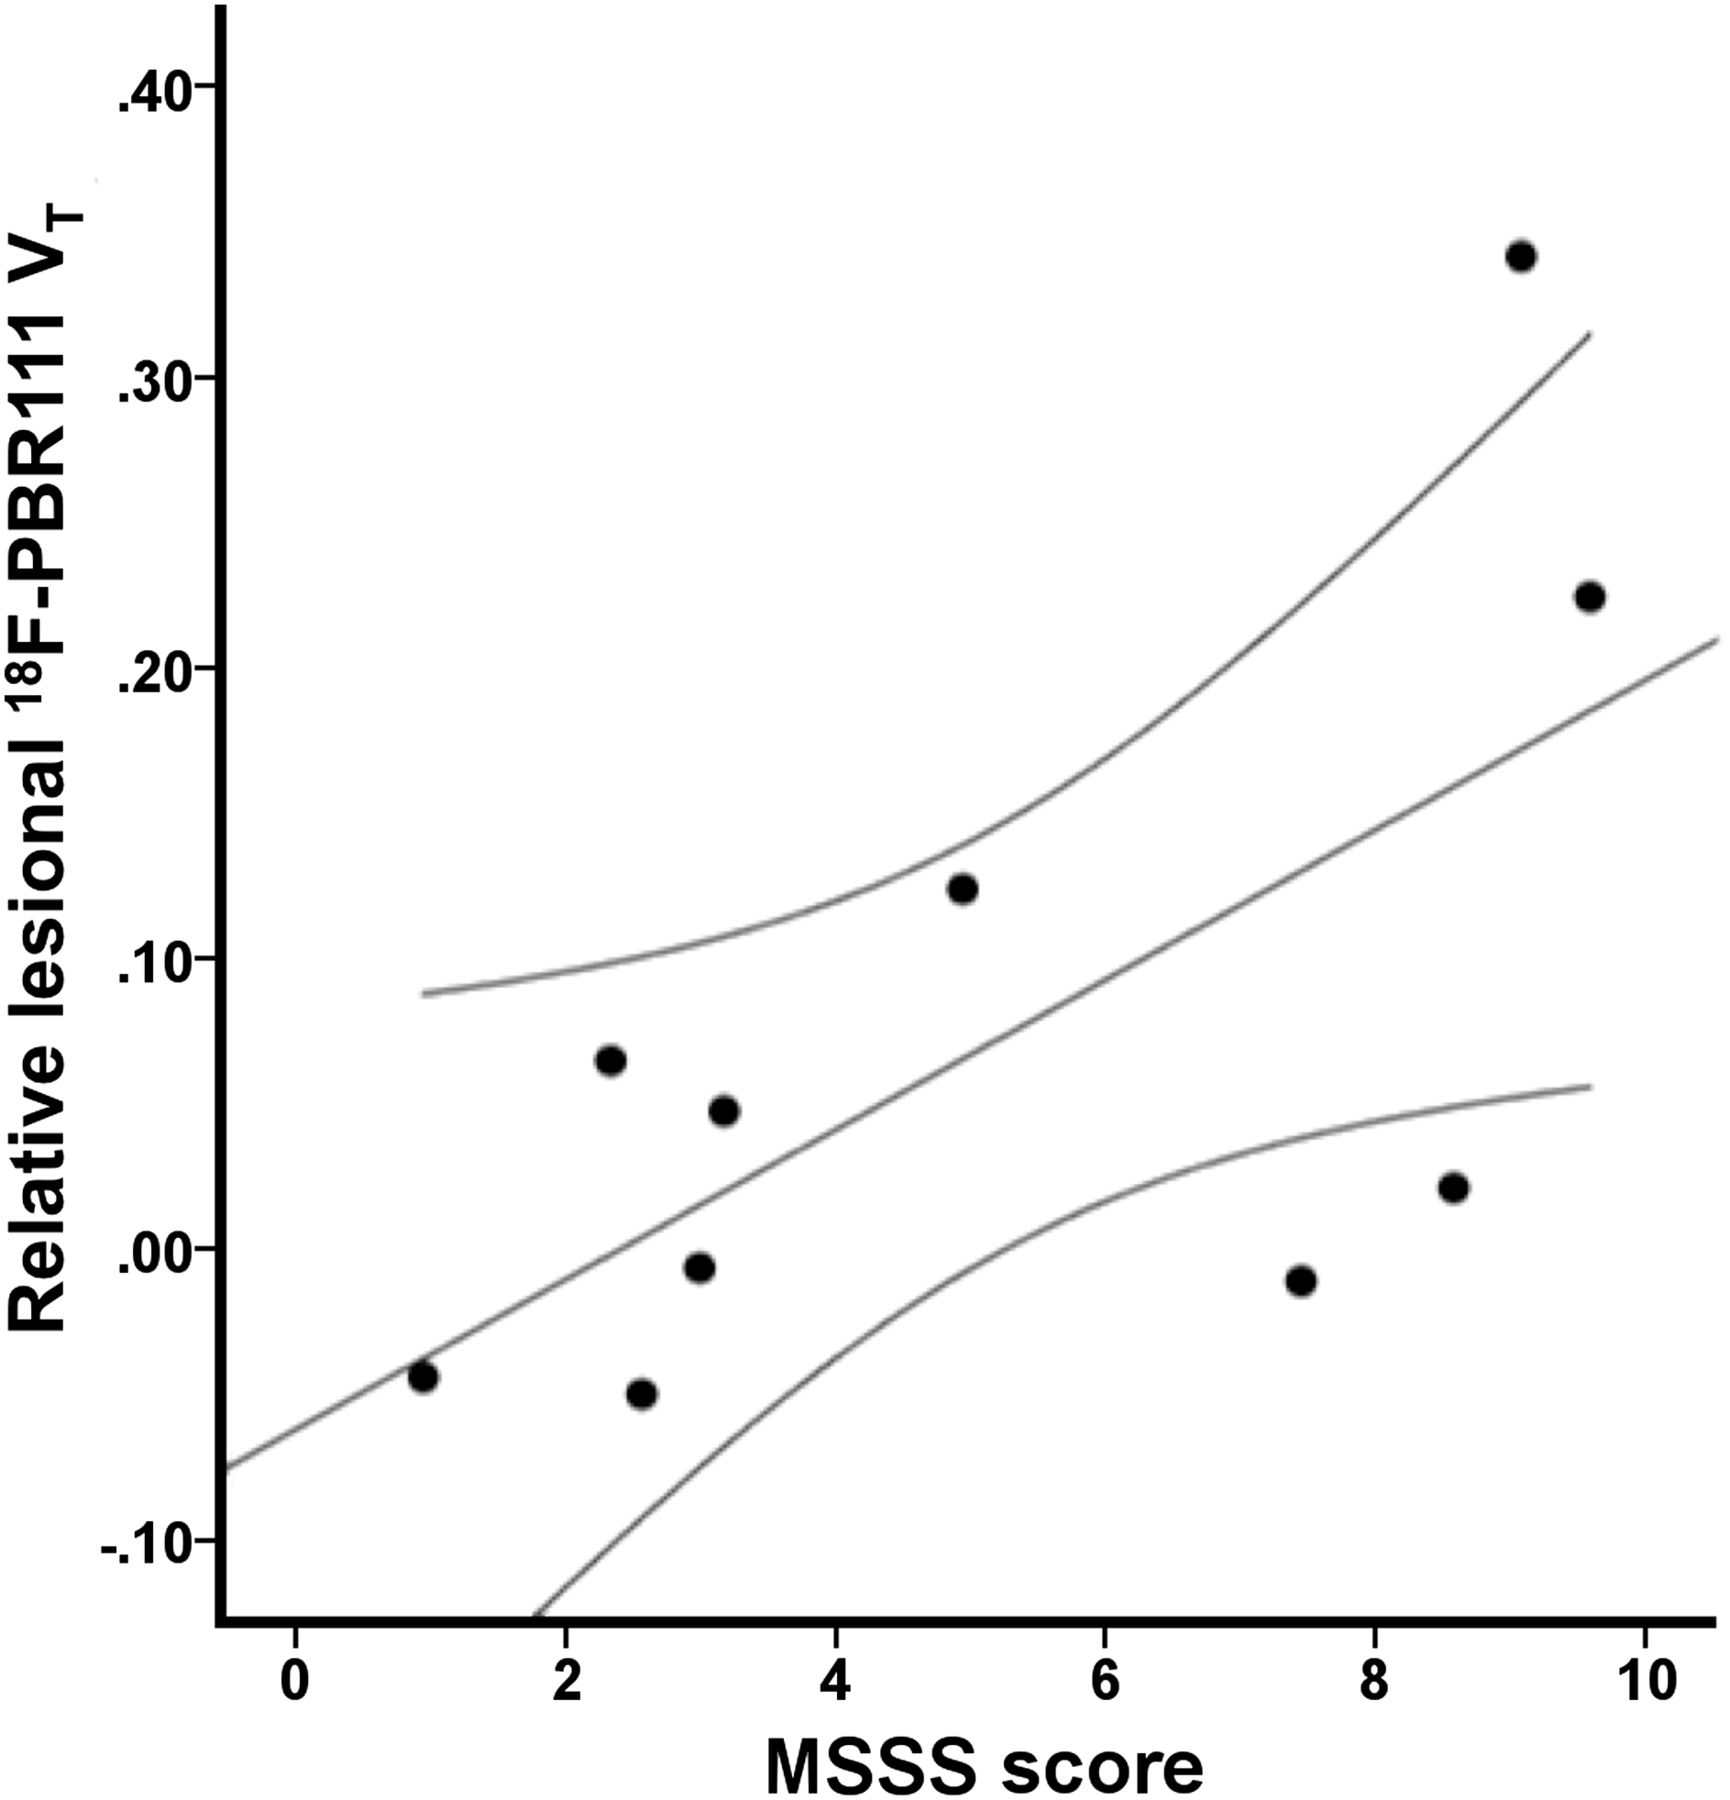
Positive relationship between MSSSs and 18F-PBR111 uptake in lesions (expressed relative to that in normal-appearing WM) (Spearman ρ = 0.62, P ≤ 0.05).
Test–Retest Reproducibility
The median test–retest variability in 18F-PBR111  across subjects (4 healthy volunteers, 1 MS patient) was 23% (range, 12%–55%). The median test–retest variabilities in 18F-PBR111
  and
and  across the 18 T2 hyperintense lesion volumes identified in the MS patient who was studied twice on consecutive days were 25% (range, 12%–57%) and 27% (range, 17%–36%), respectively, whereas the median test–retest variabilities for the normalized DVRL and DVRPL were 8% (range, 1%–31%) and 4% (range, 0%–9%), respectively.
DISCUSSION
TSPO PET can be used to assess the innate immune response in patients with MS in vivo, although methodologic and technical challenges have limited its wide application. We have illustrated how corrected, quantitative measures with a second-generation TSPO radioligand, 18F-PBR111, promise new insights concerning clinical–pathologic correlations relevant to disease progression. We found increased 18F-PBR111 VT in the WM lesional and perilesional volumes of MS patients, compared with healthy volunteers. 18F-PBR111 VT was higher in lesions and perilesional and nonlesional volumes with decreased MTR (NLLM) in MS patients relative to the normal-appearing WM of the same subjects. Moreover, relative 18F-PBR111 VT increase in the MS lesions was positively correlated with disease severity, adding to recent in vivo data consistent with a role for the innate immune response in the progression of neurodegeneration in MS (24).
Postmortem autoradiographic studies in the brains of patients with MS have consistently demonstrated that increased uptake of TSPO-targeted radioligands colocalizes with markers of activated microglia (8,11,25,26). An immunohistochemical analysis of postmortem MS brain tissue was largely consistent with these findings, suggesting that most cells expressing TSPO in acute MS lesions were macrophages or microglia (9), although it should be cautioned that antibody-based localization of the TSPO peptide and expression of the binding domain for the TSPO radioligands need not be the same. In a relapsing-remitting experimental autoimmune encephalomyelitis model (18), increased 18F-PBR111 uptake colocalizes with activated microglia and macrophages and parallels the temporal dynamics of their upregulation during experimentally induced relapses.
We observed an increased 18F-PBR111 uptake in approximately two thirds of MR imaging–defined lesions and perilesional volumes in MS patients relative to their normal-appearing WM (NLHM). Ex vivo pathology studies show that acute, active lesions are characterized by a hypercellular inflammatory core, marked by prominent lymphocyte infiltration with a high density of activated microglia and macrophages distributed evenly throughout the lesion (27). Patient 9 (Fig. 5, top) illustrates the strong colocalization of increased 18F-PBR111 VT with T2 hyperintense lesions in active disease. In chronic active lesions, microglia are increased relative to distant normal WM tissue and are more concentrated at the lesion edge than within the lesion. The hypercellular margin, characterized by a high density of activated microglia surrounding demyelinating plaques, is a consistent finding across neuropathologic studies (2,28,29).
By contrast, approximately one third of the MR imaging–defined lesions and perilesional volumes were associated with 18F-PBR111 uptake similar to, or lower than, that of the normal-appearing NLHM WM. Patient 4 (Fig. 5, bottom) is an illustrative example of poor correspondence between areas of increased 18F-PBR111 VT and T2 FLAIR hyperintensities. We speculate that these volumes represent chronic inactive lesions that are hypocellular or have enlarged extracellular spaces leading to a relatively low density of all cells, including microglia. Our findings of regional variation thus are consistent with postmortem pathology observations in MS patients.
The median within-subject CV in lesional 18F-PBR111 uptake was above 15%. This finding indicates a moderately high variability of the observed 18F-PBR111 signal between the T2 hyperintense lesions even within a single MS patient and further highlights that T2 hyperintense MR imaging contrast change reflects a wide range of neuropathology in MS lesions nonspecifically (30).
An elegant study by Moll et al. (7), using combined postmortem pathology and MR imaging, reported that regions appearing normal on T2-weighted MR, but displaying reduced MTR, were associated with microglial activation and axonal degeneration. By applying the same image segmentation approach as Moll et al., we observed a consistently increased 18F-PBR111 uptake in regions with reduced MTR (NLLM) across our study group.
Focal areas of activated microglia identified neuropathologically in WM areas without apparent loss of myelin (1,2) may represent areas at risk for the development of acute inflammatory lesions. They have been described previously as preactive lesions (5) or regions of chronic microglial activation that may contribute independently to progressive neurodegeneration (31). Alternatively, WM microglial activation in the absence of inflammatory demyelination may represent secondary reactive changes, perhaps associated with Wallerian degeneration (32). Direct tests of these alternative hypotheses now seem possible using serial MR imaging observations to follow the course of these WM changes identified by TSPO PET.
Although this work has gone further than previous studies in using a second-generation TSPO radioligand for MR image–correlated quantitative analyses, our findings are in general agreement with those of some TSPO-targeted PET studies in MS. Previous work using 11C-(R)-PK11195 demonstrated increased uptake to correspond to WM gadolinium-enhancing lesions (8,10,11). One early study suggested the presence of focal areas of increased uptake in normal-appearing white (and gray) matter (8). However, patterns of ligand uptake in T2-weighted hyperintensities and correlations between 11C-(R)-PK11195 uptake and disease duration and disability have been inconsistent in previous studies (8,10,33). This inconsistency could reflect differences in patient populations, differences in the proportion of specific (displaceable) signal between 18F-PBR111 and 11C-(R)-PK11195, or accurate modeling, which is particularly challenging for the lower-affinity 11C-(R)-PK11195 (24,34).
This is the first study, to our knowledge, using a second-generation TSPO ligand to successfully detect significant differences in radioligand uptake between MS patients and healthy controls. The lack of differences seen in previous studies may be explained by failure to control for the variance introduced by the rs6971 TSPO SNP (14,15).
There are several limitations of our study. We studied only a small number of patients. Further characterization of the heterogeneity of the disease is needed. The use of disease-modifying treatments in most MS patients studied may have influenced the 18F-PBR111 signal. A study by Ratchford et al. showed a 3.2% reduction in 11C-(R)-PK11195 in relapsing-remitting MS patients after 1 y of treatment with glatiramer acetate, for example (35). This estimate of treatment effect is much lower than the differences in binding we found between healthy volunteers and patients overall, however (∼40% in the whole WM). However, in future work, it will be important to investigate the effects of various MS treatments on TSPO-specific binding.
MS patients and healthy controls were not matched for sex, although to our knowledge there have been no reports of a sex effect on TSPO binding in humans. Studies in rodents suggested a higher number of microglia and astrocytes in adult females (36,37), so we cannot exclude the possibility that a higher prevalence of women in the MS group may have contributed to the higher 18F-PBR111 VT in patients.
Finally, increased TSPO is seen not just in activated microglia but also in rare, activated astrocytes (9) and in lymphocytes (38), as well as in brain vascular endothelia (39). The interpretation of increased 18F-PBR111 VT reported here as arising largely from activated macrophages or microglia is based on prior neuropathologic studies demonstrating large numbers of these cells postmortem in the regions studied and on the relatively high binding to them relative to other inflammatory cells (2,27–29). A contribution from other inflammatory cell types cannot be excluded, but binding to lymphocytes is relatively much lower (40). Further technical aspects are considered in the supplemental data.
CONCLUSION
This study demonstrates that quantitative TSPO PET with a second-generation radioligand is sensitive to an element of the inflammatory response in MS not apparent on MR imaging and so otherwise occult in vivo. It highlights opportunities for the integration of MR imaging and molecular imaging for understanding the evolution of the dynamic neuropathology of MS.
DISCLOSURE
The costs of publication of this article were defrayed in part by the payment of page charges. Therefore, and solely to indicate this fact, this article is hereby marked “advertisement” in accordance with 18 USC section 1734. This study is supported by a GlaxoSmithKline/Wellcome Trust Fellowship in Translational Medicine and Therapeutics awarded through Imperial College London. Paul M. Matthews is a part-time employee of GlaxoSmithKline, which contributed PET scanning time and operational support for the conduct of this study. No other potential conflict of interest relevant to this article was reported.
Acknowledgments
We are extremely grateful to study participants for their patience and collaboration. We would also like to thank Awet Tewolde, Rahul Dimber, Yvonne Lewis, Michelle Cunneen, James Anscombe, Mark Tanner, and Ineke de Meer for their excellent technical support of this study. We also thank Bayer and ANSTO for providing preclinical data on 18F-PBR111 and the staff of Imanova and the Wellcome Trust NIHR McMichael Clinical Research Facility.
Footnotes
↵* Contributed equally to this work.
Published online Jun. 5, 2014.
- © 2014 by the Society of Nuclear Medicine and Molecular Imaging, Inc.
REFERENCES
- Received for publication November 15, 2013.
- Accepted for publication March 18, 2014.


Jump to section
Related Articles
Cited By...
- Secondary Progressive Multiple Sclerosis: New Insights
- Quantitative magnetisation transfer imaging in relapsing-remitting multiple sclerosis: a systematic review and meta-analysis
- Natalizumab treatment reduces microglial activation in the white matter of the MS brain
- 11C-PBR28 and 18F-PBR111 Detect White Matter Inflammatory Heterogeneity in Multiple Sclerosis
- Imaging Microglial Activation with TSPO PET: Lighting Up Neurologic Diseases?
- Imaging robust microglial activation after lipopolysaccharide administration in humans with PET