


Abstract
The spatial normalization of PET amyloid imaging data is challenging because different white and gray matter patterns of negative (Aβ−) and positive (Aβ+) uptake could lead to systematic bias if a standard method is used. In this study, we propose the use of an adaptive template registration method to overcome this problem. Methods: Data from a phase II study (n = 72) were used to model amyloid deposition with the investigational PET imaging agent 18F-flutemetamol. Linear regression of voxel intensities on the standardized uptake value ratio (SUVR) in a neocortical composite region for all scans gave an intercept image and a slope image. We devised a method where an adaptive template image spanning the uptake range (the most Aβ− to the most Aβ+ image) can be generated through a linear combination of these 2 images and where the optimal template is selected as part of the registration process. We applied the method to the 18F-flutemetamol phase II data using a fixed volume of interest atlas to compute SUVRs. Validation was performed in several steps. The PET-only adaptive template registration method and the MR imaging–based method used in statistical parametric mapping were applied to spatially normalize PET and MR scans, respectively. Resulting transformations were applied to coregistered gray matter probability maps, and the quality of the registrations was assessed visually and quantitatively. For comparison of quantification results with an independent patient-space method, FreeSurfer was used to segment each subject’s MR scan and the parcellations were applied to the coregistered PET scans. We then correlated SUVRs for a composite neocortical region obtained with both methods. Furthermore, to investigate whether the 18F-flutemetamol model could be generalized to 11C-Pittsburgh compound B (11C-PIB), we applied the method to Australian Imaging, Biomarkers and Lifestyle (AIBL) 11C-PIB scans (n = 285) and compared the PET-only neocortical composite score with the corresponding score obtained with a semimanual method that made use of the subject’s MR images for the positioning of regions. Results: Spatial normalization was successful on all scans. Visual and quantitative comparison of the new PET-only method with the MR imaging–based method of statistical parametric mapping indicated that performance was similar in the cortical regions although the new PET-only method showed better registration in the cerebellum and pons reference region area. For the 18F-flutemetamol quantification, there was a strong correlation between the PET-only and FreeSurfer SUVRs (Pearson r = 0.96). We obtained a similar correlation for the AIBL 11C-PIB data (Pearson r = 0.94). Conclusion: The derived adaptive template registration method allows for robust, accurate, and fully automated quantification of uptake for 18F-flutemetamol and 11C-PIB scans without the use of MR imaging data.
Imaging using β-amyloid (Aβ) with PET permits the in vivo assessment of Aβ deposition in the brain. The first human study used the 11C-labeled thioflavin-T derivative investigational Pittsburgh compound B (11C-PIB) (1). Since then, a large number of research studies with 11C-PIB have been performed, but because of the short half-life of 11C, the use of 11C-PIB is restricted to centers that have a cyclotron on-site. For wider access, a tracer with longer half-life is needed, and several tracers labeled with 18F are being developed. 18F-florbetapir (2,3) has recently been approved in the United States, and compounds in late-stage development include the investigational amyloid imaging agents 18F-flutemetamol (4,5) and 18F-florbetaben (6,7).
Quantification methods used in the first 11C-PIB studies were based on dynamic imaging, arterial sampling, and modeling (1). Lopresti et al. (8) suggested the use of a simplified measure, where standardized uptake value ratios (SUVRs) between target regions and a reference region in a late sum image are computed. The reference region is usually cerebellar gray matter, but the whole cerebellum (3) and the pons (9,10) have also been used. When computing region-based SUVRs in amyloid PET, it is important to have a robust and correct region definition using a method that is reproducible across scans and subjects. One approach is to manually outline the regions, either directly on the PET images (1) or on the coregistered MR images (11,12). Because manual outlining of regions is tedious and subjective, automated methods have been proposed. A typical approach is to use SPM (statistical parametric mapping) (13) to spatially normalize data to Montreal Neurologic Institute (MNI) space where an atlas is applied to the PET data (14). SPM has also been used to warp an atlas—for example, the automated anatomic labeling atlas (15)—to PET native space using the inverse transformation of the SPM spatial normalization (16). An alternative is to use a segmentation tool such as FreeSurfer (17) to segment a coregistered MR scan and then apply the parcellations to the PET scan (18). Common for all these methods is that they require a high-resolution MR scan. This requirement is perfectly acceptable in a research setting but may be problematic for clinical use; the MR image may not be available at the time the PET data are being analyzed or there may be quality problems with the MR scan. For an automated quantification tool designed for routine clinical use, it is therefore beneficial to have a PET-only method—that is, a method that does not rely on the availability of an MR scan.
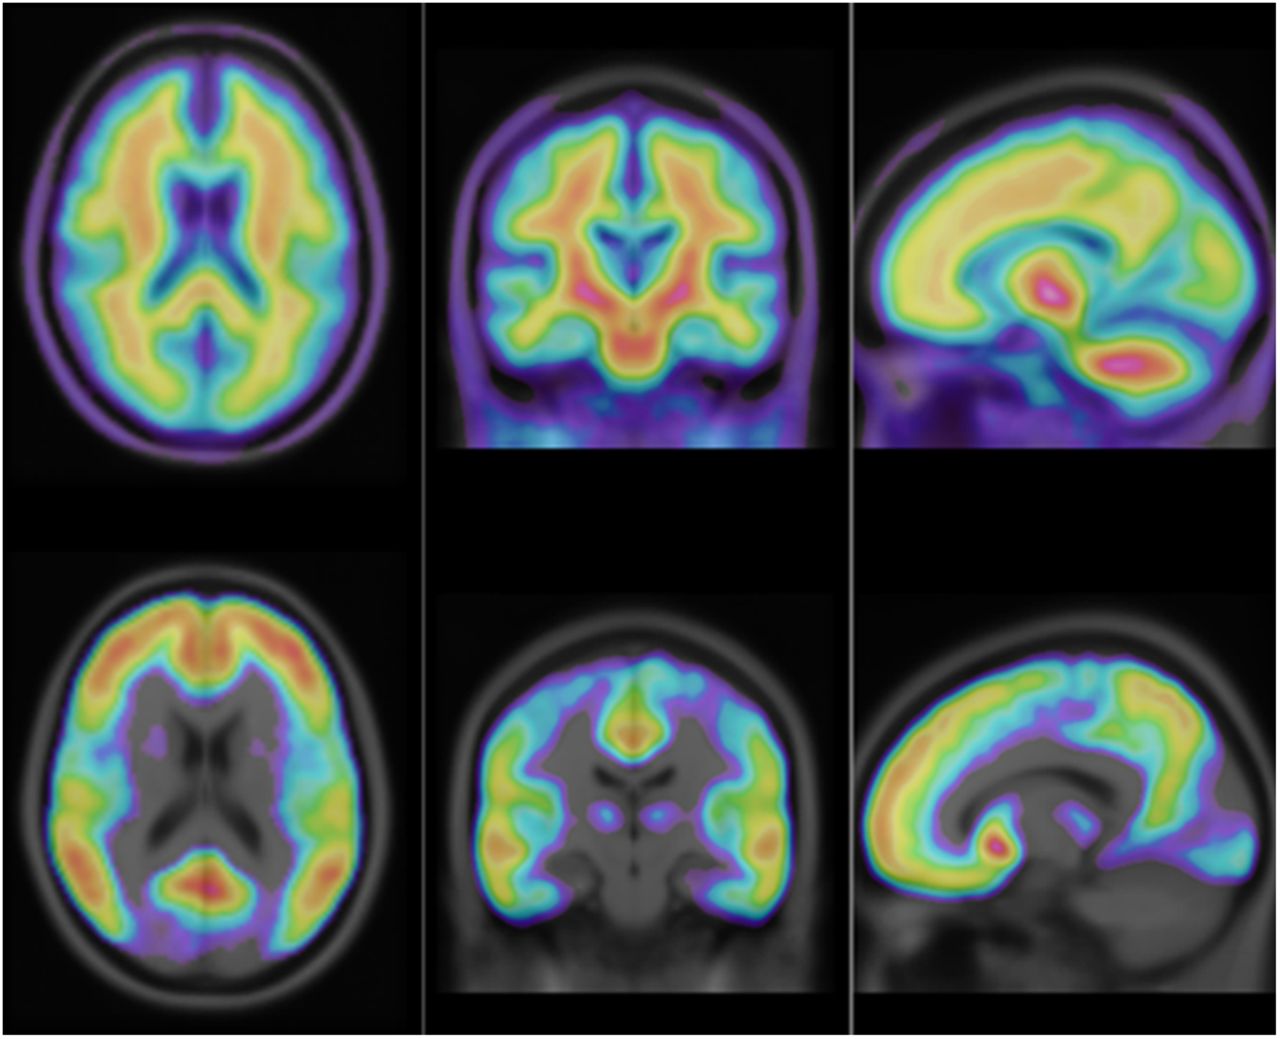
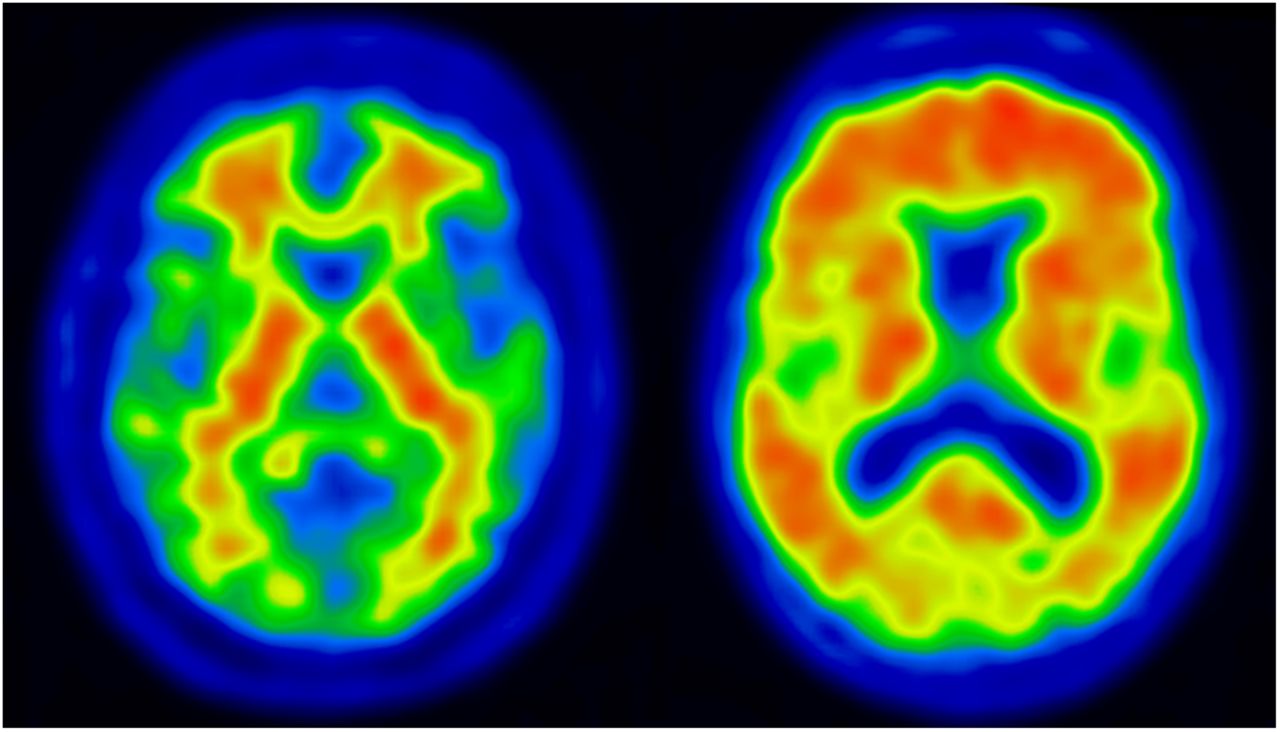
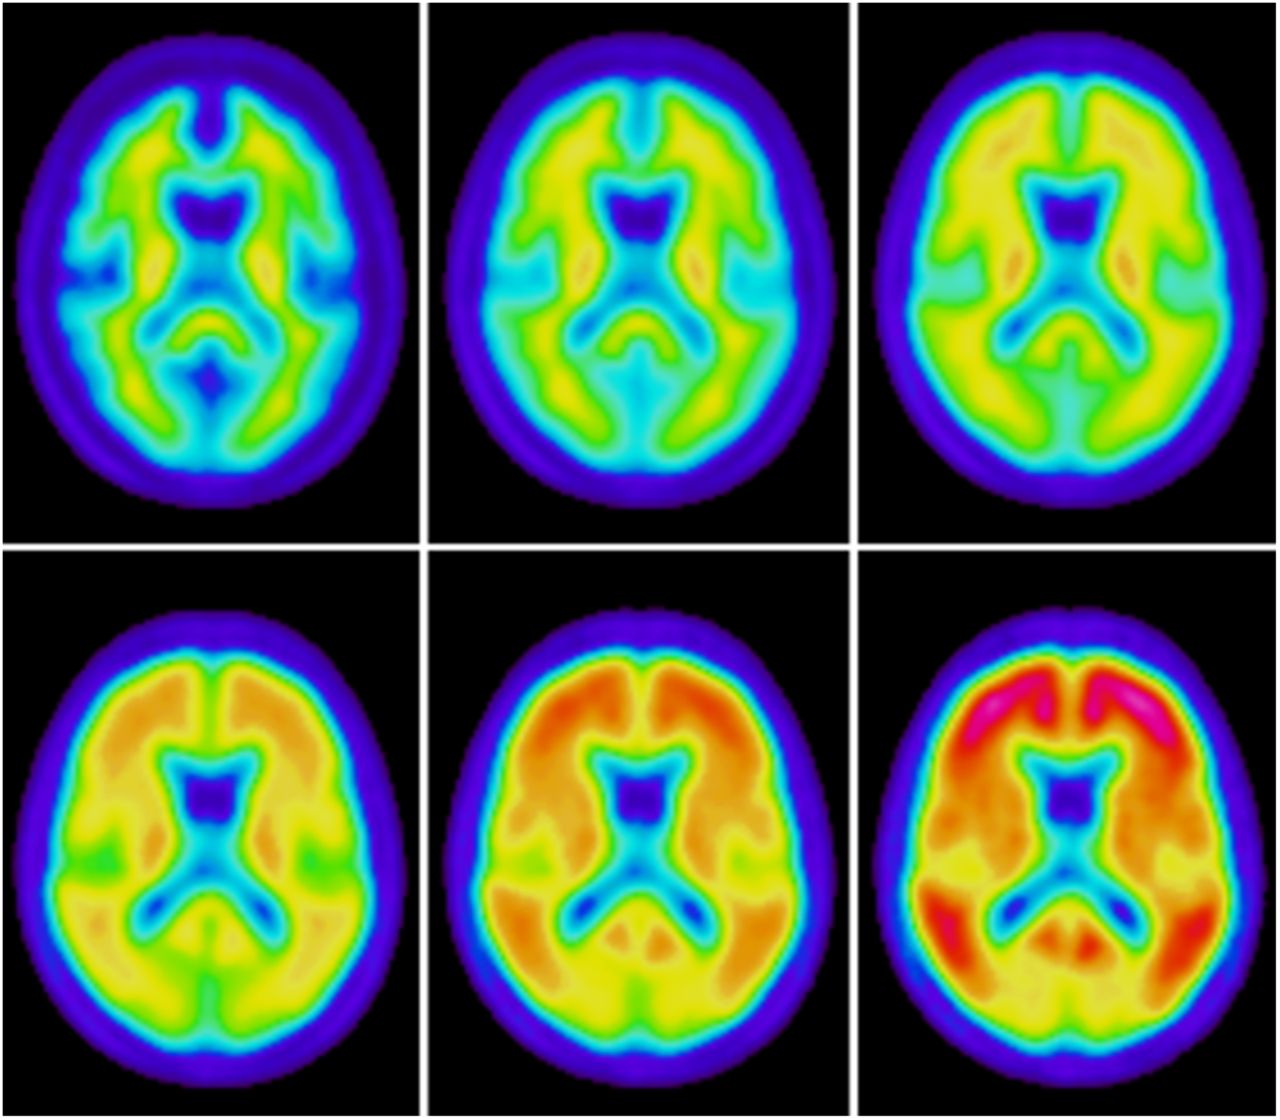
The automated quantification of brain 18F-FDG scans with PET-only methods has been used for many years. Most methods rely on spatial normalization of the data to an 18F-FDG template in standard space (19,20). For 18F-FDG, it is possible to have a single template because the overall image pattern is similar across different disease states. However, this is not the case for PET amyloid imaging. Figure 1 shows images from a positive (Aβ+) and a negative (Aβ−) 18F-flutemetamol scan result. The Aβ+ scan has high activity in cortical gray matter, and—even though white matter activity is about the same in the 2 cases—the relative activity pattern between white and gray matter is to some extent reversed (i.e., from having highest activity in white matter in Aβ− to the opposite with highest activity in gray matter in Aβ+). For a spatial normalization, it is clear that there is no obvious way of selecting a similarity metric that works with a single template and that would be able to perform accurate and robust registrations of both types of images. Obviously, a cross-correlation metric is not appropriate because of the different activity pattern in some regions. A metric based on mutual information (21) could work, but there would be a risk of systematic bias due to the different patterns in Aβ− and Aβ+ images. One possible solution could be to have a fixed number of different template images (in the simplest case, only one for typical Aβ+ and one for Aβ−), where the method first makes an initial registration and then selects one template for the subsequent final registration from some criteria. However, this method has potential pitfalls. The initial registration must be accurate enough to give appropriate information for the subsequent template selection, and the criteria for selection of the appropriate template must be robust so that the template selection does not lead to a suboptimal solution.

Typical patterns of 18F-flutemetamol uptake in negative scan (left) and positive scan (right). White matter uptake is similar in both scans, but there is considerably more uptake in gray matter in the positive scan.
To overcome the problems outlined and to allow for robust spatial normalization of 18F-flutemetamol data, we have developed an adaptive template registration method. The method uses a model-based approach where a template can be generated on a continuous scale from the most negative to the most positive scan. The selection of the template is integrated into the spatial normalization procedure (meaning that the method optimizes not only the transformation parameters but also the parameter controlling the template selection). Accurate registration of the reference region is particularly important for quantification of amyloid imaging data. Both the cerebellar gray matter and the pons have surrounding regions with different activity levels, and variability in the positioning of the reference region can potentially significantly affect resulting SUVRs. To ensure accuracy in the positioning of the reference region, our method includes a refined registration in this area that is performed as a second step once the global registration has converged.
In this study, the adaptive template registration method is described, and the spatial normalization is validated against SPM (13). We also compare quantification results obtained using data spatially normalized with the adaptive template registration method with those obtained with quantification in PET native space using FreeSurfer (17). Finally, we apply the adaptive template registration method to 11C-PIB scans from the Australian Imaging, Biomarkers and Lifestyle (AIBL) study and compare results with those from a semimanual method.
MATERIALS AND METHODS
Subjects and Imaging
Data from 2 cohorts were used. Approval for the 18F-flutemetamol phase 2 study (5) was obtained from the Ethical Committees of the participating centers, and written informed consent was obtained from all participants. Approval for the AIBL study (22) was obtained from the Austin Health Human Research Ethics Committee, and written informed consent was obtained from all participants.
Data from the 18F-flutemetamol phase 2 study (5) were used to create the 18F-flutemetamol template images and to evaluate the results of the spatial normalization method. The study comprised 27 Alzheimer disease subjects (Mini-Mental State Examination, 15–26; clinical dementia rating, 0.5–2), 25 healthy volunteers, and 20 amnestic mild cognitive impairment subjects (Mini-Mental State Examination, 27–30; clinical dementia rating, 0–0.5). Fifteen of the healthy volunteers were older than 55 y, and 10 were between 25 and 55 y of age. All subjects underwent volumetric MR imaging using a magnetization-prepared rapid-acquisition gradient-echo sequence. 18F-flutemetamol PET images were acquired as 6 × 5 min frames starting 85 min after injection of approximately 180 MBq of 18F-flutemetamol. Scans were grouped into Aβ+ and Aβ− based on results from the phase II blinded visual evaluation (5).
Data from the AIBL study (22) were used for evaluating whether the adaptive template registration method with the 18F-flutemetamol–derived adaptive template could be generalized to 11C-PIB. Data for all subjects with a 11C-PIB baseline scan were used. The cohort included scans from 83 healthy volunteers, 95 subjects with subjective memory complaints, 55 subjects with mild cognitive impairment, and 52 subjects diagnosed with Alzheimer disease. PET images were obtained using a 30-min acquisition starting at 40 min after injection of approximately 370 MBq of 11C-PIB.
Reference Space and Anatomic Regions
The MNI standard space (23) together with an MR imaging T1 template from the International Consortium for Brain Mapping (ICBM) (24) were used as reference space. The ICBM T1 template image was resampled into an image matrix with dimensions 128 × 128 × 90, with a 2-mm isotropic voxel size to match the typical resolution of PET images.
Volumes of interests (VOIs) were manually outlined on the nonresampled high-resolution MR T1 template image with some guidance given by the automated anatomic labeling atlas. In addition, we used MNI space probabilistic maps for gray matter, white matter, and cerebrospinal fluid to define tissue boundaries and to mask the VOIs to exclude white matter. The final VOIs were resampled to the same resolution as the resampled template image. The following VOIs were defined: prefrontal, sensorimotor, parietal, temporal lateral, temporal mesial and occipital cortices, anterior and posterior cingulate, and precuneus. In addition, a neocortical composite region was defined as the composition of the prefrontal, parietal, temporal lateral, anterior cingulate, posterior cingulate, and precuneus VOIs.
Adaptive Template Registration
We developed the adaptive template registration method to overcome the difficulties associated with registration of amyloid imaging data, where a template that can express the different image patterns across the whole range from Aβ− to Aβ+ is needed. To estimate where on the Aβ range an individual image is located, one approach is to use the SUVR calculated from the composite region, because this value gives a good overall estimate of the amount of uptake in the whole image. This value can be used to model the typical image patterns along the SUVR range by calculating a regression model for all voxels in a set of images covering the whole range from Aβ− to Aβ+. We used the 18F-flutemetamol phase II data for computation of such a model. First, all MR and 18F-flutemetamol scans were coregistered. We then used an MR imaging–based method to spatially normalize all scans to MNI space, and the set of VOIs were used to compute the SUVR for the composite region. In the next step, a linear regression model was applied for each voxel i in MNI space over all 18F-flutemetamol images, to express the dependence of that particular voxel’s intensity yi on the composite SUVRs. This model gave an intercept image I0 and a slope image Islope.
The intercept image corresponds to an uptake pattern of Aβ− (i.e., a scan with a low composite SUVR). The slope image will have the highest values for the parts of the image where the largest changes occur when going from low to high on the composite SUVR scale (Fig. 2). From these 2 images, synthetic images representing any image across the Aβ− to Aβ+ range can be created. These images are created by adding multiplicatively scaled portions of Islope to I0:
Intercept image (top) and slope image (bottom) from linear regression of input images on SUVRs for a neocortical composite region. Images are overlaid on MR T1 template image.
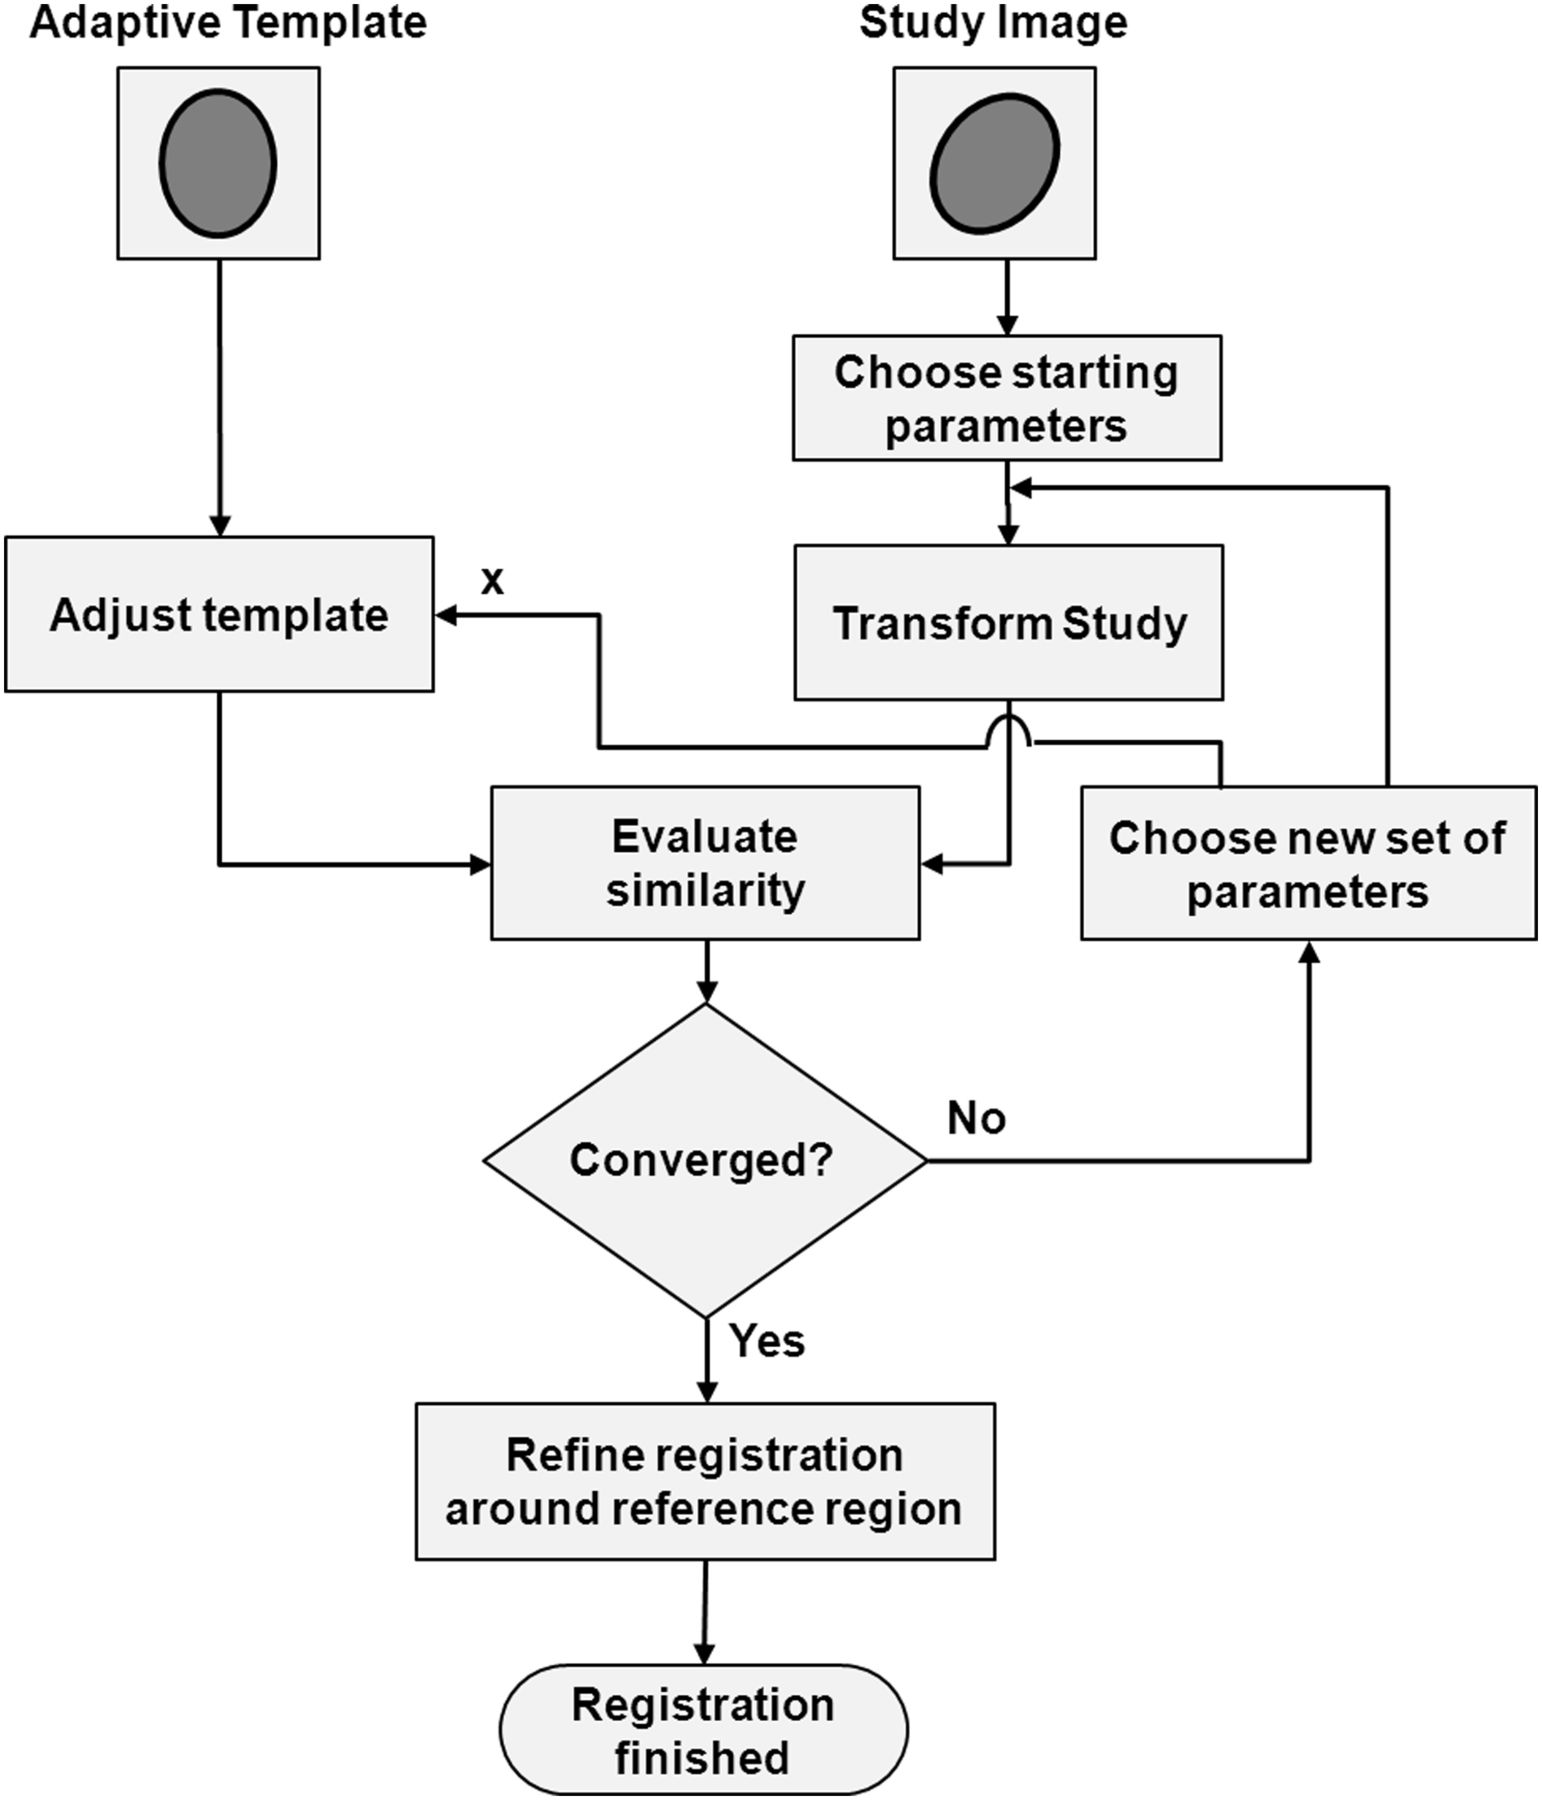
A value of the scale factor x of 0.0 will correspond to I0 itself, and a value of 1.0 will correspond to an Aβ+ subject in the high end of the composite SUVR scale. Figure 3 shows synthetic images covering values of x from 0.0 to 1.0 in steps of 0.2. It follows that by arbitrarily changing the scale factor x, any synthetic image along the linear path defined by Islope can be created. The creation of the adaptive template model was done once as a preprocessing step. We then modified our spatial normalization method to make use of this model, and the parameter x was incorporated into the optimization together with the parameters for the spatial transformation. The cross-correlation coefficient between images was used as a similarity metric, Powell’s algorithm (25) was used for optimization, and the spatial transformation of images to MNI space consisted of a global second-order polynomial transformation (26). Our spatial normalization approach means that the Powell’s algorithm will iteratively optimize both the template and the spatial transformation and will converge to the best set of transformation parameters that matches the patient’s 18F-flutemetamol scan to the optimal template for this particular scan. Figure 4 shows a flowchart for the steps involved in the spatial normalization of a study image to the template. Once the global registration has converged, refinement of the registration around the reference region is performed as a second step.

Synthetic images showing typical 18F-flutemetamol patterns going from most negative (upper left) to most positive case (lower right). Value of x is increased in steps by 0.2 going from left to right, top to bottom.

Flowchart illustrating spatial normalization using the adaptive template approach. Optimization method will change both transformation parameters and adaptive template parameter until maximal similarity between study image and template is achieved. Refined registration of reference region area is performed as a second step.
Refined Registration Around Reference Region
The quality of the reference region registration is important for the quantification of amyloid imaging data. Because of the limited detail of the information in the data, a nonrigid registration method in which the number of degrees of freedom is high is not feasible for a PET-only method. Therefore, we performed a refined registration around the reference region as a second, separate step, which is invoked once the global registration has converged (Fig. 4).
The subvolume for the refined registration is defined by 2 masks in MNI space, an inner mask Min and an outer mask Mout. The inner mask includes all voxels inside the reference regions and in the nearest surroundings—that is, Min is a mask containing the whole cerebellum and pons and the area between these structures. The outer mask Mout contains Min plus an additional layer of voxels around Min. In the refined registration step, the similarity between the patient PET scan and the adaptive template image is maximized but this time considering only the voxels inside Min. However, the use of an intensity-driven similarity metric alone, such as the cross-correlation between images, did not show robust enough results and therefore an extension was made. The idea is based on the notion that 18F-flutemetamol and 11C-PIB images have high intensities in the pons and cerebellar white matter relative to their surroundings. Furthermore, in the middle of the high-intensity region there is a region with low intensity corresponding to the fourth ventricle. These characteristics can be used by the registration to lock the reference region part of the image into a stable location, by maximizing the mean of the image intensities inside the high-intensity region relative to the region's surroundings.
To accomplish a robust registration, another mask Mhigh containing the voxels known to have the highest intensities in the pons and cerebellum white matter was created. It was used in combination with the cross-correlation metric to give the final similarity metric used for the reference region registration according to:
Here, SCC is the cross-correlation metric; μMhigh is the mean intensity inside Mhigh; μMin is the mean intensity inside Min, which is used to normalize the value to the surroundings; and R is a regularization term included for robustness purposes. A value of 10 for R was empirically chosen, because this value showed both good stability and quality of registration characteristics. However, the exact value has been shown to not be of crucial importance for the outcome of the registration.
A rigid transformation Tref is used, and once the registration has converged, all voxels inside Min are displaced using Tref whereas voxels outside Mout are left unaffected. Voxels in the region between Min and Mout are transformed using a weighted Tref where the weight goes from 1 to 0, depending on the voxel’s distance to the inner and outer masks, respectively. This transformation will ensure a smooth transition between areas inside Min and outside Mout. In summary, this second registration step allows for optimization of the registration around the reference region area while leaving the registration of the cerebrum unaffected.
Experiments
Quality of Spatial Normalization
All 18F-flutemetamol phase II MR scans were coregistered with the corresponding PET scan, and coregistered MR scans were classified into gray matter, white matter, and cerebrospinal fluid probability maps using SPM8 (Institute of Neurology, University of London). We then spatially normalized the data in 2 ways: first, SPM was used to spatially normalize all MR T1 scans, and second, the adaptive template registration was used to spatially normalize the PET scans. The resulting transformations were used to transform the coregistered probability masks into MNI space. Data were divided into Aβ− and Aβ+ on the basis of results from a previously performed visual read (5), and average images of the gray matter probability maps were calculated for both groups, using both spatial normalization methods. Visual assessment was used to investigate the quality of the fit in the cortical regions. To get an estimate of the quality of the fit of the reference region, we looked at the amount of gray matter in the probability masks contained by the cerebellar reference region and the amount of brain tissue (gray or white) contained by the pons reference region.
Comparison with Patient Space Quantification
The adaptive template registration combined with the VOI atlas allows for the automated quantification of 18F-flutemetamol without the use of an MR image. The gold standard for amyloid imaging quantification should, at least in theory, be a method that makes a precise segmentation of the structures to be quantified using the patient’s MR image and then applies the segmentation to a coregistered PET scan and hence makes the quantification in PET native space. To make a comparison of the adaptive template registration quantification with such a method, we used FreeSurfer to segment each subject’s MR image. The resulting parcellations were applied to the coregistered 18F-flutemetamol scans, and SUVRs were computed. A neocortical composite region was computed by averaging FreeSurfer’s frontal, parietal, temporal, anterior cingulate, and posterior cingulate regions. The SUVRs for this neocortical composite region were correlated with SUVRs for the composite region computed with the adaptive template registration method. Correlations were computed using both the cerebellar gray matter and the pons as reference regions. However, FreeSurfer does not segment pons; thus, the FreeSurfer brain stem was used instead.
Method Generalized to 11C-PIB
To investigate whether the 18F-flutemetamol model could be generalized to 11C-PIB, we applied the adaptive template registration method to the AIBL 11C-PIB scans. We compared the SUVRs for the composite region with corresponding neocortical SUVRs obtained with a semimanual method that made use of the subject’s coregistered MR image for positioning and adjustments of narrow cortical regions (27). Correlations were computed using both cerebellum gray matter and pons as a reference region.
RESULTS
Spatial normalizations were successful on all scans (18F-flutemetamol, n = 72; 11C-PIB, n = 285), and no manual adjustments were made. Visual inspection of the average gray matter probability maps for the Aβ− and Aβ+ groups obtained using the adaptive template registration did not indicate any systematic difference in the results for these 2 groups of images. Visual comparison with the corresponding average images obtained using SPM’s MR imaging–based spatial normalization indicated similar accuracy of the 2 methods in the cerebrum. Around the cerebellum reference region, however, the adaptive template registration produced a sharper average image, indicating a more consistent registration in this area (Fig. 5). This increased accuracy was also confirmed by the quantitative assessment of the amount of gray matter contained in the cerebellum reference region as shown by the box plots (Fig. 6). A corresponding quantitative assessment of the amount of brain tissue contained by the pons reference region indicated higher precision and less variability for data spatially normalized with the adaptive template registration method, although the difference between the methods was less pronounced for the pons than for the cerebellar reference region (Fig. 7).
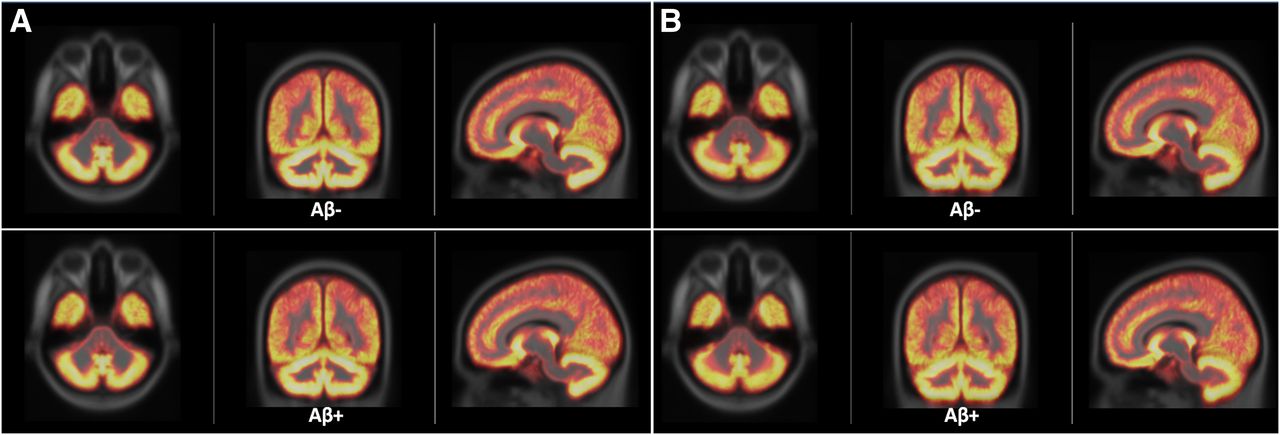
Average gray matter probabilistic maps for Aβ− and Aβ+ groups superimposed on MNI template obtained using adaptive template registration (A) and SPM (B). Visually, there was no obvious difference between Aβ− and Aβ+, and adaptive template registration and SPM showed similar performance in cerebral cortex whereas adaptive template registration gave sharper cerebellar cortex.
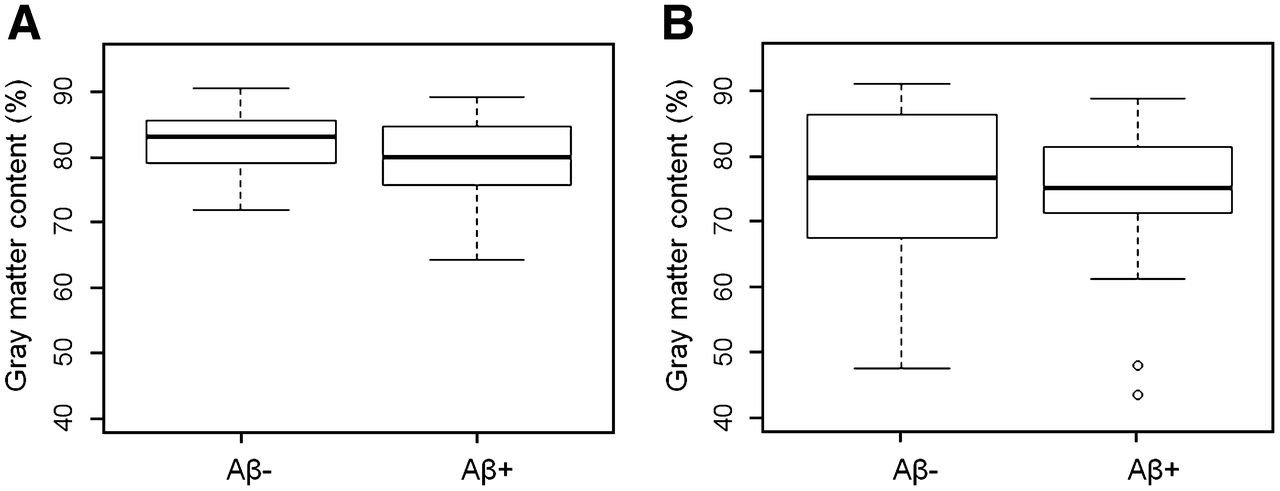
Box plots showing amount of gray matter contained in reference region for Aβ− and Aβ+ groups. Adaptive template registration (A) shows higher amounts of gray matter in cerebellar reference region and less variability than does SPM (B).

Box plots showing amount of brain tissue contained in pons reference region for Aβ− and Aβ+ groups. Adaptive template registration (A) shows higher amounts of brain tissue in pons reference region and less variability than does SPM (B).
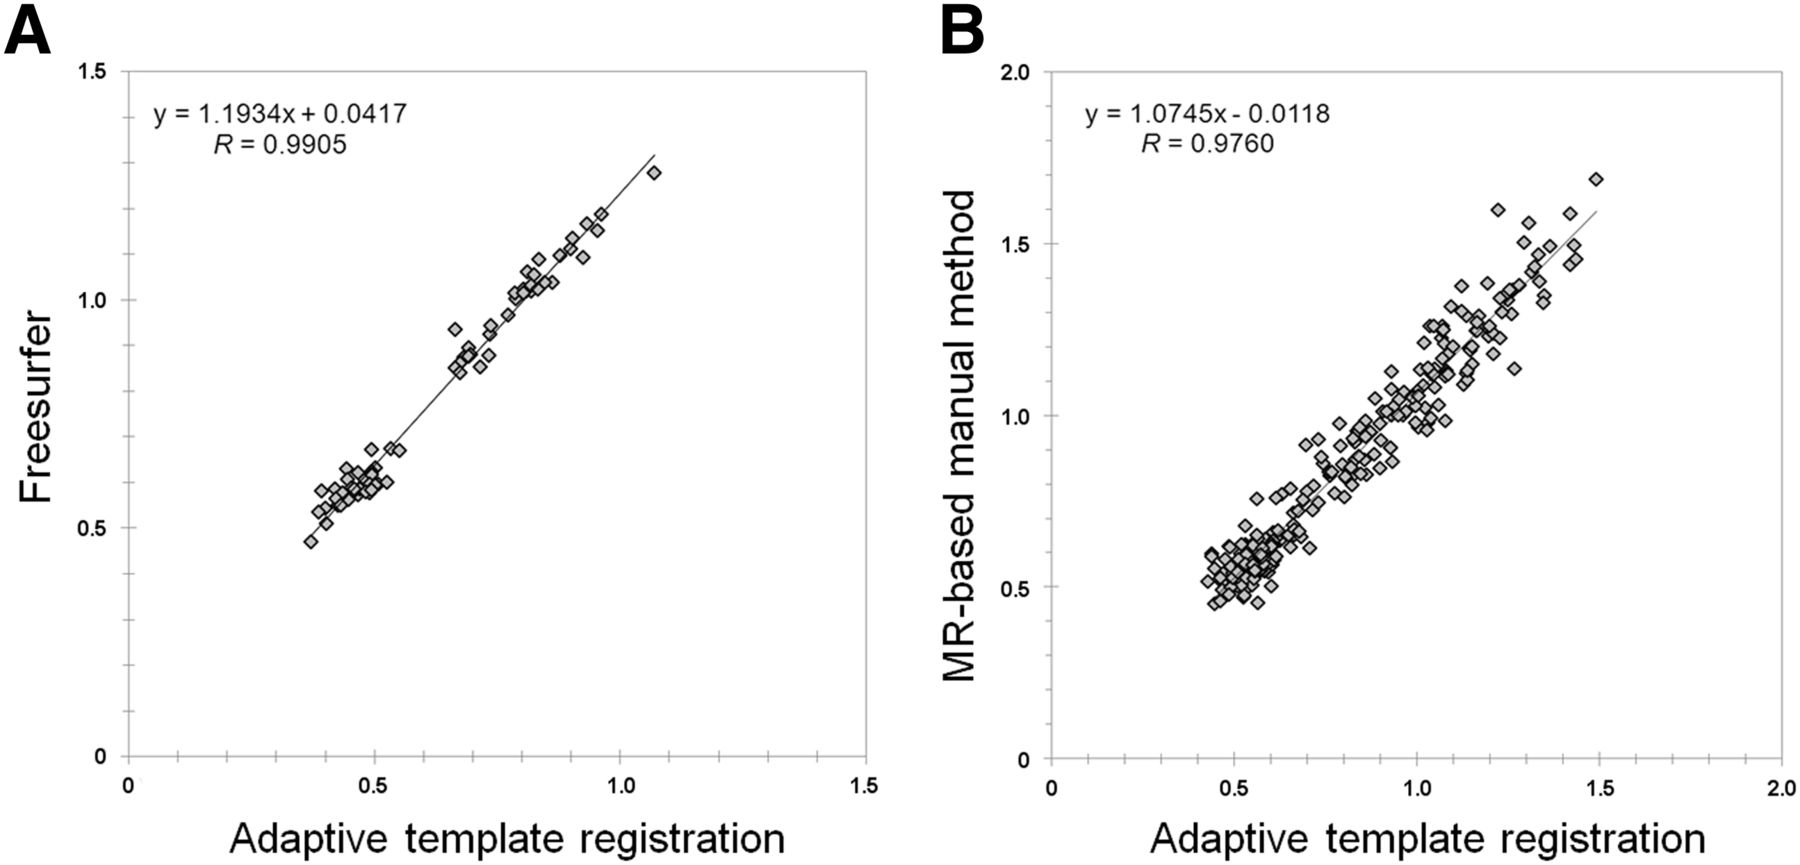
Comparison of 18F-flutemetamol quantification results using the adaptive template registration method and FreeSurfer’s MR-based analysis in native patient space showed good agreement. The Pearson correlation coefficient between the SUVRs for the neocortical composite region computed with both methods was 0.96 with cerebellum gray matter as reference and 0.99 when the pons or brain stem was used (Fig. 8A).

Correlation between 18F-flutemetamol phase II SUVRs for neocortical composite region computed with adaptive template registration and FreeSurfer (A) and corresponding correlation between AIBL PIB SUVRs computed with adaptive template registration and independent manual method (B). Pons or brain stem was used as reference region for both comparisons.
Although the regression model in the adaptive template registration method was built using 18F-flutemetamol images, the method worked well for processing of 11C-PIB data. Spatial normalization of the AIBL 11C-PIB data was successful on all scans, but 1 scan had a truncated cerebellum and was excluded from further analysis when the cerebellum was used as reference. There was a strong correlation between SUVRs for the composite region using the adaptive template registration method and corresponding values defined by a semimanual approach (27). Pearson r was 0.94 for data normalized to cerebellar gray matter and 0.98 when the pons was used as reference (Fig. 8B).
DISCUSSION
In this study, we have presented the implementation and validation of a method for PET-only spatial normalization of amyloid imaging data. The method makes use of an adaptive template model, in which a single parameter is used to control the template. By varying the value of this control parameter, a synthetic template can be generated on a continuous scale from the most amyloid-negative case to the most amyloid-positive case. This parameter is optimized as part of the image registration process, meaning that the method will converge—not only to the optimal spatial transformation parameter values but also to the optimal (i.e., most similar) template for the particular scan being processed. This approach helps overcome the problems with a single template method where there is a risk for bias because of systematic differences in registering Aβ+ and Aβ− scans.
Validation of the spatial normalization was done with a comparison to SPM. Our results indicate that registrations using our PET-based method and SPM’s MR imaging–based method give a similar accuracy in the registration of the cortical regions. However, the adaptive template registration and SPM differed in the area around the reference regions. Although SPM used an MR imaging–driven method, compared with the adaptive template registration, there was a larger variability in the positioning of the cerebellum reference region in relation to the cerebellar cortex. Similarly, the adaptive template registration showed less variability in the positioning of the pons reference region, although there the difference between the 2 methods was less pronounced. The improved performance of the adaptive template registration method in this area is due to the second registration step, with a refined registration in a subvolume around the cerebellum and the pons. Although frequently used, SPM’s spatial normalization with the standard ICBM-152 T1 template (24) is known to have poor performance in the alignment of cerebellar structures (28).
Automated analysis of PET images can be done in native space or in standard space. Native space analysis requires that a VOI atlas is warped to native space or, alternatively, that a method of parcellation of the data is used. Both methods typically require the availability of a coregistered high-resolution MR scan. The advantage of analysis in native space is that the PET data are left unchanged, which in theory should minimize the risk for variability being introduced by the image-processing steps. An advantage of analyzing the data in standard space, however, is that this allows for comparison of the patient scan to a normative database and for voxel-based z score maps and stereotactic surface projections to be computed. For these reasons, we selected to develop a standard-space method. To assess the whole processing chain, from start to quantified PET images, we compared a neocortical score obtained with the adaptive template registration method with a corresponding score obtained with FreeSurfer parcellations in native space. The high correlation (cerebellum gray matter SUVR, 0.96, and pons SUVR, 0.99) validates the use of our standard space method. The high correlation is obtained despite the fact that the target and reference regions used by the 2 methods vary substantially. The different definition of the regions is also the reason why the slope is dissimilar from 1.0.
18F-flutemetamol is a 11C-PIB derivative, and the characteristics of the images obtained with both tracers are similar although 18F-flutemetamol has higher nonspecific uptake in white matter (5). Because of this, we hypothesized that the 18F-flutemetamol–based model in the adaptive template registration method would work also for spatial normalization of 11C-PIB data. The method was assessed using AIBL data where neocortical SUVRs were compared with those obtained by a semimanual method in which positioning and adjustments of narrow cortical regions were performed using coregistered MR imaging (27). The strong correlations obtained indicate a similar performance of the 2 quantification methods, despite the fact that the regions used by the 2 methods differ substantially. It may be possible that the quality of the registration of 11C-PIB data can be further improved if a 11C-PIB–specific adaptive template is built, but this has to be further evaluated.
One limitation of the described method relates to its performance around the ventricles. The transformation used does not allow for the detailed deformations needed to make a good fit of these parts of the brain for all possible ventricle sizes. Thus, it is difficult to guarantee a good fit of a striatal region and this area is not part of the automated quantification. Investigation into these issues and improvement of the method are planned for the future.
One interesting aspect of comparing the different quantification methods is that the correlation between the methods was higher for SUVRs normalized to the pons, possibly because of several factors. One factor is that the pons has high contrast to surrounding regions both in MR imaging and in amyloid PET, assisting the accurate placement of the reference region both for an automated and for a manual method. Furthermore, the pons is a hot region whereas cerebellar gray matter is a cold region, and the division with a number derived from a region with low uptake is likely to add more variability than if a hot region is used. In addition, in the axial plane, the pons is surrounded by lower count regions in all directions whereas cerebellar gray matter is bordered by higher cerebellar white matter on one side and lower nonbrain activity or cerebrospinal fluid on the other side, meaning that a cerebellar gray reference region is more affected by an anterior or posterior displacement. Because of this, the pons is an attractive reference region for amyloid imaging data but has to be further validated using data from longitudinal studies.
CONCLUSION
The described adaptive template registration method allows for robust, accurate, and fully automated quantification of 18F-flutemetamol and 11C-PIB scans without the use of MR imaging.
DISCLOSURE
The costs of publication of this article were defrayed in part by the payment of page charges. Therefore, and solely to indicate this fact, this article is hereby marked “advertisement” in accordance with 18 USC section 1734. This work was partially funded under the 7th Framework Programme by the European Commission (EU-Grant-224328-PredictAD; From Patient Data to Personalized Healthcare in Alzheimer's Disease). No other potential conflict of interest relevant to this article was reported.
Footnotes
Published online Jun. 5, 2013.
- © 2013 by the Society of Nuclear Medicine and Molecular Imaging, Inc.
REFERENCES
- Received for publication October 11, 2012.
- Accepted for publication January 31, 2013.


Jump to section
Related Articles
Cited By...
- Quantification Supports Amyloid PET Visual Assessment of Challenging Cases: Results from the AMYPAD Diagnostic and Patient Management Study
- Quantification supports amyloid-PET visual assessment of challenging cases: results from the AMYPAD-DPMS study
- Fixel-Based Analysis Reveals Tau-Related White Matter Changes in Early Stages of Alzheimer's Disease
- Fixel-based analysis reveals macrostructural white matter changes associated with tau pathology in early stages of Alzheimers disease
- The RSNA QIBA Profile for Amyloid PET as an Imaging Biomarker for Cerebral Amyloid Quantification
- Comparing the Clinical Utility and Diagnostic Performance of CSF P-Tau181, P-Tau217, and P-Tau231 Assays
- Improved Accuracy of Amyloid PET Quantification with Adaptive Template-Based Anatomic Standardization
- Cerebral hypoperfusion is a late pathological event in the course of Alzheimers disease
- Improving prediction of amyloid deposition in Mild Cognitive Impairment with a timed motor task
- Association of Enlarged Perivascular Spaces and Measures of Small Vessel and Alzheimer Disease
- Derivation and utility of an A{beta}-PET pathology accumulation index to estimate A{beta} load
- Biomarker Localization, Analysis, Visualization, Extraction, and Registration (BLAzER) Workflow for Research and Clinical Brain PET Applications
- Spatial Normalization of 18F-Flutemetamol PET Images Using an Adaptive Principal-Component Template
- Generation of Structural MR Images from Amyloid PET: Application to MR-Less Quantification
- Amyloid blood biomarker detects Alzheimer's disease
- Increased midlife triglycerides predict brain {beta}-amyloid and tau pathology 20 years later
- Visualization and Quantification of 3-Dimensional Stereotactic Surface Projections for 18F-Flutemetamol PET Using Variable Depth
- Myo-inositol changes precede amyloid pathology and relate to APOE genotype in Alzheimer disease
- Detailed comparison of amyloid PET and CSF biomarkers for identifying early Alzheimer disease
- Automated Quantification of 18F-Flutemetamol PET Activity for Categorizing Scans as Negative or Positive for Brain Amyloid: Concordance with Visual Image Reads