


Abstract
The purposes of this study were (a) to assess the feasibility of diastolic function (DFx) evaluation using standard 16-frame postexercise gated 99mTc-sestamibi myocardial perfusion SPECT (MPS), (b) to determine the relationship of the 2 common DFx parameters, peak filling rate (PFR) and time to peak filling (TTPF), to clinical and systolic function (SFx) variables in patients with normal myocardial perfusion and SFx, and (c) to derive and validate normal limits. Methods: Ninety patients (71 men; age, 30–79 y) with normal exercise gated MPS were studied. None had hypertension, diabetes, rest electrocardiogram abnormality, or known cardiac disease. All patients reached ≥85% of maximum predicted heart rate (HR). The population was randomized into derivation (n = 50) and validation (n = 40) groups. Univariable and multivariable approaches were deployed to assess the influence of clinical and functional variables on DFx parameters. Results: PFR and TTPF were assessed in all patients. Mean values of PFR and TTPF in the whole study population were 2.62 ± 0.46 end-diastolic volumes per second (EDV/s) and 164.6 ± 21.7 ms, respectively. By applying a 2-SD cutoff to the mean values in the derivation group, the threshold for abnormal PFR and the threshold for abnormal TTPF were <1.71 EDV/s and >216.7 ms, respectively. The normalcy rates in the validation group for PFR and TTPF were both 100%. The PFR showed weak but significant correlations with age, EDV, end-systolic volume, left ventricular ejection fraction (LVEF), and poststress HR. However, TTPF did not correlate with these parameters. Final normal thresholds determined from the combined populations were PFR = 1.70 EDV/s and TTPF = 208 ms. Multivariable analysis showed that age, sex, LVEF, and HR are strong predictors for PFR, whereas TTPF was not influenced by any clinical or SFx variable. Conclusion: With a new algorithm in QGS, assessment of LV DFx is feasible using 16-frame gated MPS even without bad-beat rejection, resulting in normal limits similar to those reported with gated blood-pool studies. However, due to the dependency of PFR on SFx parameters, sex, HR, and age, TTPF appears to be a stable and more useful parameter with this approach. The clinical usefulness of these findings requires further study.
Abnormality of left ventricular (LV) diastolic function (DFx) is frequently the earliest indicator of LV dysfunction in many diseases, including coronary artery disease (CAD), congestive heart failure (CHF), hypertrophic cardiomyopathy, valvular heart disease, diabetes mellitus, and hypertension (1–6). It is estimated that up to one third of patients with CHF have abnormality of DFx before systolic function (SFx) deteriorates.
In addition to myocardial perfusion, gated myocardial perfusion SPECT (MPS) is widely used for the assessment of SFx by the measurement of LV ejection fraction (LVEF) and LV volumes using a variety of commercially available software programs (7–9). For evaluation of DFx, Doppler echocardiography and, to a much lesser extent, first-pass and gated blood-pool scintigraphy (GBPS) are the established procedures (3,10–14). The assessment of DFx has been shown to be feasible with gated MPS (15–18); however, the stability of DFx variables is unclear, and normal values for DFx parameters using gated MPS have not yet been described. Furthermore, there is no agreement as to which of DFx variables are likely to be most effectively measured with this method. The purpose of this study was to determine the relationship of the various DFx parameters to clinical and SFx variables in a normal population and to establish the normal limits of DFx parameters obtained from postexercise gated MPS in patients with normal myocardial perfusion and SFx.
MATERIALS AND METHODS
Patients
The study population comprised 90 patients referred for rest/stress gated MPS who met the following criteria: technically acceptable normal rest and exercise gated MPS, achieving ≥85% of maximum predicted heart rate (MPHR) during symptom-limited treadmill exercise (Bruce protocol), normal resting electrocardiogram (ECG). None had a history of hypertension, diabetes, valvular or other cardiac disease. The indications for MPS were previous positive treadmill test (n = 5), atypical chest pain (n = 50), shortness of breath with or without atypical angina (n = 15), nonanginal chest pain (n = 5), and syncope (n = 1). The rest of the patients (n = 14; 16%) were asymptomatic and were referred to cardiac imaging to rule out suspected CAD by the clinical physician. During stress testing, 4 had a positive ECG response (>1-mm ST segment depression) and 2 had a positive clinical response to exercise (exertional chest discomfort). In all patients, the posttest likelihood of CAD was considered to be low (<10%), after taking into account age, sex, risk factors, symptoms, clinical and ECG responses to stress, and the results of gated MPS. Patients with end-systolic volume (ESV) of <20 mL on gated MPS are not included, since assessment of LV volumes and function is less accurate in patients with very small volumes (19). The study population was randomly divided into 2 groups for derivation (n = 50) and validation (n = 40) of DFx parameters. Heart rate (HR) used for all analyses was the mean HR during poststress acquisition.
Image Acquisition/Reconstruction
All patients underwent separate-acquisition dual-isotope MPS as previously described (20). After gated rest 201Tl MPS (not analyzed for DFx in this study), 925–1,295 MBq of 99mTc-sestamibi (dose adjusted to patient weight) was injected at peak exercise, and gated MPS imaging was initiated 50 ± 23 min later using a 20% window centered over the 140-keV photopeak. Images were acquired with a 2-detector 90° camera (Forte, Philips/ADAC; or E-cam, Siemens Medical Systems) using elliptic 180° acquisition (right anterior oblique 45° to left posterior oblique 45°) with 64 projections at 25 s per projection and 16 frames per R–R interval. The projection data were reconstructed into tomographic transaxial images using filtered backprojection and automatic reorientation (7,21). No attenuation or scatter correction was used. Filtered backprojection reconstruction used a ramp filter followed by 2-dimensional Butterworth filtering (order, 5; cutoff frequency, 0.66 cycle/pixel on a 0–1 scale). Pixel size was 6.54–6.59 mm.
Assessment of DFx and SFx
For this study, a new version of QGS software was used (QGS Companion; Cedars-Sinai Medical Center), which quantifies DFx parameters using the bicubic spline interpolation of the LV volume/time curve. The LV filling rate/time curve is computed from the first derivative of the volume/time curve. Specifically, the peak-filling rate (PFR) is defined as the greatest filling rate in early diastole and corresponds to the peak value of the first derivative of the diastolic portion of the time–activity curve. Since the filling is normalized to end-diastolic volume (EDV), the unit for PFR is EDV/s. The time to peak filling (TTPF), expressed in milliseconds, is the interval between ES and the PFR. An example of the volume/time and filling/time curves combined display is shown in Figure 1. For SFx, EDV (mL), ESV (mL), and LVEF (%) are calculated from the LV volume/time curve as previously described (7). Recent QGS software computes the DFx parameters in their corresponding units, rather than providing raw frame numbers in brackets, which needed further calculations to find the final unit values as in the previous version.
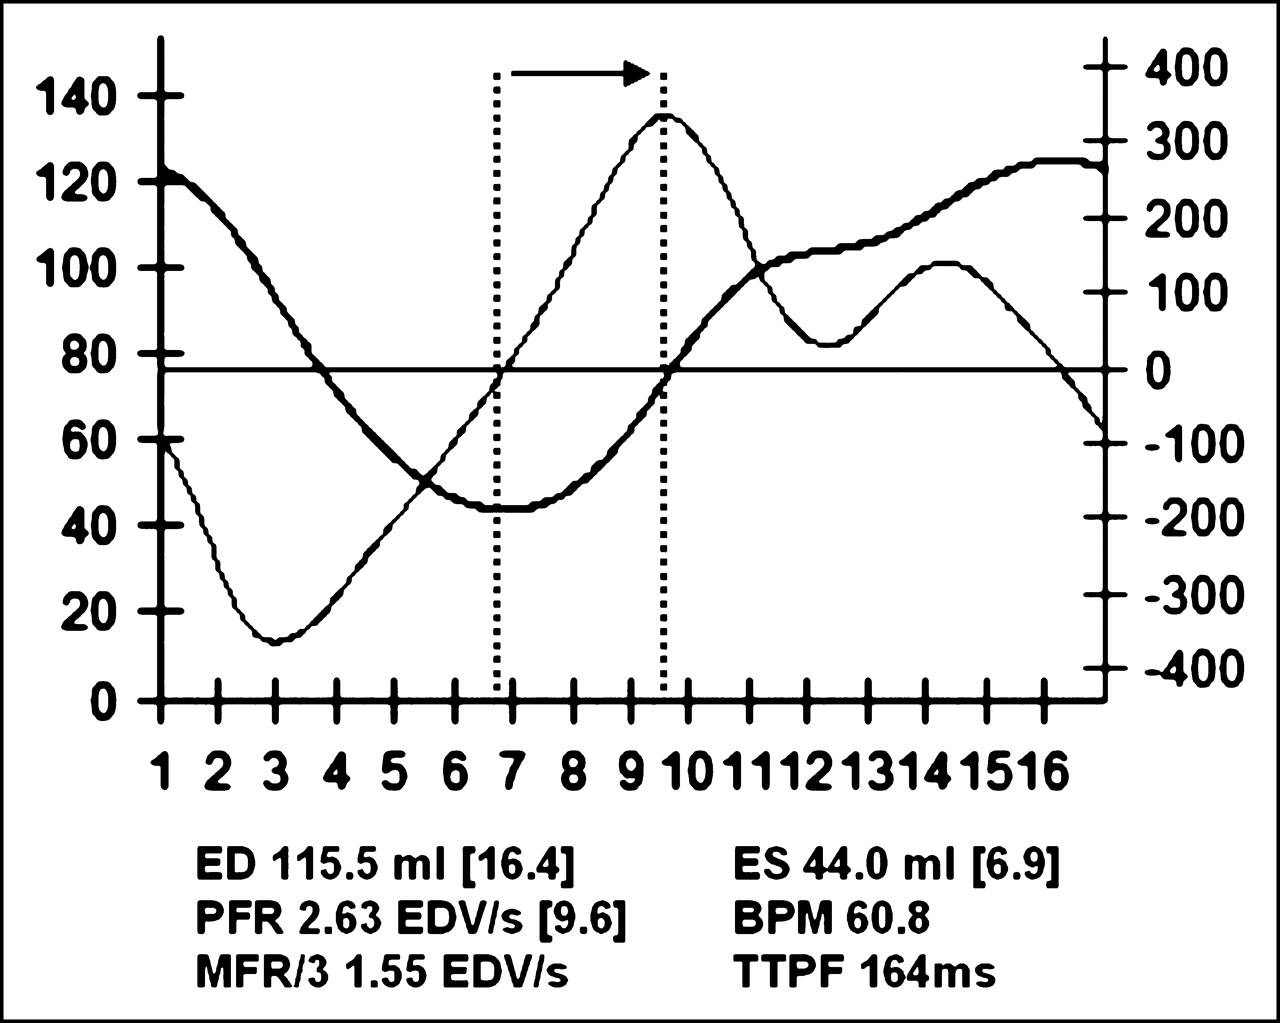
Example of a patient’s volume and filling curves over time in 16-frame gated MPS. Numbers in brackets represent exact frame numbers from which parameters are derived. Arrow shows TTPF, defined by time from ES to greatest filling rate in early diastole. Peak filling is normalized to EDV. ED = end diastole; ES = end systole; BPM = beats per minute HR; MFR/3 = mean filling rate over first third of diastole.
Determination of Normal Values and Normalcy Rates
The mean ± SD was determined for each diastolic parameter in the derivation group, the validation group, and the overall group. The normalcy rates were obtained by applying 2-SD thresholds calculated in the derivation group to the validation group. Differences among the DFx parameters were assessed with respect to age and sex. The normal limits for the DFx parameters were determined from the overall population by a 2-SD threshold.
Statistical Analysis
All variables are expressed as mean ± SD. The Student t test and 1-way ANOVA (with Bonferonni correction when appropriate) were applied to evaluate differences for continuous parameters and χ2 statistics for categoric variables. Correlations among variables were analyzed using the Pearson correlation test. Additionally, multivariable linear regression analysis was performed to evaluate the dependency/nondependency of the DFx parameters on clinical and SFx parameters and to determine the predictors of DFx parameters. Data analyses were performed using SPSS 11.0 for Windows statistical application program. In all assessments, P < 0.05 was considered significant.
RESULTS
The clinical characteristics of the study group are shown in Table 1. There were no significant differences in clinical parameters between the derivation and the validation groups. In addition, no significant differences between the 2 groups were observed with respect to HR, SFx, and DFx parameters (Table 2).
Characteristics of Study Population
Poststress SFx and DFx Parameters of Study Population
Effect of SFx and Clinical Variables on DFx Parameters
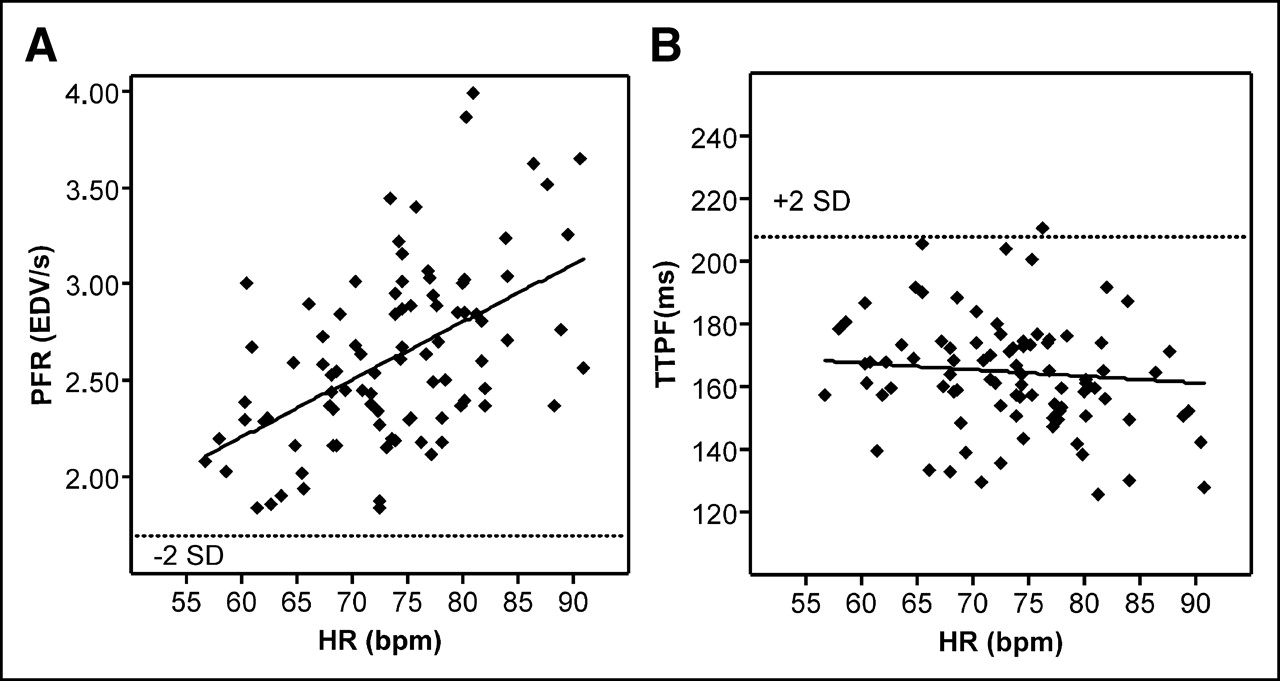
PFR showed significant correlations with age (r = −0.348), EDV (r = −0.331), ESV (r = −0.471), LVEF (r = 0.529), and HR (r = 0.514) (P = 0.01 for all). In contrast, TTPF appeared to be a more stable DFx variable, as it did not correlate with any of the SFx parameters, age, or HR. As illustrated in Figures 2A and 3A, there was marked variation in PFR in the individual patients as a function of the HR and LVEF at the time of gated MPS acquisition, respectively; however, TTPF did not show any significant correlations with these variables (Figs. 2B and 3B). The time interval between peak exercise and acquisition had no correlation with PFR (r = −0.174, P = not significant [NS]) or TTPF (r = −0.023, P = NS). When the patients were divided into 3 groups according to their poststress acquisition time interval, there were no significant differences among groups in terms of functional parameters (Table 3).

Scatter plots of relationship between PFR and HR (A) and TTPF and HR (B). Dotted line indicates 2-SD threshold. Solid line is regression line. In A, correlation coefficient (r) is 0.514, P = 0.01. In B, TTPF shows no correlation with HR.

Scatter plots of relationship between PFR and EF (%) (A) and TTPF and EF (%) (B). Dotted line indicates 2-SD threshold. Solid line is regression line. In A, correlation coefficient (r) is 0.529, P = 0.01. In B, TTPF shows no correlation with EF (%).
Parameters Categorized According to Stress-to-Acquisition Time Interval
Age Differences
Comparisons of the mean values of the SFx and DFx parameters in 3 age groups (<50 y [n = 36], 50–59 y [n = 29], and ≥60 y [n = 25]) are shown in Table 4. There was a significant decline in PFR with advancing age (P < 0.005 across age groups). When individual groups were compared, the group ≥60 y had a lower PFR than the group <50 y (P < 0.005). TTPF was slightly, but not significantly, higher in the oldest group. The relationships between PFR and age (A) and TTPF and age (B) are illustrated in Figure 4.
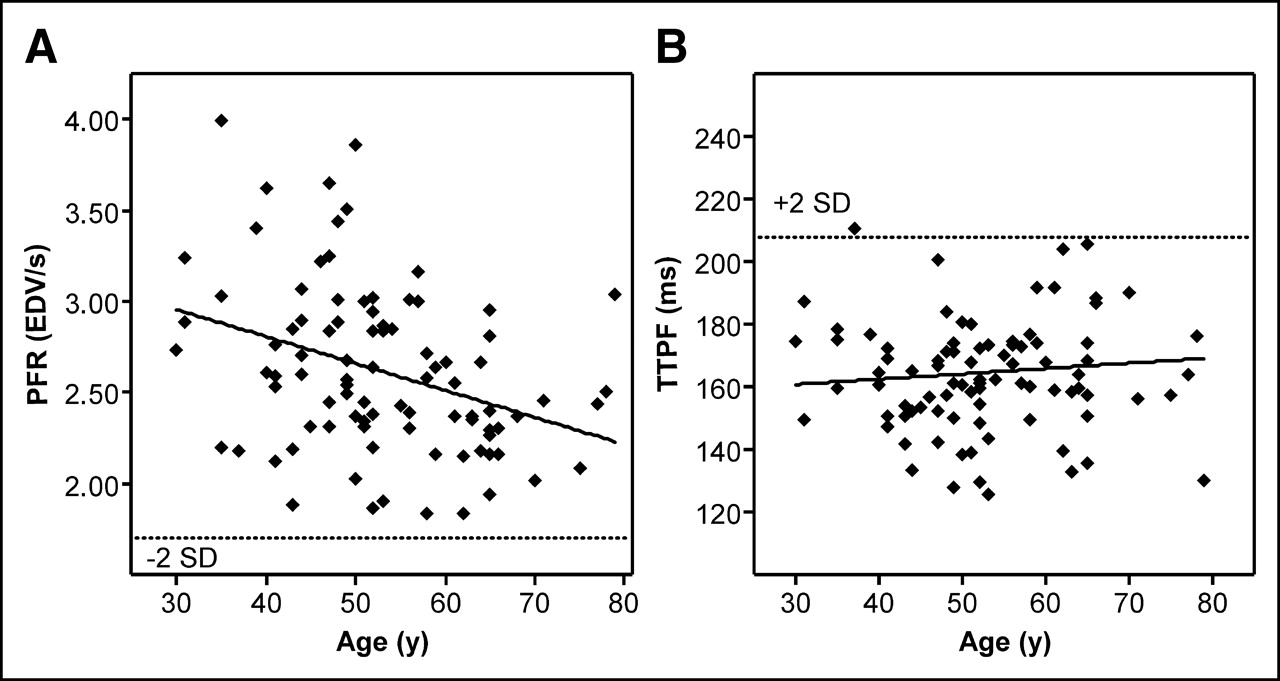
Scatter plots of relationship between PFR and age (A) and TTPF and age (B). Dotted line indicates 2-SD threshold. Solid line is regression line. In A, correlation coefficient (r) is −0.348, P = 0.01. In B, TTPF shows no correlation with age.
Age Differences Between Poststress SFx and DFx Parameters
Sex Differences
Comparisons of SFx and DFx parameters in men and women are shown in Table 5. There was a significant difference between men and women in volumes, LVEF, and PFR, such that both EDV and ESV were lower and LVEF and PFR were higher in women. TTPF was similar in both sexes. When a 2-SD threshold is applied, the normal limits for PFR and TTPF in men and women were 1.73 and 1.87 EDV/s, respectively, and 211.4 and 194.1 ms, respectively.
Sex Differences Between Poststress QGS Parameters Assessed
Multivariable Analysis
When multivariable linear regression analysis was used, sex, LVEF, HR, and age were independent predictors of PFR (Table 6). On the other hand, none of the available clinical or SFx variables was predictive of TTPF. Thus, clinical variables such as sex, age, HR, and LVEF (either by univariable or by multivariable analysis) were associated with variation in the PFR values among the clinically homogeneous low likelihood of CAD population, whereas TTPF tended to be independent of these influences. Other available variables, including stress-to-acquisition time, failed to be predictive of PFR or TTPF in the study population.
Multivariable Regression Analysis for Prediction of PFR and TTPF
Normal Limits and Normalcy Rates
By applying a 2-SD cutoff to the mean values in the derivation group, the normalcy rate in the validation group for both TTPF and PFR was 100%. In the overall study group (90 patients), the thresholds for TTPF and PFR were >208 ms and <1.70 EDV/s, respectively.
DISCUSSION
The most commonly reported parameters for assessing DFx are the PFR and the TTPF (22). Using a new algorithm in QGS software, we assessed these parameters in 16-frame gated MPS without bad-beat rejection in “normal” patients early after maximal exercise. The TTPF was stable, not correlating with any clinical or SFx parameter, whereas the PFR showed variations with age, EDV, ESV, EF, and HR.
The mean values for PFR (2.62 ± 0.46 EDV/s) and TTPF (164.6 ± 21.7 ms) in our normal study population are similar to those defined in the literature using planar GBPS (23,24). Using DFx measurements derived from GBPS, Muntinga et al. assessed the normal values in 20 patients with chest pain and normal coronary angiography (23) and reported correlations between PFR and age, EF, and HR similar to those observed in our study. Additionally, they observed an intermediate correlation between TTPF and age. The relationship between PFR and aging has also been reported in other previous studies of GBPS in the literature (25,26). In our study, a decrease of PFR with aging was observed, whereas TTPF did not show any correlation with age.
Previous studies have also evaluated DFx parameters derived from gated MPS using 99mTc-labeled radiopharmaceuticals. Several studies have shown that these measurements correlate well with those observed with GBPS in patients with various cardiac diseases (15,16,18,27). None of these previous studies, however, has studied the range of values found in patients without evidence of cardiac disease and their relationship with clinical and SFx variables.
We observed a lower mean PFR value in men. Sex differences in SFx parameters were previously reported by Sharir et al. and others (28–30), with EDV being smaller and EF being higher in women than that in men using gated MPS. Although these observations suggest that sex adjustment may also be needed for optimal interpretation of the DFx parameters measured by gated MPS, they may simply be the result of lower volumes and higher EF found in women.
Temporal undersampling can adversely affect functional measurements (7). In general, it has long been stated that accurate assessment of DFx requires a greater number of frames per cardiac cycle than assessment of SFx (14,31,32), with 32 frames recommended (15,17). However, to obtain adequate counts for evaluation of DFx in a 32-frame gated MPS would require longer acquisitions than gated blood-pool imaging due to the lower counting rates, potentially exceeding 30 min with conventional 99mTc doses. A recent study has suggested that the impact of fewer frames on these measurements may be less than previously thought. Paul et al. (27) studied the effect of the number of frames on SFx and DFx assessment with planar GBPS. Using data acquired at 32 frames per cycle in 19 patients, they subsampled 8 volume points at regular intervals to generate multiple 8-frame volume curves. Although there was an underestimation of DFx parameters in 8-frame GBPS, the values still correlated fairly well with 32-frame GBPS. These results were used to support their routine clinical observations using 10 frames/cardiac cycle tetrofosmin data both at rest and after bicycle stress showing significant reductions in PFR and prolongation of TTPF in patients with ischemia. Since the values that we observed in our population were similar to previously reported values from GBPS studies with higher frame rates, we consider it likely that 16-frame data may suffice for providing adequate temporal resolution to assess DFx. It is worthy of note that, in our protocol, there is no extra acquisition time over that used for 8-frame gating.
Since variations in HR preferentially affect diastolic rather than systolic time intervals, they can profoundly affect DFx measurements. It is widely believed that accurate assessment of DFx must use bad-beat rejection (22). Most of the prior gated MPS studies of DFx used a narrow R–R acceptance window (15%–20%) in their gating acquisition (16,18,27). Our study represents “real-world” conditions in which bad-beat rejection of gated MPS with narrow R–R acceptance window data is not routinely applied, providing a framework for evaluating DFx assessment from standard gated MPS clinical protocols. Although we excluded patients with bundle branch block and observed arrhythmia, the beat length variation in normal individuals at rest could be sufficient to reduce the accuracy of DFx assessments. Additionally, imaging was performed early after maximal exercise; increasing the possibility that HR might have varied during the acquisition. Nonetheless, the ranges of the PFR and TTPF observed were not substantially different from those reported in studies acquired at rest and under more ideal conditions (23,24). Our findings suggest that useful assessment of DFx with 16-frame gated MPS may be possible even without a narrow R–R acceptance window. Nonetheless, if it becomes possible to acquire data routinely with bad-beat rejection while not unduly prolonging the time of imaging through the use of a buffer frame (33), these measurements are likely to become of greater clinical value.
Although previous studies have indicated that PFR varies with other parameters, such as HR, EDV, ESV, LVEF, and age, TTPF appears to demonstrate less variability. Miller et al. showed that TTPF varies slightly with HR, and does not significantly correlate with age, but that PFR shows significant correlations with both of these parameters (26). Iskandrian and Hakki also did not find any significant relation between TTPF and aging, in contrast to PFR (25). Muntinga et al. found no significant correlation of TTPF with HR and LVEF; however, they observed an intermediate correlation between TTPF and age (23). In our study, TTPF did not vary as a function of SFx, HR, or age. Conceptually, it is reasonable that there would be less variation of the TTPF even with variations in beat length without bad-beat rejection, whereas lack of an arrhythmia filter would be expected to have a greater effect on PFR as noted. Our findings suggest that the use of TTPF as the primary DFx variable may allow useful assessment of gated MPS without any adjustments for SFx, HR, and age, even when acquired with 16-frame protocols without bad-beat rejection, which are commonly used. However, the effectiveness of this parameter for clinical purposes should be further evaluated in studies comparing normal populations with abnormal populations where abnormal DFx indices are expected. Furthermore, these data need to be applied and validated in CAD patients and patients with various degrees of systolic dysfunction. Additionally, it would be of interest to assess TTPF and other gated SPECT DFx parameters at rest, particularly in cases where ischemic stunning is present, to determine whether these assessments of resting diastolic dysfunction provide a predictor of stress-induced abnormality.
The major limitation of our study is that we did not use bad-beat rejection; our acquisition protocol was a standard clinical routine, using an R–R acceptance window set to 100%. This factor may reduce the accuracy of the DFx measurements and could reduce the ability of this approach to detect early diastolic dysfunction; however, our findings that TTPF does not appear to be affected by HR suggest that TTPF may be less affected by the absence of bad-beat rejection. The patients in this study were not healthy volunteers but were referred to rule out CAD and were found to have a low likelihood of CAD on the basis of testing. Thus, the population was clinically homogeneous and was similar to the population that we initially proposed and others have commonly used as an alternative to the “normal cath” population (34). Though we consider this an advantage by not representing “the wellest of the well,” some of these patients may actually have had diastolic dysfunction during exercise.
Finally, we had not performed a head-to-head comparison with the gold standard blood-pool studies in our population. However, when the mean values derived from our poststress data were compared with the gated blood-pool studies in the literature, it was observed that the evaluation of DFx using 16-frame gated stress 99mTc MPS is feasible and is in accordance with the published data. Determination of the degree to which standard 16-frame gated MPS acquisitions can be useful clinically would require further study of patients with both normal and abnormal DFx.
CONCLUSION
With a new algorithm, assessments of LV DFx can be performed with 16-frame gated MPS using QGS even without bad-beat rejection, resulting in normal limits similar to those reported with gated blood-pool studies. Because of the dependency of PFR on SFx parameters, HR, and age, TTPF appears to be a more stable parameter with this approach, independent of the influence of other clinical factors. The clinical usefulness of these findings requires further study.
Acknowledgments
The algorithm described in this work is owned by Cedars-Sinai Medical Center, which receives royalties from its licensing. A minority portion of those royalties is shared by the authors (Daniel S. Berman, Guido Germano, Paul B. Kavanagh).
Footnotes
Received Oct. 5, 2004; revision accepted Mar. 23, 2005.
For correspondence or reprints contact: Daniel S. Berman, MD, Cardiac Imaging, Cedars-Sinai Medical Center, 8700 Beverly Blvd., Taper Bldg. 1258, Los Angeles, CA 90048.
E-mail: bermand{at}cshs.org
REFERENCES
In this issue


Jump to section
Related Articles
Cited By...
- Quantitative Clinical Nuclear Cardiology, Part 1: Established Applications
- Presence of Postsystolic Shortening Increases the Likelihood of Coronary Artery Disease: A Rest Electrocardiography-Gated Myocardial Perfusion SPECT Study
- Automated Segmentation of Routine Clinical Cardiac Magnetic Resonance Imaging for Assessment of Left Ventricular Diastolic Dysfunction
- Automatic Global and Regional Phase Analysis from Gated Myocardial Perfusion SPECT Imaging: Application to the Characterization of Ventricular Contraction in Patients with Left Bundle Branch Block
- Diastolic Filling Parameters Derived from Myocardial Perfusion Imaging Can Predict Left Ventricular End-Diastolic Pressure at Subsequent Cardiac Catheterization