


Abstract
3′-Deoxy-3′-18F-fluorothymidine (18F-FLT) is a PET imaging agent that shows promise for studying cellular proliferation in human cancers. FLT is a nucleoside analog that enters cells and is phosphorylated by human thymidine kinase 1, but the 3′ substitution prevents further incorporation into DNA. We estimated the radiation dosimetry for this tracer from data gathered in patient studies. Methods: Time-dependent tissue concentrations of radioactivity were determined from blood samples and PET images of 18 patients after intravenous injection of 18F-FLT. Radiation-absorbed doses were calculated using the MIRD Committee methods, taking into account variations that were based on the distribution of activities observed in the individual patients. Effective dose equivalent (EDE) was calculated using International Commission on Radiological Protection Publication 60 tissue weighting factors for the standard man and woman. Results: For a single bladder voiding at 6 h after 18F-FLT injection, the 18F-FLT EDE (mean ± SD) was 0.028 ± 0.012 mSv/MBq (103 ± 43 mrem/mCi) for a standard male patient and 0.033 ± 0.012 mSv/MBq (121 ± 43 mrem/mCi) for a standard female patient. The organ that received the highest dose was the bladder (male, 0.179 mGy/MBq [662 mrad/mCi]; female, 0.174 mGy/MBq [646 mrad/mCi]), followed by the liver (male, 0.045 mGy/MBq [167 mrad/mCi]; female, 0.064 mGy/MBq [238 mrad/mCi]), the kidneys (male, 0.035 mGy/MBq [131 mrad/mCi]; female, 0.042 mGy/MBq [155 mrad/mCi]), and the bone marrow (male, 0.024 mGy/MBq [89 mrad/mCi]; female, 0.033 mGy/MBq [122 mrad/mCi]). Conclusion: Organ dose estimates for 18F-FLT are comparable to those associated with other commonly performed nuclear medicine tests, and the potential radiation risks associated with 18F-FLT PET imaging are within accepted limits.
A new radioactive tracer, 3′-deoxy-3′-18F-fluorothymidine (18F-FLT), is used to evaluate cellular proliferation in tumors (1–5). Accurate radiation dosimetry of 18F-FLT is needed to evaluate the radiation-related risks associated with PET imaging with this new tracer. Initial dosimetric estimates for 18F-FLT were reported from primate imaging (6), but no human data have been published. We report human estimates of the radiation dose to various organs and to the whole body. These are computed from time-activity curves of blood and normal tissue from PET studies of patients with known or suspected lung cancer and calculated according to recommendations of the MIRD Committee and the International Commission on Radiological Protection (ICRP) (7–12)
MATERIALS AND METHODS
Human Subjects
Eighteen patients (11 men, 7 women) with known or suspected lung cancer were prospectively studied with 18F-FLT PET imaging at the University of Washington from March 2000 to April 2002. Biodistribution data from these 18 18F-FLT patient studies were used for dosimetry estimates. The age range was 45–81 y (mean, 66 y) for men and 46–75 y (mean, 62 y) for women. The weight range was 54–126 kg (mean, 83 kg) for men and 46–113 kg (mean, 75 kg) for women. All female subjects were postmenopausal. One 45-y-old female patient had undergone a bilateral oophorectomy but no hysterectomy; another patient had undergone a hysterectomy only. The normal tissues in the imaging data that were used for dosimetry were distant from the site of any known tumor. 18F-FLT imaging was conducted with protocols approved by the University of Washington Human Subjects and Radiation Safety Committee. Informed consent was obtained from all patients before imaging studies were performed.
Radiopharmaceutical Synthesis
18F-FLT was prepared according to the method described by Grierson and Shields (2). 18F-FLT specific activity was >37 GBq/μmol (>1 Ci/μmol) decay corrected to the end of cyclotron bombardment. Before administration of each dose, quality control testing for pH (7 ± 1) and radiochemical purity (>99%, by high-pressure liquid chromatography and by thin-layer chromatography) was ensured (2). All doses administered were also shown to be endotoxin free (<0.4 endotoxin unit [EU]/mL by the Limulus amebocyte lysate assay). Sterility testing for anaerobic and aerobic bacterial contamination was performed on all batch dose samples, after radioactive decay (24 h). 18F-FLT was administered to patients by intravenous injection (10 mL solution of isotonic saline containing <10% [v/v] ethanol [USP]). Calculation of doses was based on patient weight (2.59 MBq/kg [0.07 mCi/kg]), with a 185-MBq (5 mCi) maximum dose.
Collection of Imaging Data
All PET studies were performed on an Advance PET tomograph (General Electric Medical Systems). Performance details for the tomograph have been reported previously (13,14). 18F-FLT imaging was performed as part of a study of primary lung tumor cellular proliferation rate. No dietary preparation was asked of the patients before tracer administration. After informed consent was obtained, 2 intravenous catheters or an intravenous and an intraarterial catheter were placed in opposite arms. The tracer was administered through the first venous catheter and the other catheter (venous or radial arterial) was used for blood sampling. Arterial sampling was performed with an automated sampler described previously (15). Venous sampling was performed manually. Blood sampling was done as part of our protocol, but not used for dosimetry calculations. During the course of the study, patients were hydrated with 500 mL of intravenous isotonic saline. All patients had normal renal function by medical history and as demonstrated by normal creatinine and normal blood urea nitrogen levels before PET. Patients were placed supine in the scanner with the lung lesion and a portion of the left ventricular blood pool positioned to fit within the 15-cm-wide tomograph field of view (FOV). Imaging started with a 20- to 25-min transmission scan performed over the selected FOV. An additional 10- to 15-min transmission scan was performed over a second FOV, if one was imaged. Subsequently, an 18F-FLT dose of 2.59 MBq/kg (0.07 mCi/kg) of patient weight (not to exceed 185 MBq [5.0 mCi]) was infused intravenously over 1 min using an infusion pump (Harvard Apparatus). A 2-h dynamic emission scan was performed over the selected thoracic FOV starting 1 min before tracer infusion (The last 4 patients underwent only 1.5 h of dynamic imaging.). Two separate dynamic imaging sequences were used: either single or 2-FOV sequences. The imaging sequence for a single FOV protocol was eight 15-s, four 30-s, six 1-min, two 5-min, and ten 10-min imaging intervals. The imaging sequence for a 2-FOV (FOV1 and FOV2) protocol was four 25-s, three 50-s, three 2-min, and 10 5-min imaging intervals for FOV1 and four 25-s, three 50-s, three 2-min, and nine 5-min imaging intervals for FOV2. FOV1 imaging and FOV2 imaging were interleaved from the start of imaging with 15-s intervals taken to move between the 2 FOVs. This allowed us to obtain quantitative kinetic tracer uptake curves in the thorax region containing the primary tumor (FOV1) and within another region (FOV2) for dosimetry studies. The additional FOV was the pelvis in 6 patients (bladder, ovary, and testicular dosimetric information), the testes without the bladder in 1, the brain in 1, and the entire abdomen in 2 patients. Upper abdominal imaging was included within the thoracic FOV1 for patients with a thoracic lung lesion located in the lower lungs. Urine was collected at the end of each study.
All studies were collected in 2-dimensional imaging mode (35 slices of 4.25-mm thickness within a 15-cm axial FOV). Real-time randoms correction using counts obtained with a delayed coincidence window and deconvolution-based scatter corrections were applied. The raw PET data were reconstructed using the standard filtered backprojection available on the Advance PET system. The following reconstruction parameters were used: 12-mm Hanning filter, 55-cm image diameter, and 128 × 128 array size.
Calibration of the PET scanner was performed weekly. Vials containing a known quantity of 18F assayed in a dose calibrator (Capintec model CRC-12) were imaged in the PET scanner. Vial images were reconstructed using the same parameters as used in patient studies. This allowed estimation of radiotracer concentrations (in Bq/mL) from region-of-interest (ROI) analysis of images.
Calculation of Tissue Time-Activity Curves
ROIs were manually drawn within the boundaries of normal organs. Organ boundaries were determined using any of the following images, or combination of: summed emission images, summed attenuation-corrected images, transmission images, and CT images. CT of the thorax and upper abdomen was available for all patients. If an organ was identifiable from attenuation images and CT, ROIs were drawn within its boundaries even if only minimal 18F-FLT accumulation was present. Blood time-activity curves were obtained from imaged blood-pool activity using ROIs of at least 16 pixels (2.89 cm2 equivalent) placed in the center of the left ventricle on each of 3 adjacent imaging planes (16). This approach has been previously validated against arterial sampling (17). Red marrow ROIs of at least 16 pixels were placed over 3 adjacent vertebral bodies, selecting vertebral bodies with the highest uptake. This approach was selected to minimize partial-volume effects. As with other organs, bladder time-activity curves were generated by placing a large ROI within the boundaries of the bladder without attempting to include the entire bladder volume. For each time interval of a dynamic scan, data from each ROI in counts/pixel were corrected for image duration and tomograph efficiency using the calibration vial data and then converted to units of Bq/mL. Lung activity was corrected for tissue density using a density value of 0.33 g/mL (18). The density of other organs was assumed to be 1.0 g/mL. Time-activity curves were normalized to a 37-MBq (1 mCi) injection in a 73.7-kg man and a 56.8-kg woman (average weight W̅) as previously reported (19): Eq. 1 where C′(t) = corrected activity concentration at time t after injection (MBq/g), C(t) = activity concentration at time t after injection (MBq/mL), ID = administered activity (MBq), W = patient weight (kg), W̅ = 73.7 or 56.8 kg, and ρ = organ density (g/mL).
The integrated activity concentrations (C̃) were calculated for all organ ROIs using trapezoidal integration over time applied to the corrected time-activity curves over the duration of the dynamic dataset. Integration past the last data point assumed physical decay of the 18F label without biologic clearance. The mean C̃ used in the dosimetry estimates was the average of the individual integrated curves (Bq-h/g). For the bladder, a curve fit of the 5 decay-corrected bladder time-activity curves available (3 men, 2 women) was calculated and evaluated for dosimetry. The following function used to fit these data has been described in a previous dosimetry analysis (20): Eq. 2
Eq. 2
The “Solver-Add In” function in EXCEL (Microsoft, Inc.) was used to minimize the sum of the squares of the differences between the fitting function and the data for each of the 5 time-activity curves. This bladder time-activity curve fit was then integrated over time, and the decay reapplied. A curve-fitting method was used to properly account for any outlying bladder time-activity curve and to allow calculation of urine reaccumulation after voiding. To test the effect of voiding on bladder dosimetry, 2 voiding scenarios were evaluated and applied to both male and female dosimetry estimations. The first scenario is very conservative, whereas the second has a more realistic voiding scheme.
Scenario 1.
Single bladder voiding at 6 h after 18F-FLT administration with a 10% postvoiding bladder residual decayed to infinity. This scenario assumed no urine reaccumulation after 6 h.
Scenario 2.
First bladder voiding at 2 h after 18F-FLT administration with a 10% postvoiding residual; urine reaccumulation between 2 and 6 h at a rate determined by the bladder curve fit; second bladder voiding at 6 h with a 10% postvoiding residual decayed to infinity. This scenario assumed no urine reaccumulation after 6 h.
For organs other than the bladder, average integrated concentration activity for each organ was obtained from the mean of values from individual patients. The ANOVA is described later.
Total cumulated activity in each organ (Ã) was then calculated by assuming uniform distribution of activity throughout the organ and multiplying the integrated activity concentration curves (Bq-h/g) by the standard male or female reference organ weights (21). For each organ, the residence time was calculated according to the formula: Eq. 3 where A0 represents a standard 37-MBq dose.
The remainder of the injected activity not accounted for by source organs or voiding was assumed to be uniformly distributed in non-source organ tissues for a standard 73.7-kg man and a 56.8-kg woman in proportion to their weights (21). This is consistent with the uniform uptake of 18F-FLT seen on PET images outside of source organs and lung tumors. By carrying out the time-integration to infinity, the total cumulated activity for a 37-MBq injection is 97.7 MBq-h (18F half-life, 109.8 min). Because patient voiding took place, the cumulated activity in the remainder of the body was calculated as 97.7 MBq-h minus the sum of the cumulated source organ activities and the cumulated voided activity. The cumulated voided activity was calculated by time-integration of the voided activity (90% of bladder content at time of voiding) from time of voiding to infinity.
Radiation Dosimetry Calculation
The distribution of absorbed dose was calculated according to the MIRD method (7–11) using the S values provided by the MIRDOSE3 software (ORISE; Oak Ridge, TN) (10). The MIRD method assumes that the integrated activity is known for each of the source organs. Observed source organs where 18F-FLT was concentrated were the urinary bladder, liver, kidneys, and bone marrow. Other organs for which anatomic boundaries could be identified using a combination of the 18F-FLT emission scan, the attenuation scan, and the comparison CT scan were used as additional source organs for completion. In this study, we included as source organs adrenals, brain, lower large intestine, stomach, blood, heart wall, kidney, liver, lung, pancreas, red marrow, spleen, urinary bladder, and testes (for men); and brain, breast, lower large intestine, stomach, blood, heart wall, kidney, liver, lung, red marrow, spleen, and urinary bladder (for women). Organs within which no 18F-FLT uptake above background was observed and for which boundaries could not be delineated were treated as background and assigned the remainder level of cumulated activity. This included the ovaries and the uterus in women. One female patient had not undergone an oophorectomy so that images of the pelvis for ovarian uptake could be acquired, but no uptake was identified. Pelvic imaging did not reveal any uterine uptake of 18F-FLT above background in the single female patient who had not undergone a hysterectomy. No 18F-FLT uptake was identified in the duodenum or small bowel. No 18F-FLT accumulation was present in the gallbladder.
Because there are no reported S values for dose to the ocular lens, lens dose was estimated as previously described (20). ROIs placed over the eye with the help of the PET transmission scan showed no 18F-FLT accumulation. For all source organs other than the brain, S values for the thyroid gland were used as S values from other source organs to the lens of the eye. No activity above background was observed within the brain and, therefore, the brain-to-lens S value was applied as previously reported (20). Because brain uptake was at background level, this had a small impact on the total lens dose. This approach will overestimate lens dose because the thyroid is closer to source organs than is the eye.
The range of organ doses was estimated from the variation in integrated source organ values (Ã) that were assumed to follow a gaussian distribution. The SD of the dose to the individual organs was calculated according to an established method (22) and as reported in a previous dosimetry analysis (19): Eq. 4 where σDi is the SD of the estimated dose for the ith organ, σj is the SD of the integrated activity for the jth source organ, Sij is the S value for the dose to the ith target organ from the jth source organ, and Wj is the weight of the jth source organ.
For source organs with only one Ã, SD was calculated in proportion to the SD of the remainder of the body with the exception of the kidney in female patients. To better reflect variability of female kidney dosimetry, we pooled the kidney data (Ã) for the men (n = 3) and woman (n = 1).
Effective Dose Equivalent
The effective dose equivalent (EDE) for uniform whole-body exposure was calculated for both male and female weights (21), assuming a relative biologic effectiveness of 1.0 and following the procedure described in Addendum 1 to ICRP Publication 53 (23). The dose estimates for the gonads, breast, red bone marrow, lungs, thyroid, bone surfaces, and remainder of body were multiplied by their appropriate weighting factors (0.25, 0.15, 0.12, 0.12, 0.03, 0.03, and 0.30, respectively) and summed to calculate the EDE. The weighting factor for the remainder was divided equally among the 5 remaining organs and tissues receiving the highest dose equivalent (weight of 0.06 per organ). For men, these were the urinary bladder wall, liver, kidneys, pancreas, and adrenal glands; for women, these were the urinary bladder wall, liver, kidneys, spleen, and uterus.
RESULTS
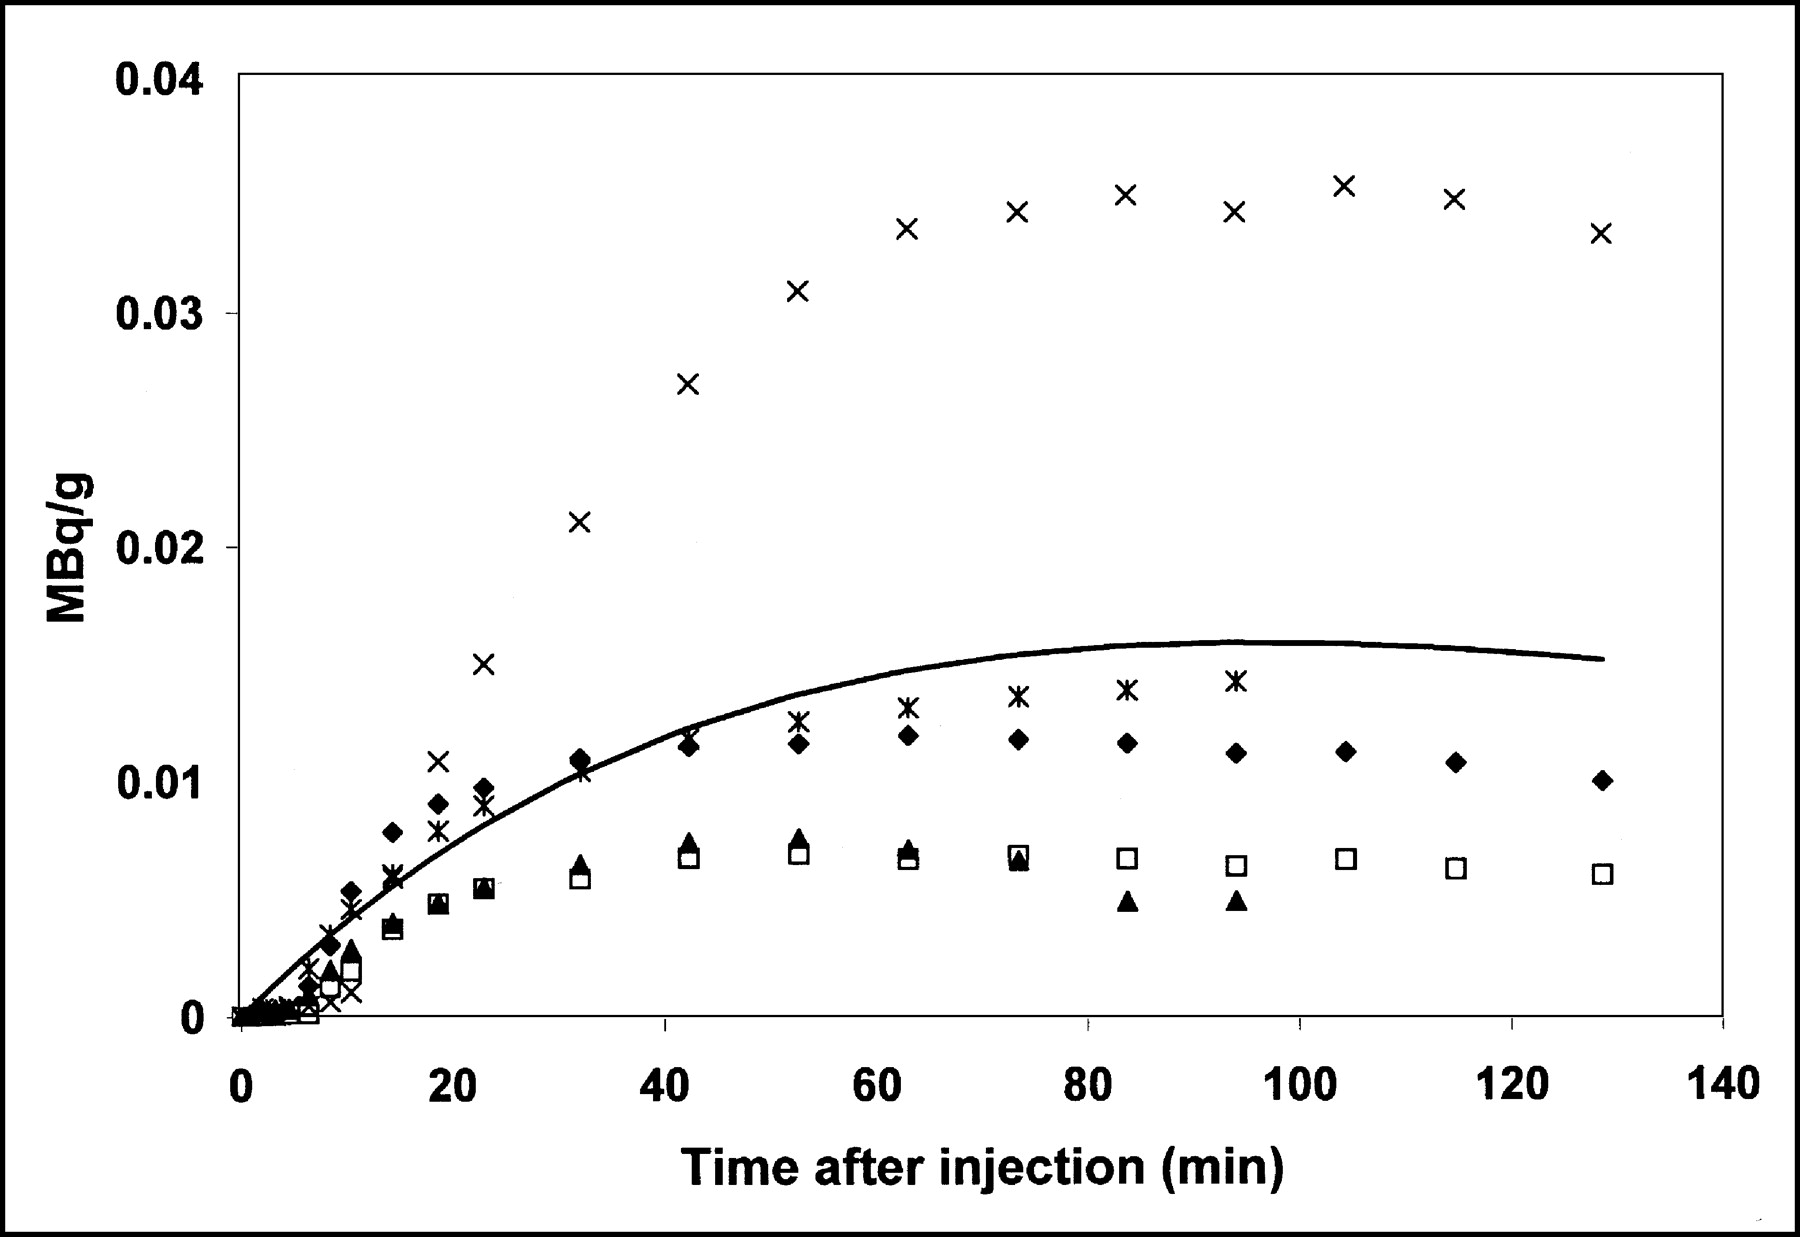
The integrated activity concentrations (C̃), cumulated activities (Ã), and residence times for the source organs are presented in Table 1 (men) and Table 2 (women). Figure 1 presents time-activity curves for the liver, bone marrow, and kidney. All patients had normal urinary output during 18F-FLT imaging. Five fully sampled bladder time-activity curves and the curve fit to these data are presented in Figure 2. The dosimetry calculations and SDs performed for men and women with their respective reference weights and S values were performed for each of the 2 bladder voiding scenarios described above (Table 3 [men] and Table 4 [women]).

Time-activity curves for 3 source organs (liver, marrow, kidney) in 1 patient normalized to 37-MBq injected dose of 18F-FLT and to 73.7-kg weight.

Five fully sampled bladder time-activity curves and curve fit to data. Each patient is represented by a different symbol. Solid line represents data fit calculated according to Equation 2.
Cumulated Activity and Residence Time of 18F-FLT for 37-MBq Injection and Standard Man
Cumulated Activity and Residence Time of 18F-FLT for 37-MBq Injection and Standard Woman
Mean Organ Doses for 2 Different Bladder Voiding Scenarios: Man
Mean Organ Doses for 2 Different Bladder Voiding Scenarios: Woman
The mean dose and SD for a single 6-h voiding are presented in Table 3 for men and in Table 4 for women. The critical organ is the urinary bladder receiving an average dose of 0.179 mGy/MBq (662 mrad/mCi) in men and 0.174 mGy/MBq (646 mrad/mCi) in women. The EDE (mean ± SD) for this single 6-h voiding was 0.028 ± 0.012 mSv/MBq (103 ± 43 mrem/mCi) for a male patient and 0.033 ± 0.012 mSv/MBq (121 ± 43 mrem/mCi) for a female patient.
DISCUSSION
This study estimated the radiation-absorbed dose resulting from the intravenous injection of 18F-FLT to define the radiation risk associated with PET imaging. Several assumptions were made in analyzing the imaging data. Tracer distribution was assumed to be homogeneous throughout each organ. During dynamic PET imaging, both biologic and physical decay mechanisms affecting tracer clearance were considered. For times past the end of imaging, tracer clearance was assumed to occur only by physical decay. This conservative assumption should result in an overestimation of the calculated radiation exposure.
Two different bladder voiding scenarios were used to estimate the impact of voiding on the overall radiation exposure. The first and most conservative scenario in which the patient only voids at 6 h after 18F-FLT injection yields the highest estimated bladder dose. In the second scenario, voiding is performed both at 2 and 6 h after 18F-FLT injection, and reaccumulation of urine between 2 and 6 h is accounted for. This results in a reduction of the bladder dose by >50% when compared with a single voiding at 6 h. These estimations show that requesting a patient to void at the end of imaging before leaving the nuclear medicine suite is beneficial and should be encouraged. In addition, clinical practice with 18F-FDG PET has shown that most patients need to void at the end of imaging, especially if hydrated with intravenous fluids. The urinary bladder wall dose for a 185-MBq (5 mCi) 18F-FLT injection and voiding at 2 and 6 h is 1,465 mrad and 1,435 mrad for men and women, respectively. The urinary bladder wall dose for a 185-MBq (5 mCi) 18F-FLT injection and a conservative 6-h voiding is 3,310 mrad and 3,230 mrad for men and women, respectively. These values are to be compared with the bladder dose of 2,700 mrad for a standard 370-MBq (10 mCi) injection of 18F-FDG and a 2-h voiding as recently reported by Hays et al. (24).
Tables 1 for men and 2 for women show a larger SD for the integrated time-activity curves for the bladder in comparison with other organs. Because patients did not void during the dynamic scan, the large variance in the bladder time-activity curves is likely to be a result of variability in urinary clearance, with 1 patient having a time-activity curve peak 3 times that of the other 4 patients.
CONCLUSION
The individual organ and total-body doses associated with 18F-FLT PET are comparable to or lower than those reported for other widely used clinical nuclear medicine procedures (7,11,24–26). They are well below the maximum suggested individual study and annual total-body doses of 30 and 50 mGy, respectively, suggested for investigational radiopharmaceuticals by the Food and Drug Administration (27). However, when performing serial 18F-FLT imaging studies to assess tumor response to therapy, care should be given to remain well within the allowed annual limits. This can be accomplished by ensuring adequate voiding by patients. Ongoing investigations using 18F-FLT PET will establish its appropriate role as a proliferation tracer. Our data suggest that a maximum dose of approximately 185 MBq (5 mCi) is adequate for imaging studies. This analysis shows that the radiation-absorbed dose resulting from 18F-FLT PET is favorable for further use of this imaging agent.
Acknowledgments
The authors thank Dr. Jeanne Link for her insightful comments, the PET technologists (Pam Pham, Barbara Lewellen, Colin Alden, Tina Lauson, Carrie Gurule, Nathan Roybal, Jackie Hansen, and Michelle Wanner) for technical assistance, Drs. Tom Lewellen, Paul Kinahan, Robert Miyoka, and Marie Janes for tomograph support, and Linda Wiens for database support. This work was supported by the National Institutes of Health through National Cancer Institute grants CA80907 and CA42045.
Footnotes
Received Nov. 4, 2002; revision accepted May 20, 2003.
For correspondence or reprints contact: Hubert Vesselle, PhD, MD, Department of Radiology, Division of Nuclear Medicine, Box 356113, University of Washington Medical Center, 1959 N.E. Pacific St., Seattle, WA 98195.
E-mail: vesselle{at}u.washington.edu
REFERENCES
In this issue


Jump to section
Related Articles
Cited By...
- First-in-Human PET Imaging and Estimated Radiation Dosimetry of L-[5-11C]-Glutamine in Patients with Metastatic Colorectal Cancer
- FAPI-74 PET/CT Using Either 18F-AlF or Cold-Kit 68Ga Labeling: Biodistribution, Radiation Dosimetry, and Tumor Delineation in Lung Cancer Patients
- Effect of Androgen on Normal Biodistribution of [18F]-2-Fluoro-5-methyl-1-beta-D-arabinofuranosyluracil (18F-FMAU) in Athymic Non-tumor-bearing Male Mice
- PET of Glucose Metabolism and Cellular Proliferation in Prostate Cancer
- 3'-Deoxy-3'-18F-Fluorothymidine PET for the Early Prediction of Response to Leucovorin, 5-Fluorouracil, and Oxaliplatin Therapy in Patients with Metastatic Colorectal Cancer
- (S)-4-(3-18F-Fluoropropyl)-L-Glutamic Acid: An 18F-Labeled Tumor-Specific Probe for PET/CT Imaging--Dosimetry
- 4'-[Methyl-11C]-Thiothymidine PET/CT for Proliferation Imaging in Non-Small Cell Lung Cancer
- [18F]-3'Deoxy-3'-Fluorothymidine Positron Emission Tomography and Breast Cancer Response to Docetaxel
- Whole-Body Distribution and Brain Tumor Imaging with 11C-4DST: A Pilot Study
- 18F-ML-10, a PET Tracer for Apoptosis: First Human Study
- Fetal Dose Estimates for 18F-Fluoro-L-Thymidine Using a Pregnant Monkey Model
- Whole-Body Biodistribution and Radiation Dosimetry of the Human Cannabinoid Type-1 Receptor Ligand 18F-MK-9470 in Healthy Subjects
- A Multicenter Clinical Trial on the Diagnostic Value of Dual-Tracer PET/CT in Pulmonary Lesions Using 3'-Deoxy-3'-18F-Fluorothymidine and 18F-FDG
- PET-Based Human Dosimetry of 18F-Galacto-RGD, a New Radiotracer for Imaging {alpha}v{beta}3 Expression
- Kinetic Analysis of 3'-Deoxy-3'-Fluorothymidine PET Studies: Validation Studies in Patients with Lung Cancer