


Abstract
The cannabinoid type-1 (CB1) receptor is one of the most abundant G-coupled protein receptors in the human body and is responsible for signal transduction of both endogenous and exogenous cannabinoids. The endocannabinoid system is strongly implicated in regulation of homeostasis and several neuropsychiatric disorders, obesity, and associated comorbidities, such as dyslipidemia and metabolic syndrome. We have used whole-body PET/CT to characterize the biodistribution and dosimetry of a novel high-affinity, subtype-selective radioligand, 18F-MK-9470, in healthy male and female subjects. Methods: Eight nonobese subjects (5 men, 3 women; age, 22–54 y) underwent serial whole-body PET/CT for 6 h after a bolus injection of 251 ± 25 MBq 18F-MK-9470 (N-[2-(3-cyano-phenyl)-3-(4-(2-18F-fluorethoxy)phenyl)-1-methylpropyl]-2-(5-methyl-2-pyridyloxy)-2-methylproponamide). Source organs were delineated 3-dimensionally using the combined morphologic and functional data. Residence times were derived from time–activity profiles using both the trapezoid rule and curve fitting. Individual organ doses and effective doses were determined using the OLINDA software package, with different approaches for gastrointestinal and urinary excretion modeling. Results: 18F-MK-9470 is taken up slowly in the brain, reaching a plateau at approximately 90–120 min after bolus injection and is excreted predominantly through the hepatobiliary system. The gallbladder, upper large intestine, small intestine, and liver are the organs with the highest absorbed dose (average: 159, 98, 87, and 86 μGy/MBq, respectively). The mean effective dose (ED) was 22.8 ± 4.3 μSv/MBq, indicating relatively low intersubject variability and a mean value in the range of many commercially available 18F-labeled radiopharmaceuticals. Brain uptake was relatively high compared with that of existing central nervous system ligands for other receptors, between 3.2% and 4.9% of the injected dose. Conclusion: The estimated radiation burden of 18F-MK-9470 for PET CB1 receptor imaging shows relatively low variability between subjects and has an acceptable ED, which allows multiple serial cerebral scans of good image quality, while remaining within the risk category class II-b defined by the World Health Organization and the International Commission for Radiation Protection for a standard injected activity (185–370 MBq).
The endogenous cannabinoid system modulates multiple physiologic processes in the human body (1) and plays an important role in regulation of food intake, energy homeostasis, motor function, reward, attention, and memory processes in the brain (2–4). Most cannabinoid effects in the central nervous system (CNS) is mediated by the 7 transmembrane domain G-protein coupled cannabinoid type-1 receptor (CB1R), which localized in neurons, astrocytes, microglia, and oligodendrocytes. However, extracerebral expression of CB1R is also found in, among others, adipocytes, the gastrointestinal (GI) tract, thyroid, lungs, kidney, and urinary tract and in elements of the reproductive system in both males and females (2). The predominant mechanism of CB1R-mediated action in the CNS is an intracellular signaling and modulation of synaptic neurotransmission, by presynaptic action of endogenous cannabinoids (e.g., anandamide) on the release of other transmitters—mainly, glutamate, dopamine, and γ-aminobutyric acid (GABA) (5). Unlike classical neurotransmitter systems, endocannabinoids are transiently produced and provide retrograde signaling through the CB1R, which is responsible for fast cerebral adaptations (6). CB1R is currently investigated as the target for drug treatment of obesity and associated comorbidities, such as dyslipidemia and metabolic syndrome, and nicotine addiction (7,8). In vivo imaging of the CB1R using the novel PET tracer 18F-MK-9470 (N-[2-(3-cyano-phenyl)-3-(4-(2-18F-fluorethoxy)phenyl)-1-methylpropyl]-2-(5-methyl-2-pyridyloxy)-2-methylproponamide) is likely to expand our knowledge of various CNS pathophysiologic processes, neuropsychiatric disorders, and metabolic disorders, such as obesity, eating disorders, neurodegeneration, and epilepsy. Furthermore, this may provide a new diagnostic, prognostic, and monitoring biomarker that may enable prediction or evaluation of success or failure of related drug or interventional therapies, such as CB1R inverse agonist therapy for obesity or substance abuse (9–11).
18F-MK-9470 (Merck Research Laboratories [MRL]) (12) is an inverse agonist with high selectivity and specificity for the human CB1R that allows preclinical and human imaging of the CB1R in the brain (13). The primary objective of this study was to examine the whole-body (WB) biodistribution and radiation dosimetry of 18F-MK-9470 in both male and female healthy subjects. As a secondary objective, we investigated the impact of different modeling approaches for residence time estimation and for GI and urinary clearance modeling.
MATERIALS AND METHODS
Healthy Subjects
Healthy subjects were recruited in response to advertisements in local community newspapers and departmental websites. All subjects were screened for neuropsychiatric and other medical disorders and underwent physical examination, blood testing, and urine testing (including toxicology for all major known addictive drugs). Exclusion criteria were as described before (13).
Eight nonobese (body mass index [BMI] < 30) Caucasian healthy subjects (3 women, 5 men; age range, 22–54 y) were included. Demographic data for these subjects are summarized in Table 1. The study was approved by the local Ethics Committee and performed in accordance to the World Medical Association Declaration of Helsinki. Written informed consent was obtained from all volunteers before the study.
Subject Data, Net Injected Activity of 18F-MK-9470, and Individual Effective Dose Estimates
Radiotracer Characteristics and Preparation
18F-MK-9470 (12) is an inverse agonist with high selectivity and specificity for the human CB1R (13). The precursor for tracer synthesis was obtained from MRL, and labeling was performed on-site using 18F-ethylbromide (12). The final product was obtained after high-performance liquid chromatography (HPLC) separation and had a radiochemical purity of >95%. Specific activity was >20 GBq/μmol. The tracer was administered in a sterile solution of 5 mM sodium acetate buffer (pH 5.5) containing 6% ethanol.
PET/CT Procedure
All subjects were fasted for at least 4 h before PET. Because of the hepatobiliary excretion observed in the first subject, the second subject was administered a high-fat meal at 120 min after injection to facilitate gallbladder emptying and, thus, to reduce the radiation-absorbed dose to the gallbladder as well as to estimate the influence of this measure on the calculated effective dose (ED). Because the results of the high-fat meal were negative, as described further, fasting conditions were resumed for subjects 3–8.
Subjects received, on average, 251 MBq (range, 223–290 MBq) of 18F-MK-9470 in a slow intravenous bolus injection (<10 s) under standardized injection conditions (supine, low ambient noise, dimly lit room) through a catheter in an antecubital vein. A dynamic series of WB PET emission scans were started simultaneously on injection. The subjects' head was restrained using a vacuum cushion, and the body was strapped to the bed to minimize movement during the scan. Bed height was kept constant between scanning segments.
The first 2 subjects were scanned in 3-dimensional (3D) mode on an HR+ PET camera (Siemens Medical Solutions, Inc.). The scans consisted of four 7-bed position scan frames from head to midfemoral position, started at 15, 75, 195, and 315 min after injection. Four-minute bed positions were acquired for emission, and 2-min bed positions were acquired per transmission scan. The other 6 subjects were scanned on a 16-slice PET/CT camera (HiRez Biograph 16; Siemens). For these subjects, 8 sequential WB scans from the midfemoral position to the head were conducted over the first 90 min. Two later scans were performed at about 180 and 330 min after injection. A low-dose (80-kV tube potential, 11 effective mA·s), no contrast, WB CT scan was conducted at the beginning of each PET acquisition segment (immediately before tracer injection and at 180 and at 330 min after injection). The calculated additional radiation burden of this low-dose CT was 0.5 mSv per WB scan (as calculated with CT-EXPO (14); Johan Nuyts, written communication, January 2007).
In the first 2 subjects, urine samples were collected and counted after each WB scan—that is, up to 6 h after injection. For γ-counting, an aliquot of 0.2–1 mL was pipetted into a preweighed counting tube and counted in a calibrated γ-counter. Data were expressed as activity per gram (MBq/g) at the time of collection. Because preliminary calculations showed that urinary excretion was limited, urine collection was not continued for the other 6 subjects. The voided activity between scanning segments was estimated by incorporating it into the fitting model (compare residence times and absorbed dose calculations). No feces needed to be collected.
Images from the HiRez Biograph 16 were reconstructed using a 3D OSEM (ordered-subset expectation maximization) iterative reconstruction with 5 iterations and 8 subsets and a postsmoothing with 3D gaussian (6-mm full width at half maximum) (15). Data from the HR+ camera were reconstructed with the 3D reprojection algorithm as provided by the manufacturer. Both reconstructions included model-based scatter as well as attenuation correction based on a measured attenuation map (68Ge source for the HR+ camera; CT for the HiRez Biograph 16). To ensure that the measured injected dose was accurate in terms of measured activity by PET, the dose calibrator was cross-calibrated with the PET cameras.
Volumes of Interest (VOIs)
WB reconstructed data were transferred in DICOM (Digital Imaging and Communications in Medicine) 3.0-part, 10-file format and converted to Analyze using PMOD software (PMOD Inc., Zurich). A dynamic image sequence was created for source organ VOI placement depending on dynamic activity behavior for the various source organs. 3D VOIs were constructed on the PET emission images to include all organ activity, and their position was verified on the corresponding CT images. The following organs showed significant activity at some time point and were included in VOI determinations: brain, heart, lungs, liver, gallbladder, kidneys, axial bone marrow, urinary bladder, and small and large intestine. Axial bone marrow values were used as an estimate for red marrow. The values for the heart were used for the heart wall. Total VOI activity was calculated for each VOI. 3D VOI definitions were used to visually inspect for possible movement artifacts between sequential scans in the same segment. Between scanning segments, subjects were allowed out of the scanner and again positioned for the next segment, so VOI regions were shifted in the coronal plane as the position of the bed height was kept constant. Residual errors were manually corrected by redefining VOIs when necessary. This was only necessary in 2 subjects for the head VOI and in all subjects for the gallbladder content, which showed gradual activity accumulation and enlargement during the course of the scan.
In several subjects, visually significant amounts of tracer retention along the injected venous path from the forearm injection site to the axilla was noted at the earliest time frames (in subject 3, this was 11%; in the others, it was <4% of the total activity), which was slowly incorporated in the body during the first hour (continuous saline infusion of about 100 mL/h). The total injected activity was corrected for this residual activity, and the organ fractions were calculated relative to this corrected total injected activity.
To account for the differences in timing of each bed position, the corresponding acquisition times were calculated for each source organ, taking the bed position of the axial midposition of the organ under consideration on the corresponding CT scout image on which bed positions with spatial overlap are indicated. Specifically, for the axial red marrow, the midlumbar vertebral position was taken as the average time value. In this way, time–activity curves were calculated for each of the source organs indicated earlier.
Residence Time and Absorbed Dose Calculations
The quantified dynamic VOI data were subsequently converted into time–activity curves, and the retention of radioactivity in these regions was used in the biologic modeling of the biodistribution and elimination of the compound. Residence times were computed and normalized to injected activities by calculating the area under the time–activity curve (AUC) of each organ. This was done using both the trapezoidal method up to the termination of acquisitions as well as by curve fitting through the time–activity curves. The uptake in the brain, small intestine (SI), liver, kidneys, red marrow, lungs, and remainder could be modeled: Σi [Ai·(1 − exp(−ln(2)·t/τu,i))·exp(−ln(2)·t/τe,i)], where i = 1 up to a maximum of 3. A is a scaling parameter, τu represents the uptake time parameter, and τe represents the excretion time parameter. The model was fitted to the data by least-squares constraint minimization. For the uptake in the gallbladder, no curve model gave a satisfactory fitting; therefore, only values based on the trapezoid rule were retained for this organ. In the 2 cases in which only 4 data points were available, only 1 sum term was used (i = 1).
To be conservative, the AUC in the case of the trapezoid rule was calculated by assuming only physical decay of 18F after the acquisition of the last image and no additional biologic clearance. The difference of both trapezoidal and curve fitting approaches on residence times and effective dose calculation was assessed.
The absorbed doses reported were calculated using OLINDA (16), according to current ICRP 60 definitions and include radiation-absorbed doses for a maximum of 25 organs, based on the modeled biodistribution data. The ED is calculated from the individual organs doses based on a predefined weighting factor for each of the source organs (17): where Dt is the absorbed organ dose for organ t and wt is the weighting factor. This was calculated for each subject on the MIRD scheme of a 70-kg adult. ED is a measure of stochastic risk associated with exposure to low levels of ionizing radiation.
The residence times for the upper large intestine (ULI), lower large intestine (LLI), and SI were calculated in 2 ways. First, the ICRP 30 GI model (18), as incorporated in OLINDA, was used with the fraction entering the SI as input. This fraction was estimated from the curve fittings of the intestinal VOI. This value was set equal to the largest decay-corrected fraction of injected activity encompassed by the intestinal region of interest.
Second, to investigate the need for curve fitting and input fraction determination, we also used a predefined distribution of residence times—50% for the SI, 25% for the ULI, and 25% for the LLI—and compared ED determinations to the ICRP 30 GI tract model.
Analogously, the updated dynamic bladder model (17) was used to calculate the dose to the bladder wall using curve-fitted parameters. For this purpose, the bladder voiding values were incorporated in the model: Σi = 1,8 A·(1 − exp(−ln(2)·ti/τu)) + (A·(1 − exp(−ln(2)·t9/τu)) + Δvoid1) + (A·(1 − exp(−ln(2)·t10/τu)) + Δvoid2), where ti represents the 10 measured time points; A is the actual uptake in the urinary bladder, τu is the biologic decay, and Δvoid1 and Δvoid2 are the amounts of activity released from the body during voiding between scan sequences.
RESULTS
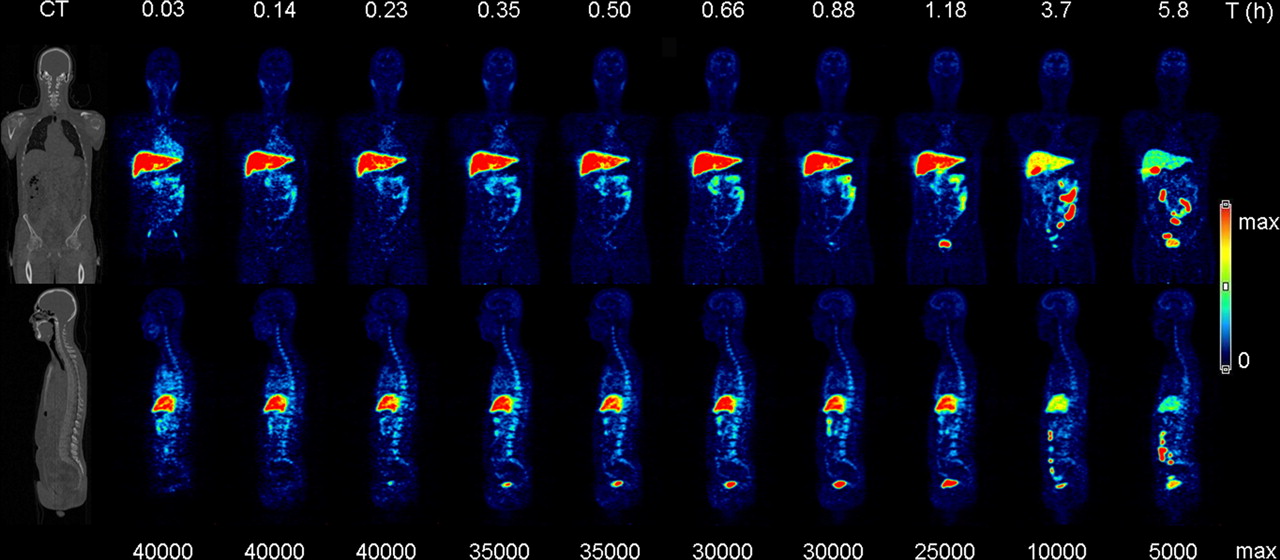
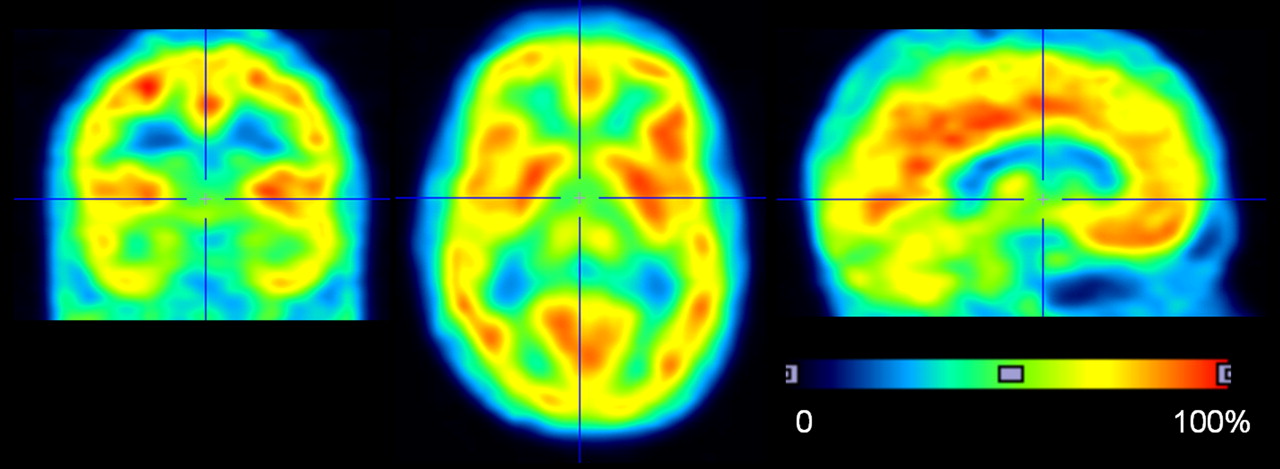
Figure 1 presents an exemplary coronal and sagittal series of emission scans over time (subject 4, Table 1), showing the WB biodistribution and routes of excretion of the tracer and its metabolites on the corresponding CT sections. Figure 2 shows transverse, coronal, and midsagittal slices through the brain of a representative subject (subject 6, summed brain image of WB scans 8 and 9 between 90 min and 4 h after injection). In all subjects, no clearly visible tracer uptake was observed in abdominal or subcutaneous fat tissue. In 1 subject (subject 5), increased tracer uptake was seen in brown fat tissue in the neck and upper thorax region (Supplemental Fig. 1; supplemental material is available online only at http://jnm.snmjournals.org).

WB time–activity distribution of 18F-MK-9470 in subject 4 (Table 1), with representative coronal and sagittal slices as indicated on CT view (far left). PET image color intensities are relative to maximum color table values as indicated in bottom row (Bq/mL), to account for physical tracer decay. Top row indicates start (hours) of the WB scan.

Brain uptake distribution of 18F-MK-9470 (summed images of WB frames 8 and 9) in coronal, transverse, and sagittal sections, indicating the relative cerebral distribution of 18F-MK-9470 binding to CB1R.
Table 2 shows calculated residence times for the 9 source organs with activity above background. Supplemental Figure 2 shows exemplary fits for the time–activity curves for 1 healthy subject. The comparison between curve-fitted and trapezoid rule calculation of residence times showed average differences of 0.6% (±4.6%, higher for the trapezoid rule). There was no significant difference in residence times between men and women for any source organ. The highest variability in residence times was observed for the gallbladder. The mean residence time for all subjects was 0.080 ± 0.062 h, the lowest value was 0.021 h (for subject 2, after ingestion of fatty meal), and the maximum value was 0.222 h (for the subjects without the meal after the first phase of acquisition).
Mean Residence Times ± SD (n = 8) of 18F-MK-9470 for Measured Organs and Remainder of Body
Table 3 summarizes the individual organ doses and individual ED results for all subjects and the mean ± SD values. The gallbladder wall shows the highest organ dose of 0.159 mGy/MBq, followed by the ULI (0.097 mGy/MBq), SI (0.087 mGy/MBq), and liver (0.086 mGy/MBq). Therefore, for a standard injected activity of 185 MBq, no individual organ dose would exceed 200 mGy. There was a high variability in the gallbladder organ absorbed dose, between 0.057 and 0.370 mGy/MBq (SD, 0.094 mGy/MBq). Subject 2 showed a gallbladder dose of 0.088 mGy/MBq, which was in the lower end but not the lowest value of 0.057 observed for subject 8.
Radiation-Absorbed Dose Estimates (OLINDA) Based on ICRP 30 GI Tract Model
Table 1 includes the individual ED values for all subjects. The average ED was 22.8 μSv/MBq (range, 16.4–31.3 μSv/MBq). Subject 2, with gallbladder emptying after the first scanning segment, was within the range of values from the other subjects, indicating that—together with high variability on the specific gallbladder organ absorbed dose values as noted—no significant effect of this intervention was present on the ED. There was no significant difference in the ED between men and women and no changes were observed with age.
Incorporation of the simplified distribution of residence time over the SI, ULI, and LLI resulted in a 9.0% increase in estimations for ED (mean ED, 24.8 μSv/MBq). The urinary bladder clearance model, with 2.4- and 4.8-h voiding intervals, resulted in a 0.8% decrease and a 0.5% increase in ED estimation, respectively. The trapezoidal rule calculation for residence times showed, on average, +2.1% (range, 0.0 to +4.9%) difference in ED calculations compared with curve fittings, with the main difference observed in gallbladder input curves. Overall, this indicates a negligible contribution of the data-processing method on final dose estimates for this tracer.
Figure 3 shows decay-corrected relative time–activity curves for the brain, liver, intestine, gallbladder, and urinary bladder after injection of 18F-MK-9470. Fractional uptake of 18F-MK-9470 in the brain was, on average, 4.0% of the injected activity for the whole group (range, 3.2%–4.9%), reaching a plateau after about 90 min—compatible with the brain time–activity curve profiles observed previously in cerebral CB1 imaging using 18F-MK-9470 (13).
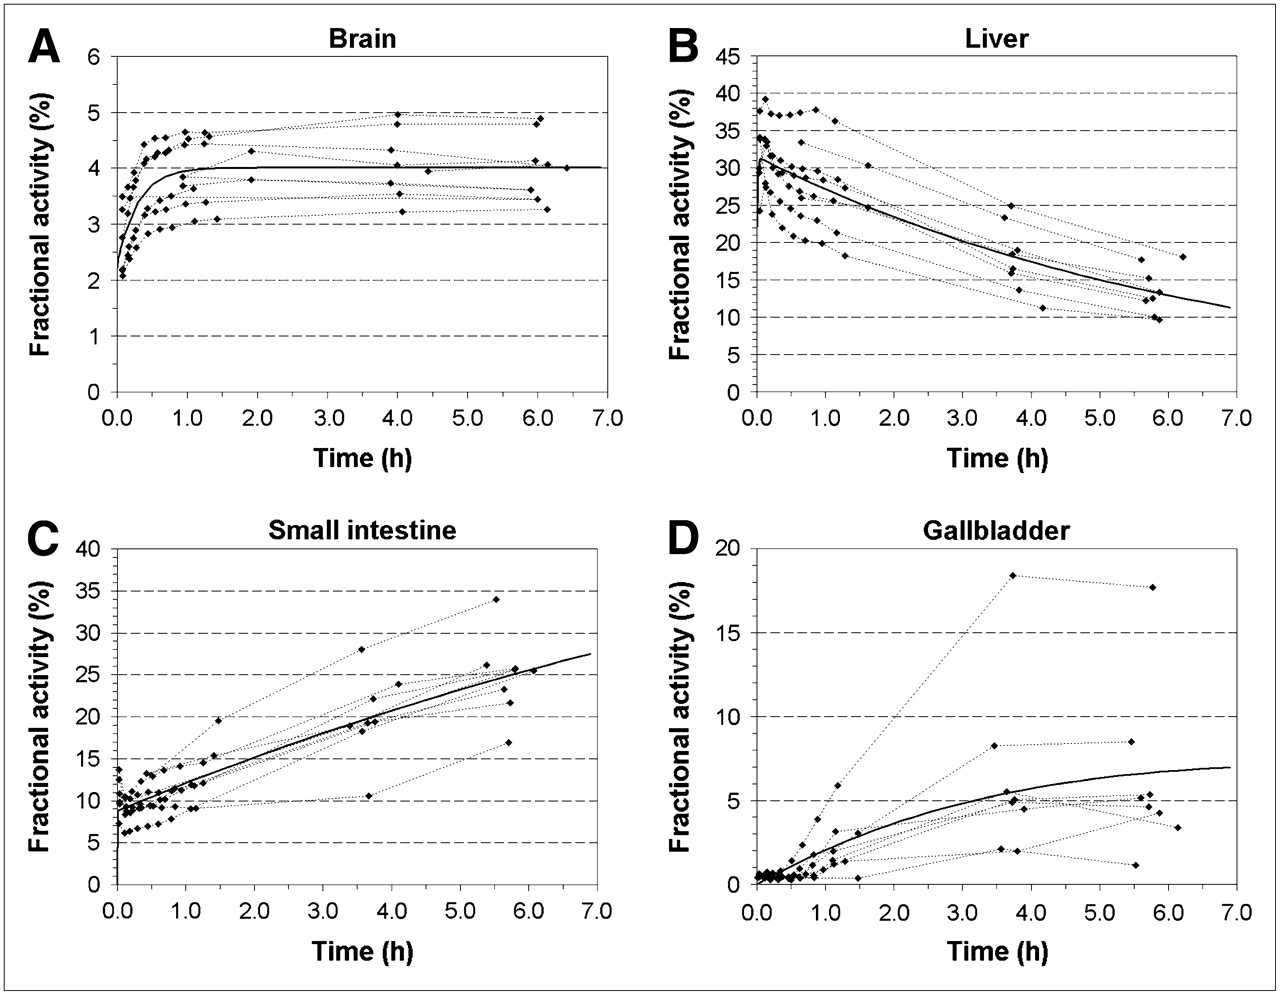
Mean fractional activity with respect to total body activity and curve fits for all subjects for brain (A), liver (B), SI (C), and gallbladder (D).
DISCUSSION
WB serial PET/CT with the CB1R radioligand 18F-MK-9470 resulted in an ED estimate of the tracer of 22.8 μSv/MBq (84.4 mrem/mCi), based on full analysis of 3D apparent organ activity volumes, with no measured differences between male and female and between young and middle-aged subjects.
With regard to biodistribution, CB1Rs have also been described in adipocytes (19); we were unable to identify high uptake of the tracer in fat tissue. In 1 subject (subject 5, BMI = 28.0), slightly increased tracer uptake was seen in brown fat tissue in the neck and upper thorax region as well as in the subcutaneous fat, but time–activity curves showed disappearance of this signal after the first hour following injection, in contrast to the observed kinetics in the brain. In the other, relatively lean subjects, with BMI between 19 and 26, no brown fat uptake was apparent. Because of the predominant hepatobiliary excretion of the tracer, visualization of GI CB1R expression is hampered. Nevertheless, the suspected role of CB1Rs in bowel inflammatory disorders and motility disturbances as well as obesity (1) might still be studied dynamically by early PET in patients to further elucidate possible diagnostic applications of 18F-MK-9470.
It has been shown that analysis time for estimating conservative calculations of radiation dose can be shortened by using regions of interest defined in 2-dimensional compressed images (20). However, we have used classical 3D VOIs that were defined on the functional PET images. Although the 3D approach might be more time-consuming, it avoids the bias derived from organ superposition, which may result in overestimation or underestimation of source organ contributions, especially in the abdomen. In addition, it can make full use of the corresponding CT-based structural organ definitions even at low tracer activity.
We have used PET/CT to establish organ activity in 6 subjects. PET/CT has several other advantages for biodistribution and dosimetry studies of novel tracers apart from organ delineation or verification. The acquisition of WB low-dose CT can take place in about 20 s, in contrast to 14-min repeated transmission scans for 68Ge sources.
The radiation burden of a WB CT scan (in our case, ∼500 μSv) is significantly higher than that of a WB transmission scan, which has been estimated of the order of 100 μSv (21), depending on the source field strength and acquisition duration. Therefore, only 1 low-CT acquisition was performed at the beginning of the initial PET segment for attenuation correction of all 8 WB frames within this scanning segment. Visual inspection confirmed that no significant movement occurred between these 8 scans.
Comparing trapezoidal AUC calculation versus curve fittings, on the basis of summed exponentials with empirically optimized goodness-of-fits, we have observed few advantages of curve fitting for the calculation of the residence time. Curve fitting, however, has the advantage of being able to calculate fractional activity in source organs, which can be used as input for subsequent dynamic organ models such as the bladder or the GI system. In this study, the use of these systems was investigated briefly for the tracer under consideration. The simple conservative division of 50/25/25 for SI/ULI/LLI did result in a slight overestimation of ED of about 8%, due to a higher contribution of ULI and LLI residence times and organ doses.
The subjects participating in this study received a total effective dose of 5.7 ± 1.3 mSv for the PET and 1.5 mSv for the CT. For the emission scan, and expressed per injected activity, this corresponds to 22.8 μSv/MBq. In comparison with other 18F-labeled radiopharmaceuticals with typical ED values in the range of 20–30 μSv/MBq, the radiation burden of 18F-MK-9470 is in the middle range. As indicated in previous studies, and also shown by our work, methodologic differences in determination of these values and assumptions in source organ residence time distribution and models may be appreciable (20).
Because of the hepatobiliary excretion, and the large difference in gallbladder activity and absorbed dose, the older unit of effective dose equivalent (EDE)—in which the gallbladder wall is considered as one of most active source organs of the remainder of the body (16)—is larger than ED values. However, the current procedure of radiation risk assessment is based on ED values, and a similar comparative observation holds for many of the recently published 18F radioligands (22–25). The large variability in gallbladder activity and, hence, organ absorbed dose is due to large differences in individual kinetics of gallbladder emptying, a process influenced by multiple hormonal factors and GI interactions. The maximal gallbladder organ dose observed in this study would be about 925 cGy for 250 MBq administered activity.
The average injected mass dose of 18F-MK-9470 was 6.1 ± 4.7 nmol (3.0 ± 2.3 μg). This tracer dose of radiochemical did not produce any subjective or meaningful changes in laboratory blood tests, blood pressure, pulse, and respiration rate in any subject. On the basis of Figure 3, about 4% of the injected 18F-MK-9470 was found in the brain. For a total mass of 0.24 nmol, this would mean a concentration of 0.16 nM in the brain. If we assume that the nonspecifically bound 18F-MK-9470 is negligible and CB1R densities are on the order of 100 nM, then, roughly, we estimate an occupancy of about 0.16%, indicating a negligible quantity for physiologic effects. There were no adverse events reported in this study. Therefore, 18F-MK-9470 appears to be safe from both pharmacologic and radiation-exposure standpoints.
CONCLUSION
Administration of 18F-MK-9470 leads to a reasonable radiation dose burden, in line with most other 18F-labeled radioligands and falls into ICRP/World Health Organization class II-b for a standard injected activity (185–370 MBq) (26) in CNS imaging to determine drug occupancy or to study pathophysiologic aspects of the CB1R involvement in neuropsychiatric and metabolic disorders. Methodologically, some experimental simplifications can be introduced without significant effects on ED estimates for this radioligand and type of biodistribution.
Acknowledgments
Merck & Co., Inc., is acknowledged for the availability of the precursor for 18F-MK-9470, as is the financial support of the Research Council of the Katholieke Universiteit Leuven (grant OT/05/58) and the Fund for Scientific Research, Flanders, Belgium (grant FWO/G.0548.06). The authors explicitly thank Stijn Dirix, Prof. Dr. Luc Mortelmans, and Prof. Dr. Jan de Hoon and his team for their contributions to the MK-9470 studies as well as the PET radiopharmacy and medical physics group for their collaboration. The authors declare no competing financial interests. Two of the healthy subjects included in this study were recruited as part of a phase I PET study sponsored by Merck & Co., Inc.
Footnotes
-
COPYRIGHT © 2008 by the Society of Nuclear Medicine, Inc.
References
- Received for publication September 13, 2007.
- Accepted for publication November 20, 2007.


