


Abstract
The aim of this retrospective multicentric study was to develop and evaluate a prognostic 18F-FDG PET/CT radiomic signature in early-stage non–small cell lung cancer patients treated with stereotactic body radiotherapy (SBRT). Methods: Patients from 3 different centers (n = 27, 29, and 8) were pooled to constitute the training set, whereas the patients from a fourth center (n = 23) were used as the testing set. The primary endpoint was local control. The primary tumor was semiautomatically delineated in the PET images using the fuzzy locally adaptive Bayesian algorithm, and manually in the low-dose CT images. In total, 184 Image Biomarkers Standardization Initiative–compliant radiomic features were extracted. Seven clinical and treatment parameters were included. We used ComBat to harmonize radiomic features extracted from the 4 institutions relying on different PET/CT scanners. In the training set, variables found significant in the univariate analysis were fed into a multivariate regression model, and models were built by combining independent prognostic factors. Results: Median follow-up was 21.1 mo (range, 1.7–63.4 mo) and 25.5 mo (range, 7.7–57.8 mo) in training and testing sets, respectively. In univariate analysis, none of the clinical variables, 2 PET features, and 2 CT features were significantly predictive of local control. The best predictive models in the training set were obtained by combining one feature from PET (Information Correlation 2) and one feature from CT (flatness), reaching a sensitivity of 100% and a specificity of 96%. Another model combining 2 PET features (Information Correlation 2 and strength) reached sensitivity of 100% and specificity of 88%, both with an undefined hazard ratio (P < 0.001). The latter model obtained an accuracy of 0.91 (sensitivity, 100%; specificity, 81%), with a hazard ratio undefined (P = 0.023) in the testing set; however, other models relying on CT radiomic features only or the combination of PET and CT features failed to validate in the testing set. Conclusion: We showed that 2 radiomic features derived from 18F-FDG PET were independently associated with local control in patients with non–small cell lung cancer undergoing SBRT and could be combined in an accurate predictive model. This model could provide local relapse-related information and could be helpful in clinical decision making.
Non–small cell cancer (NSCLC) is usually associated with a poor prognosis. However, approximately 16% of patients present with early-stage cT1–T2 N0 disease at diagnosis (1). Over the past 2 decades, technologic developments in target delineation, motion management, conformal treatment planning, and daily image guidance have allowed the development of stereotactic body radiation therapy (SBRT) (2). SBRT uses stereotactic targeting to facilitate the accurate delivery of a short course of high-dose radiation to the target. SBRT has demonstrated high local control rates (85%–90%) comparable to those obtained with surgery in multiple prospective trials (3) and is now a guideline-recommended treatment for patients with early-stage NSCLC who are medically unfit or unwilling to undergo surgery (4). Among these patients, therapeutic results are nonetheless highly variable, and new predictive factors of response to SBRT are needed to better individualize treatment.
18F-FDG PET/CT is the standard imaging tool for initial staging and radiation treatment planning (5). PET/CT has also emerged as a prognostic tool in NSCLC, but parameters such as SUVmax and metabolic tumor volume have been inconsistently correlated with outcome (6).
Radiomic features are handcrafted metrics used to quantify tumor intensity, shape, and heterogeneity, some of which have been shown to reflect intratumoral histopathologic properties (7) and to predict patients’ outcome in several pathologic conditions including NSCLC when extracted from 18F-FDG PET, CT, or both (8).
We hypothesized that some radiomic features extracted from the 18F-FDG PET/CT images could have predictive value of recurrence in early-stage NSCLC patients treated with SBRT, and we aimed to evaluate this hypothesis in a multicentric setting.
MATERIALS AND METHODS
Patient Selection
Eighty-seven patients with NSCLC stage I–II and tumor diameters below 5 cm according to the eighth American Joint Committee on Cancer classification, treated with definitive curative SBRT from January 2012 to December 2016 at 4 French institutions (Rennes, Tours, Brest and Nantes), were retrospectively included.
All patients were required to have PET/CT imaging performed within 60 d of SBRT and at least 6 mo of follow-up. Histologic confirmation was not mandatory, but if a biopsy could not be performed because of a contraindication, progression according to RECIST on at least 2 serial CT imaging studies or an increased 18F-FDG uptake on PET/CT were necessary, according to recommendations (9).
Collected data included age and date of diagnosis, sex, performance status, histology when available, stage, tumor size as measured on CT according to RECIST, status at last follow-up, and PET/CT diagnostic images. Date and site of recurrence were also collected. Diagnosis of recurrences was based on CT findings (with confirmation of radiologic progression on serial CT), and histologic confirmation of relapse was not mandatory.
This study was approved by the Institutional Review Boards at each institution.
Treatment Planning
The SBRT dose was prescribed according to each institution’s protocol. Patients with peripherally located lesions received a median total radiation dose of 48 Gy (range, 48–60 Gy) in 3–4 fractions. For central lesions, a median dose of 50 Gy (range, 30–60 Gy) in 3–8 fractions was used (Supplemental Table 1; supplemental materials are available at http://jnm.snmjournals.org).
Follow-up
Clinical and radiologic follow-up was performed at the treating institution. CT was performed every 3 mo in the first 2 y and then every 6 mo for another 3 y.
PET/CT Image Acquisition and Image Analysis
PET/CT images were acquired 60 ± 5 min after 18F-FDG injection in accordance with the European Association of Nuclear Medicine guidelines (10). All PET images were corrected for attenuation using the acquired low-dose CT data. Acquisitions differed among the 4 institutions in terms of PET/CT scanner manufacturer and models, as well as in acquisition protocols and reconstruction settings (Fig. 1; Supplemental Table 2).
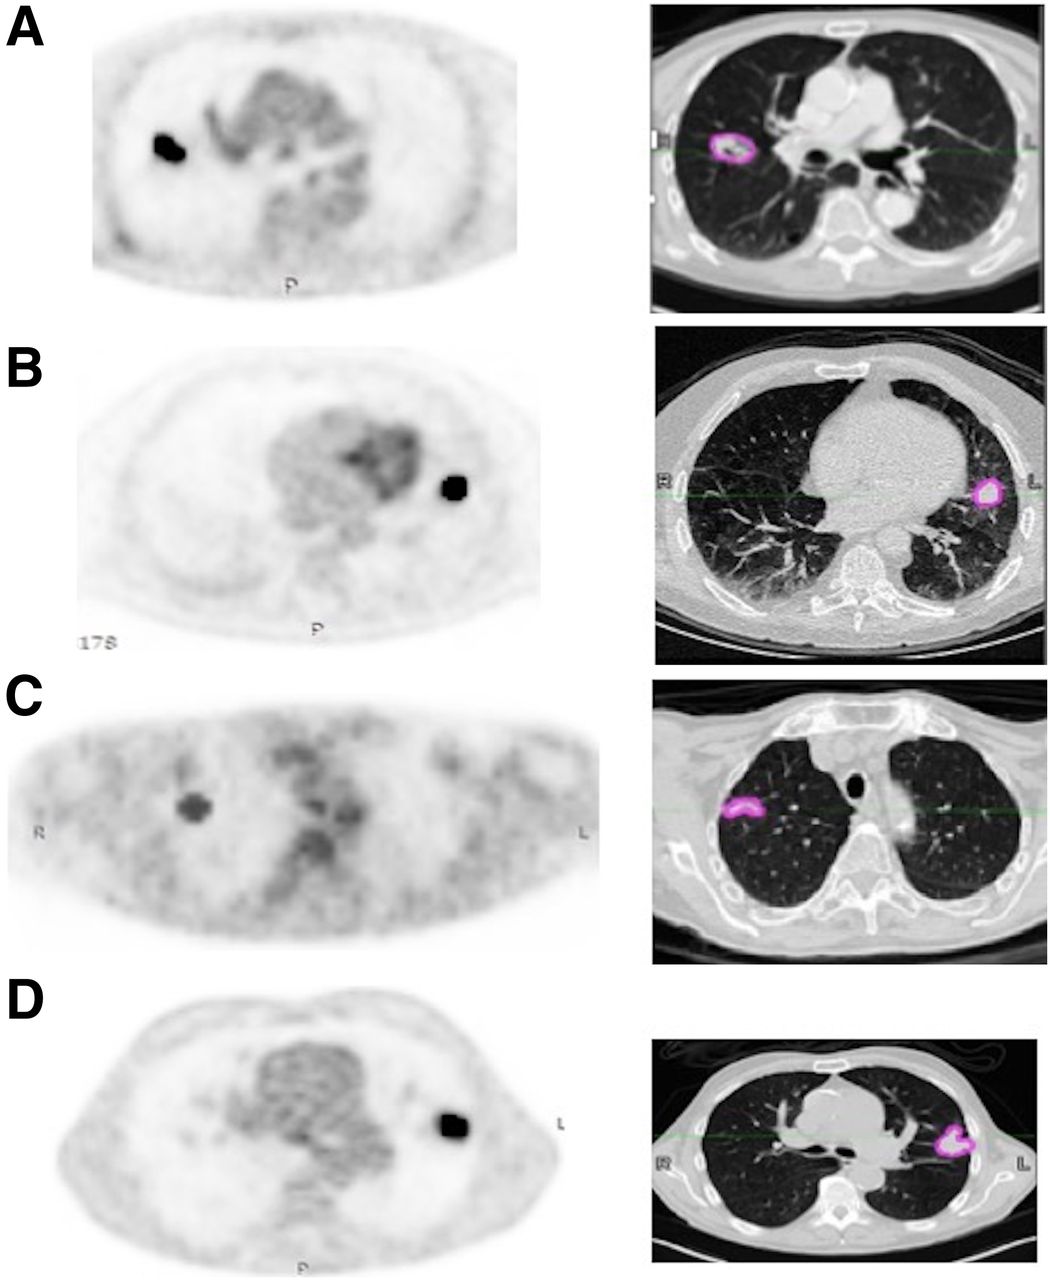
Images obtained at Brest (Biograph; Siemens) (A), Rennes (Discovery ST; GE Healthcare) (B), Tours (Ingenuity; Philips) (C), and Nantes (Biograph) (D), with semiautomatically fuzzy locally adaptive Bayesian segmentation on corrected PET and corresponding manual gross-tumor volume segmentation on CT with lung window setting.
Tumor Delineation
The PET and the low-dose CT images were processed independently. An expert radiation oncologist segmented all primary tumors semiautomatically in the PET images using the fuzzy locally adaptive Bayesian algorithm, which has been shown to be robust with respect to differences in image acquisition and reconstruction settings (11), and manually in the low-dose CT images, with the lung window setting (window level, −450 Hounsfield units; window width, 1,500 Hounsfield units) using MiM Maestro (MiM software Inc.) (Fig. 1).
Feature Extraction
Each tumor in both the PET and the CT images was characterized with 92 radiomic features (shape, intensity, and texture with fixed number of bins, discretization into 64 bins, and 3-dimensional merging strategy for matrices; Supplemental Table 2), compliant with the most up-to-date benchmark values of the Image Biomarkers Standardization Initiative (12).
Statistical Analysis and Modeling
For each patient, 191 image features (92 in each modality, 7 clinical and histopathologic parameters [age, sex, gross tumor volume, stage, localization, World Health Organization status, histology]) and the biologically equivalent dose were included. To pool radiomic features extracted from images acquired on the different PET/CT scanners and associated protocols, we used the ComBat harmonization method (13). After ComBat harmonization of radiomic features, patients from Rennes, Tours, and Brest were pooled to constitute the training set, whereas patients from Nantes were used as the testing set.
The primary endpoint was local control. Secondary endpoints were cancer-specific survival, distant metastasis–free survival, recurrence-free survival, and overall survival. For the training set, all variables were tested using the univariate Cox proportional-hazards model. Given the number of variables tested and the small number of events, a conservative significance level of P < 0.005 was considered to reduce the risk of false discovery (14).
Receiver-operating-characteristic curves were used to determine optimal cutoffs of significant variables using the Youden index. The resulting Kaplan–Meier curves for local control were compared using the log-rank test.
Because univariate selection ignores relationships between variables, Spearman rank correlation (ρ) was used to quantify correlations between the parameters with an area under the receiver-operating-characteristic curve of above 0.7, to evaluate the redundancy of potentially predictive variables (Supplemental Table 3). Cox regression models with the stepwise method were subsequently used for multivariate analysis by including only uncorrelated variables (ρ < 0.8, a threshold arbitrarily chosen on the basis of the usual categories suggested by Mukaka et al. (15)) identified as significant in the univariate analysis, to identify independent factors that could be combined into multiparametric models. Such models were then built for binary classification of the patients with both risk factors into one group, versus the patients with none or only one of the risk factors into another group.
The best models were evaluated in the testing set. Adjusted hazard ratios (HRs) and the corresponding 95% confidence intervals (CIs) were calculated.
In addition, correlations between the parameters identified in the multivariate analysis and standard metrics (e.g., SUVmax and volume) were checked to avoid developing models that would end up being simply surrogates of usual variables (Supplemental Table 4).
All statistical analyses were performed using MedCalc Statistical Software, version 18.5 (MedCalc Software). The datasets generated during or analyzed during the current study are available from the corresponding author on reasonable request.
RESULTS
Patient and Tumor Characteristics
The flowchart (Supplemental Fig. 1) presents the patient selection. The 87 patients were split into a training set that included 64 patients from Brest (n = 8), Rennes (n = 27), and Tours (n = 29), whereas 23 patients from Nantes constituted the testing set. Patients, tumors, and treatment characteristics are provided in Table 1 and Supplemental Table 5.
Patient and Tumor Characteristics
No clinical parameters were statistically significant between the training and testing sets. In 51 patients (59%), the diagnosis of NSCLC was confirmed histologically (34 in the training cohort and 17 patients in the testing cohort).
In the training set, the median SBRT dose delivered was 54 Gy in 3 fractions (range, 30– 60 Gy in 3–8 fractions; median biologically equivalent dose, 150 Gy). In the testing set, the median SBRT dose delivered was 48 Gy in 4 fractions (median biologically equivalent dose, 105.6 Gy).
There was no significant difference in median SUVmax between the training and testing sets or between patients with biopsy-proven NSCLC (median, 7.5; range, 2.6–36.2) and those without histologic information (median, 7.7; range, 2.5–18.23).
Outcome
Training Set
In the training set, median follow-up was 21.1 mo (range, 1.7–63.4 mo). Progression or disease recurrence occurred in 15 patients (24%) after a median follow-up of 37 mo (range, 22–41 mo). Eleven patients had distant recurrence (17%), none had regional recurrence, and 4 (6%) had a local failure. The 2-y local control, overall survival, cancer-specific survival, distant metastasis–free survival, and recurrence-free survival rates were 90%, 75%, 89%, 75%, and 69%, respectively.
Testing Set
In the testing set, median follow-up was 25.5 mo (range, 7.7–57.8 mo). Progression or recurrence occurred in 9 patients (39%), 7 (23%) had a distant recurrence, 4 (17%) had regional recurrence, and 2 (9%) had a local failure. The 2-y local control, overall survival, cancer-specific survival, distant metastasis–free survival, and recurrence-free survival rates were 87%, 100%, 100%, 75%, and 72%, respectively.
Development of the Radiomic Signature in the Training Set
Local Control
In univariate analysis, no clinical parameter was statistically correlated with local control. BED10 (biologically equivalent doses were calculated with an α/β of 10; >151.2 Gy) showed an association with worse local control without, however, reaching statistical significance, with a HR of 10 (95% CI, 1–95) (P = 0.016) (Table 2).
Uni- and Multivariate Analysis for Local Control in Training Set
Three CT-derived features and 2 PET-derived features reached an area under the curve of more than 0.7 (Supplemental Tables 3 and 4). In univariate analysis, CT flatness, CT shade, and elongation (AUC 0.79) were associated with local control (P < 0.001 with an undefined HR and P = 0.003 with an HR of 13 [95% CI, 1.1–168], respectively). PET Information Correlation 2 (IC2) from gray-level cooccurrence matrix and PET texture strength from the neighborhood gray-tone difference matrix remained significant, with HR undefined for both (P = 0.005 and P = 0.001, respectively).
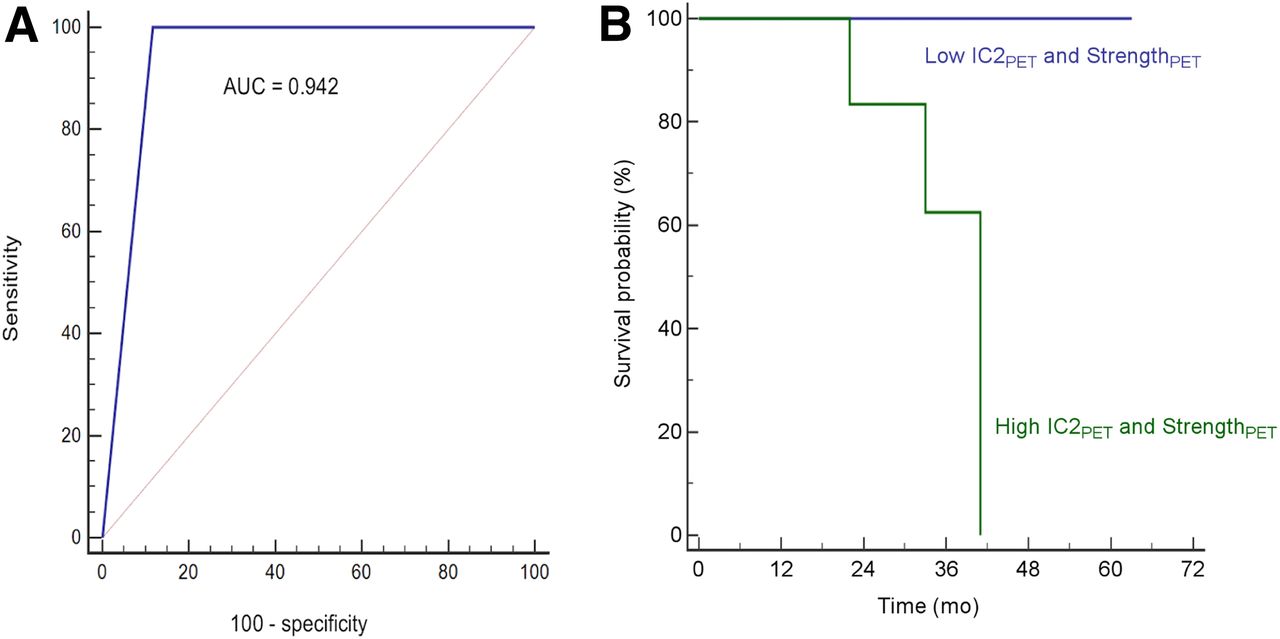
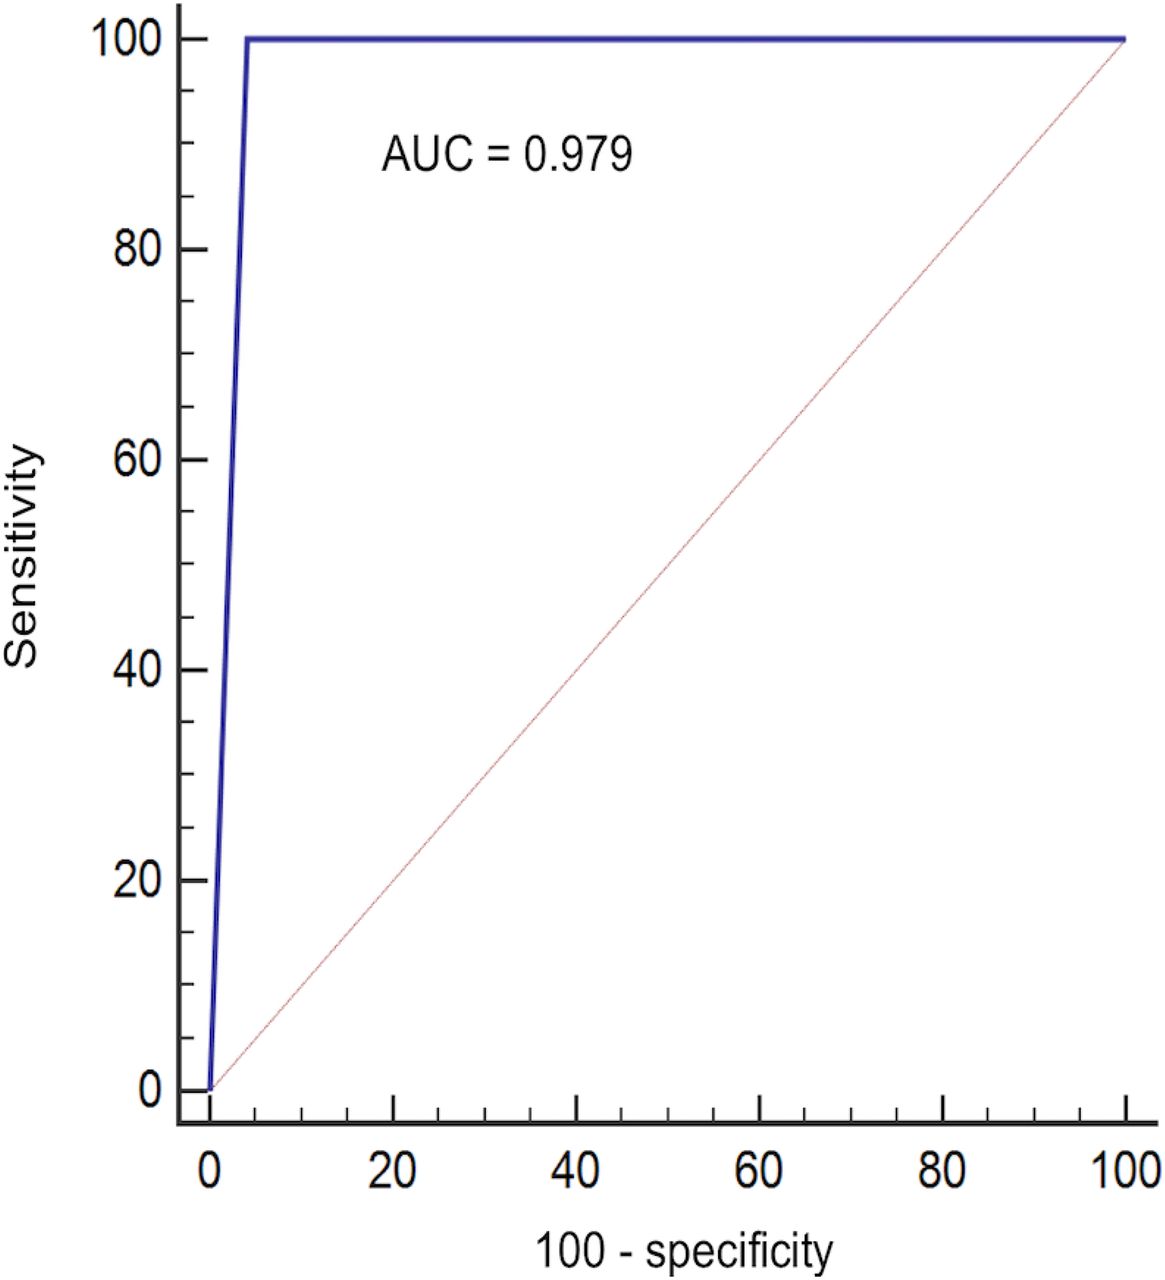
The model combining these 2 PET features (with cutoffs of 0.89 and 45.11 for IC2 and strength, respectively) reached an accuracy of 0.94 (sensitivity, 100%; specificity, 88%) to predict local control, with an undefined HR (P < 0.001) (Fig. 2A). The estimated 3-y local control rates between patients with low versus high values for this model were 100% and 62.5%, respectively (Fig. 2B). A PET/CT model combining PET IC2 and CT flatness (with cutoffs of 0.89 and 0.73, respectively) reached an accuracy of 0.98 (sensitivity, 100%; specificity, 96%) to predict local control, with an undefined HR (P < 0.001) (Fig. 3). The estimated 3-y local control rates between patients with low versus high PET/CT model were 100% and 60%, respectively.

(A) Receiver-operating-characteristic curve analysis for prediction of local control according to PET IC2 and PET strength in training cohort. (B) Kaplan–Meier curve of local control based on radiomic signature PET IC2 and PET strength in training cohort. AUC = area under curve.

Receiver-operating-characteristic curve analysis for prediction of local control according to model combining PET IC2 and CT flatness in training cohort. AUC = area under curve.
In the multivariate analysis, PET (PET IC2 and PET strength) and PET/CT (PET IC2 and CT flatness) models remained statistically significant, with HRs of 31 (95% CI, 3–369; P = 0.007) and 38 (95% CI, 3–449; P = 0.004), respectively (Table 2).
Overall and Cancer-Specific Survival
In univariate analysis, none of the investigated parameters (clinical or radiomic) were associated with overall survival or cancer-specific survival. BED10, with a 150-Gy cutoff, showed a trend for cancer-specific survival (HR of 6 [95% CI, 1–49]; P = 0.07).
Distant Metastasis–Free Survival and Recurrence-Free Survival
In univariate analysis, BED10 (>150 Gy) remained statistically correlated with distant metastasis–free survival and recurrence-free survival, with an HR of 8 (95% CI, 2–27; P < 0.001) and 6 (95% CI, 2–18; P < 0.001), respectively (Table 2). None of the radiomic features was associated with distant metastasis–free survival or recurrence-free survival.
Evaluation of the Radiomic Signatures in the Testing Set
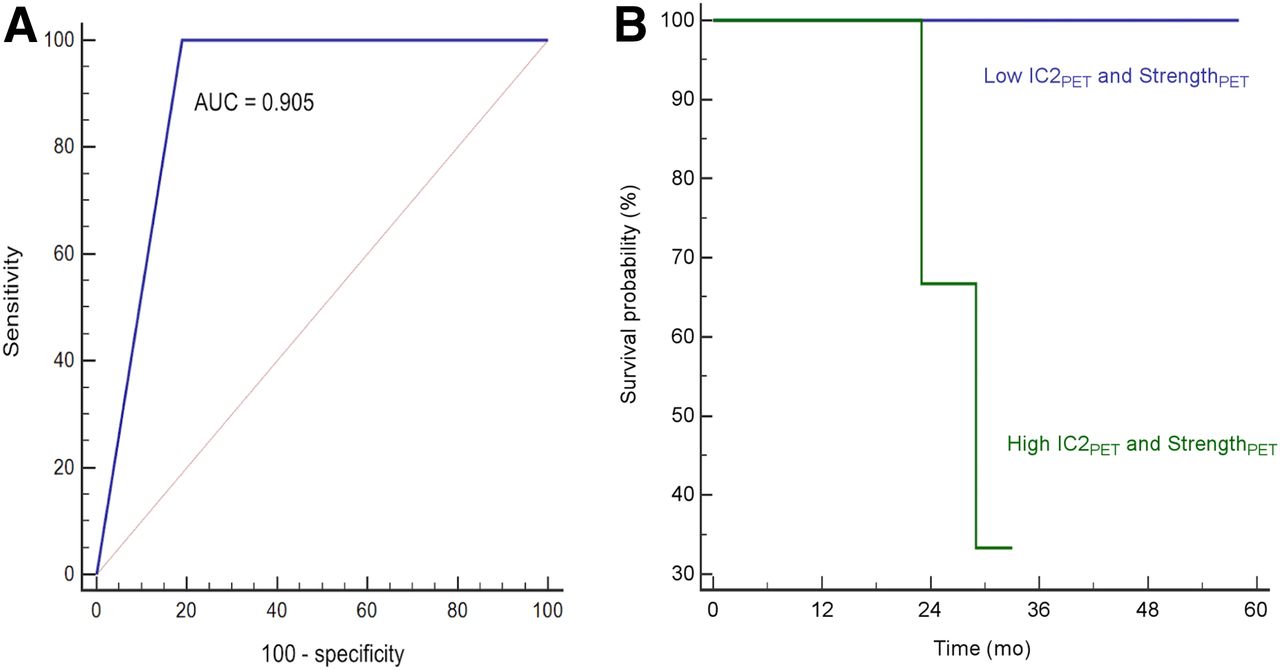
The PET-only signature combining PET IC2 and PET strength reached an accuracy of 0.91 for local control (sensitivity, 100%; specificity, 81%) (Figs. 4A and 4B), with an undefined HR (P = 0.023). The PET/CT signature combining PET IC2 and CT flatness failed to reach statistical significance.

(A) Receiver-operating-characteristic curve analysis for prediction of local control according to model combining PET IC2 and PET strength in testing cohort. (B) Kaplan–Meier curve of local control based on radiomic model combining PET IC2 and PET strength in testing cohort. AUC = area under curve.
The predictive power of SBRT regarding disease-free and recurrence-free survival was not confirmed.
DISCUSSION
Our results are in line with previous studies on NSCLC that exploited 18F-FDG PET/CT to predict outcome, showing that tumor uptake distribution quantitatively characterized by 18F-FDG PET radiomics is associated with response to external-beam radiotherapy (16).
In this study, we identified a PET radiomic signature combining 2 textural features, namely IC2 and strength, that has predictive power regarding the efficacy of SBRT in the treatment of early-stage NSCLC. We showed that the higher these features were, the worse local control was, reflecting tumor heterogeneity on staging PET/CT of patients with lung cancer eligible for SBRT.
Radiomic features exhibit variable sensitivity to the acquisition and reconstruction parameters (17). These can vary considerably from one institution to another or even within an institution relying on different scanners (e.g., Nantes in the present study); therefore, validating radiomics-based models in a multicentric context is often challenging. This is one of the identified limitations for a broader transfer of radiomics to clinical practice. We recently confirmed that the ComBat method could successfully harmonize radiomic features extracted from PET and MR images obtained with different acquisition and reconstruction parameters to facilitate validation of radiomic signatures in a multicentric setting (18). In our present work, we further confirmed the interest of ComBat (Supplemental Fig. 2). Indeed, without harmonization, the radiomic features had lower predictive power (Supplemental Table 6).
Studies focusing on early-stage lung tumors treated with SBRT are sparse. A first retrospective study on a cohort of 101 patients treated with SBRT showed that SUVpeak and radiomic features could predict distant recurrence with a C-index of 0.71, higher than SUVmax or tumor volume alone (19). This work considered only PET images and was monocentric, although 2 different scanners were used—a fact that was not accounted for in the radiomic features computation or statistical analysis. Another study reported gray-level cooccurrence matrix entropy as independently associated with local control in a series of 45 patients treated with SBRT (20). Oikonomou et al. performed a larger analysis of 150 patients combining CT and PET parameters but did not specifically report on local control. They used a manual PET segmentation that suffers from high inter- and intraobserver variability (21). Furthermore, they tested only 21 texture parameters extracted on 2 dimensions. Finally, Lovinfosse et al. identified gray-level cooccurrence matrix dissimilarity from 18F-FDG PET in 63 patients as associated with disease-specific survival and disease-free survival but not overall survival (22). All these studies were retrospective and monocentric, and none followed a training–testing scheme, which can be crucial, as we showed here that features predictive in the training set may not be validated in the testing set (the CT features in our case). In addition, most of these studies investigated a comparatively small number of radiomic features not compliant with the Image Biomarkers Standardization Initiative and relied on different segmentation or intensity discretization schemes, which may help explain why different features were identified among these studies. Reproducibility and comparison between radiomic studies outside the Image Biomarkers Standardization Initiative framework is impossible (23).
In most radiomic studies, the number of variables is often greater than the number of patients, potentially leading to a high risk of false discovery (14). To address this problem, we relied on a more conservative P value threshold in the univariate analysis of the training cohort (0.005 instead of the usual 0.05), and we evaluated the trained models in an separate dataset. With this approach, we found a local control signature consisting of 2 PET features that yielded a high prognostic performance for local control. The retained features showed low (ρ < 0.01 for CT flatness) to moderate (ρ < 0.64 for PET strength) rank correlation with the associated tumor volume (Supplemental Table 3).
Overall, 6 patients of 87 (7%) developed a local relapse later on. This low rate of infield relapse is in accordance with the literature (24).
Our study has several limitations. First, histologic confirmation was not available for 43% of the patients, leaving doubt that some might have been treated for a benign disease. However, findings from surgical studies have shown that the likelihood of a benign diagnosis in patients having a new or growing lesion on CT with a corona radiate sign and local 18F-FDG uptake is less than 4% (25). In addition, data from the literature show that therapeutic results in patients without histologic information are similar to those of patients whose histologic type is known or those who benefited from surgical resection (26). In our present work, we showed no difference between patients with and without histology (Supplemental Table 7). Another limitation is that all PET images were acquired in the free-breathing condition, which could influence radiomics although some features can be robust when compared between free breathing and optimal respiratory gating (27). The interobserver reliability of the CT features could not be evaluated because segmentation on the CT images was performed manually by a single expert in the same way as he routinely delineates the gross tumor volume to plan stereotactic treatment (28). Of note, the signature including a CT feature could not be validated in the testing set, contrary to the PET-only signature that combines features extracted from semiautomatically delineated tumor volumes with the fuzzy locally adaptive Bayesian algorithm, which allows reducing interobserver variability. Several alternative segmentation methods can provide similar performance (29). It should also be emphasized that the CT component of PET/CT exploited in the present study is not of the same resolution and quality as a planning or a diagnostic CT scan and was also without contrast enhancement. This factor can also contribute to the lower predictive value of CT features compared with PET. Finally, our study was retrospective (as are most radiomic studies) and included a limited number of patients, which is also a limitation to applying ComBat despite its proven robustness for small samples, since the number of patients per batch was small. The small number of events may also have limited the statistical significance of the results and the representativeness of the model assessment (e.g., some of the HRs in our results could not be determined because of 100% sensitivity). A post hoc power analysis regarding an area under the curve of 0.9, compared with the null hypothesis (area under the curve, 0.5), with an α-risk of 0.05 and power of 0.8, shows that the training cohort is sufficient (4 events for 60 patients, as required) but that the testing cohort is underpowered (2 events for 21 patients instead of 4 events for 42 patients). Finally, some patients had a short follow-up (5 patients had a follow-up < 1 y) and thus could still develop recurrence despite being predicted as low risk, which would decrease the overall performance of our model.
CONCLUSION
In this multicenter, retrospective study, we showed that imaging features derived from PET/CT were independent predictive factors of local control in patients with NSCLC undergoing SBRT. These features could provide recurrence-related information and could be helpful in clinical decision making, especially regarding dose escalation. Our findings need to be confirmed in a larger cohort, which is currently being collected at our institution and other centers.
DISCLOSURE
This work is part of the MuMoFraT project supported by the Canceropôle du Grand Ouest and the regions of Bretagne, Pays de la Loire, and Centre-Val de Loire. The PhD of Ronrick Da-ano is funded by the H2020 Marie Curie ETN PREDICT project. No other potential conflict of interest relevant to this article was reported.
KEY POINTS
QUESTION: Can pretreatment 18F-FDG PET/CT radiomics predict local recurrence in patients treated with SBRT for early-stage NSCLC?
PERTINENT FINDINGS: We showed that the ComBat harmonization method allowed efficient pooling of radiomic features extracted from the 4 clinical centers to train and validate a 2-feature PET radiomic model that achieves high accuracy in predicting local recurrence, especially in comparison with clinical factors that were not predictive.
IMPLICATIONS FOR PATIENT CARE: A simple PET-derived radiomic signature (2 features) may provide recurrence-related information and could be helpful in clinical decision making, especially regarding dose escalation.
Footnotes
Published online Nov. 15, 2019.
- © 2020 by the Society of Nuclear Medicine and Molecular Imaging.
REFERENCES
- Received for publication March 29, 2019.
- Accepted for publication September 30, 2019.


