


Abstract
Misalignment between PET and low-dose CT (LD-CT) can cause severe artifacts in cardiac PET/CT because of attenuation-correction errors, even when using slow or cine LD-CT. Myocardial blood flow (MBF), as measured by 15O-water, can be determined from the rate of 15O-water washout from myocardial tissue, which is independent of tissue attenuation. The purpose of the present study was to assess the accuracy of these MBF measurements in the absence of attenuation correction. Methods: Twenty-five patients referred for evaluation of myocardial perfusion underwent 6-min rest and adenosine stress PET scans after the administration of 370 MBq of 15O-water; both scans were followed by slow LD-CT. Data were acquired on a PET/CT scanner and reconstructed by a 3-dimensional row-action maximum likelihood algorithm both with (CTAC) and without (NAC) attenuation correction. An ascending aorta volume of interest was used as input function. MBF and coronary flow reserve (CFR) were calculated for 17 myocardial segments using nonlinear regression of the standard single-tissue-compartment model with corrections for left and right ventricular spillover and perfusable tissue fraction. Results: High correlation (r2 = 0.99 and 0.97, with slopes of 0.96 and 0.91 for rest and stress, respectively) and excellent agreement (intraclass correlation coefficient [ICC], 1.00 and 0.98) between NAC- and CTAC-based MBF values were found. Absolute rest and stress MBF values were 3% and 8%, respectively, lower for NAC scans. The correlation coefficient between all NAC and CTAC CFR values was 0.95 (ICC, 0.95; slope, 0.92) and 0.97 (ICC, 0.99; slope, 1.01) when only CFR values below 2 were considered. Deviations between CTAC and NAC values were smallest for basal segments and increased toward the apex. Conclusion: MBF and CFR can be measured accurately using 15O-water and PET without correcting for attenuation, reducing the effective dose to the patient to 0.8 mSv for a complete rest–stress protocol. This dose is an order of magnitude lower than typical values for 82Rb, 99mTc-methoxyisobutylisonitrile, or CT perfusion scans.
Several recent studies have stressed the added value of combined quantitative myocardial blood flow (MBF) and coronary flow reserve (CFR) measurements over qualitative myocardial perfusion imaging (1–5). The introduction of integrated PET/CT systems, equipped with a CT scanner of at least 64 slices, allows for measurements of calcium score, MBF at rest and MBF during pharmacologic stress, and CT coronary angiography in a single scan session, increasing the diagnostic efficiency and patient comfort (1,5–7). The necessity of an on-site cyclotron for the production of 15O has been an obstacle for its introduction into routine clinical practice; however, because water is freely diffusible and has no metabolic interactions in tissue, PET using 15O-water is considered to be the gold standard for noninvasive quantitative measurements of MBF (3,5).
It has been shown that, in about 25% of cases, misalignment between PET and low-dose CT (LD-CT) causes severe artifacts in cardiac PET/CT images obtained with 82Rb, 13N-ammonia, or 18F-FDG because of attenuation-correction errors, even when CT acquisition methods that acquire an image averaged over the respiratory cycle, such as cine LD-CT, are used (8–15). In addition, the use of CT- instead of 68Ge-based transmission measurements for attenuation correction increases the radiation burden to the patient, with about 0.7 mSv for a 30-mAs LD-CT to several millisieverts for respiration-averaged LD-CT. Because the effective dose of 15O-water itself ranges from 1.1 mSv for an injection of 1,100 MBq (the amount typically used on stand-alone PET scanners with interplane septa) to 0.4 mSv for 370 MBq (16,17), the addition of respiration-averaged LD-CT represents a highly significant increase in radiation burden, as it accounts for up to 90% of the radiation dose. The absolute increase in radiation burden due to CT attenuation correction is, of course, the same for 82Rb, 13N-ammonia, or 99mTc-methoxyisobutylisonitrile.
For any flow tracer such as 15O-water, 82Rb (18), or 13N-ammonia (4), MBF can be derived from dynamic scans, although extraction is directly proportional to MBF only for 15O-water. In the case of 15O-water, total scan duration is 5–10 min, and MBF is calculated using a tracer kinetic model either per myocardial segment, per coronary artery territory (19), or on a voxel-by-voxel basis (20,21). Online blood sampling or image-derived left ventricular cavity, left atrium, or ascending aorta time–activity curves can be used to define the arterial input function. The generation of quantitative parametric MBF images of diagnostic quality has long been hampered by poor count statistics of 15O-water scans acquired using PET scanners with interplane septa. Improved sensitivity of the latest generation of PET/CT scanners, however, results in better statistics and considerably better image quality, allowing for the generation of high-quality MBF images, even when using only 370 MBq of 15O-water (5,22).
MBF as measured with 15O-water is calculated using the model introduced by Iida et al. (23,24) and improved by Hermansen (19), which is based on earlier work by Bergmann et al. (25,26) but also incorporates a perfusable tissue fraction (PTF) parameter to account for partial-volume–induced underestimation of myocardial radioactivity concentrations. MBF is determined not from the uptake, as for microspherelike tracers such as 82Rb or 13N-ammonia, but from the washout rate of 15O-water from myocardial tissue. Because tissue attenuation (and subsequent correction, either correct or incorrect) affects only the height of the myocardial time–activity curve but not its shape, MBF values as measured using 15O-water are much less sensitive to misalignment between PET and CT than those determined with microspherelike tracers. In theory, attenuation correction could even be omitted completely from 15O-water scans if only MBF is needed, provided that an image-derived input function is used. Leaving out a transmission, however, implies that also no correction for scattered radiation can be performed, because the single scatter simulation correction (27,28), used on all state-of-the-art PET/CT scanners, requires the presence of a tissue attenuation map. The aim of the present study was to assess the quantitative accuracy of 15O-water–based MBF and CFR measurements without attenuation correction.
MATERIALS AND METHODS
Patients
Data were obtained from a cohort of patients who were being evaluated for coronary artery disease and were therefore referred for CT angiography and PET MBF measurements. A total of 25 consecutive patients were included in the current study (13 men: age range, 47–78 y; mean age, 63 y; and 12 women: age range, 31–78 y; mean age, 59 y). None of the patients had a documented history of coronary artery disease. Electrocardiography did not show signs of a previous myocardial infarction, and echocardiography showed a normal left ventricular function without wall motion abnormalities in all patients.
Image Acquisition
PET/CT images were acquired using a Gemini TF 64 scanner (Philips Healthcare) (29). Two minutes after the start of intravenous adenosine infusion (140 μg·kg−1·min−1), 370 MBq of 15O-water were injected as a 5-mL bolus (0.8 mL·s−1), followed immediately by a 35-mL saline flush (2 mL·s−1) and the start of a 6-min emission scan. This PET scan was followed immediately by a slow LD-CT scan (55 mAs; rotation time, 1.5 s; pitch, 0.825; collimation, 16 × 0.625; acquiring 20 cm in 37 s, compared with 5 s for a regular LD-CT) during normal breathing. Adenosine infusion was stopped after the LD-CT. After an interval of 10 min to allow for decay of radioactivity and washout of adenosine, a second 6-min 15O-water scan (370 MBq) was started, followed by a second slow LD-CT scan. The duration of the total scan procedure was less than 25 min. Images were reconstructed into 22 frames (1 × 10, 8 × 5, 4 × 10, 2 × 15, 3 × 20, 2 × 30, and 2 × 60 s) using the 3-dimensional row-action maximum likelihood algorithm and applying all appropriate corrections for scanner normalization, dead time, decay, scatter, randoms, and attenuation based on the corresponding slow LD-CT scan. In addition, the same reconstruction, but without attenuation (and scatter) correction, was performed. Reconstructed images consisted of 45 planes of 144 × 144 voxels, with voxel dimensions of 4 × 4 × 4 mm. Images were converted from DICOM to the ECAT 7 format (Siemens/CTI) before further analysis.
Blood Time–Activity Curves
Using the CAPP package (Siemens/CTI), we placed 1-cm-diameter regions of interest (ROIs) over the ascending aorta (AA) in approximately 10 attenuation-corrected transaxial image planes of the frame in which the first pass of the tracer could be seen, and we combined them into a volume of interest (VOI). A second VOI was placed over the right ventricular (RV) cavity, with boundaries at least 1 cm from the RV wall to avoid spillover of myocardial activity into this VOI. VOIs were drawn only on attenuation-corrected (CTAC) images to avoid differences in CTAC and non–attenuation-corrected (NAC) data caused by the variability of ROI definition. Both VOIs were then projected onto the dynamic CTAC and NAC images to generate arterial and RV time–activity curves, that is, CA(t) and CRV(t), respectively.
Parametric Images
Parametric MBF and PTF images were generated using software developed in-house within Matlab 7 (The MathWorks), applying a basis function solution of the standard single-tissue-compartment model (20,21) including corrections for left ventricular and RV spillover (19) and perfusable tissue fraction (23): Eq. 1Here, VA accounts for left ventricular spillover and arterial blood volume, VRV is the RV spillover factor, and Vd the distribution volume or partition coefficient of water in the myocardium, fixed at 0.91 mL·g−1 (23). In the present study, 30 logarithmically spaced precomputed basis functions with MBF values ranging from 0.1 to 2.2 mL·g−1·min−1 for rest scans and from 0.1 to 5.5 mL·g−1·min−1 for stress scans were used:
 Eq. 2The linear combination of fi(t), CA(t), and CRV(t) that minimizes the sum of squared differences with the measured CPET(t) gives PTF, VA, VRV, and MBF. To avoid noise-induced high perfusion values in voxels outside the heart or in blood vessels, MBF was set to zero in voxels with PTF less than 0.25 g·mL−1 or VA + VRV greater than 0.75, and MBF and PTF images were then filtered with a gaussian filter 10 mm in full width at half maximum.
Data Analysis
CTAC PTF images were transformed to short-axis images using the CAPP package, and the same transformation was applied to the original CTAC and NAC dynamic images to avoid the effects of variability in reslicing parameters on the comparison between CTAC and NAC data. ROIs according to the 17-segment model of the American Heart Association were drawn on short-axis CTAC PTF images and transferred to the CTAC and NAC dynamic images. MBF, PTF, VA, and VRV were then calculated for each segmental ROI, for each coronary artery territory, and for the whole myocardial wall by nonlinear regression of Equation 1 to the ROI time–activity curves, using software developed in-house within Matlab 7. Correlation and agreement between segmental, coronary artery territory, and average myocardial MBF and CFR values based on NAC and CTAC images were assessed using regression and Bland–Altman analyses and paired 2-tailed t tests.
RESULTS
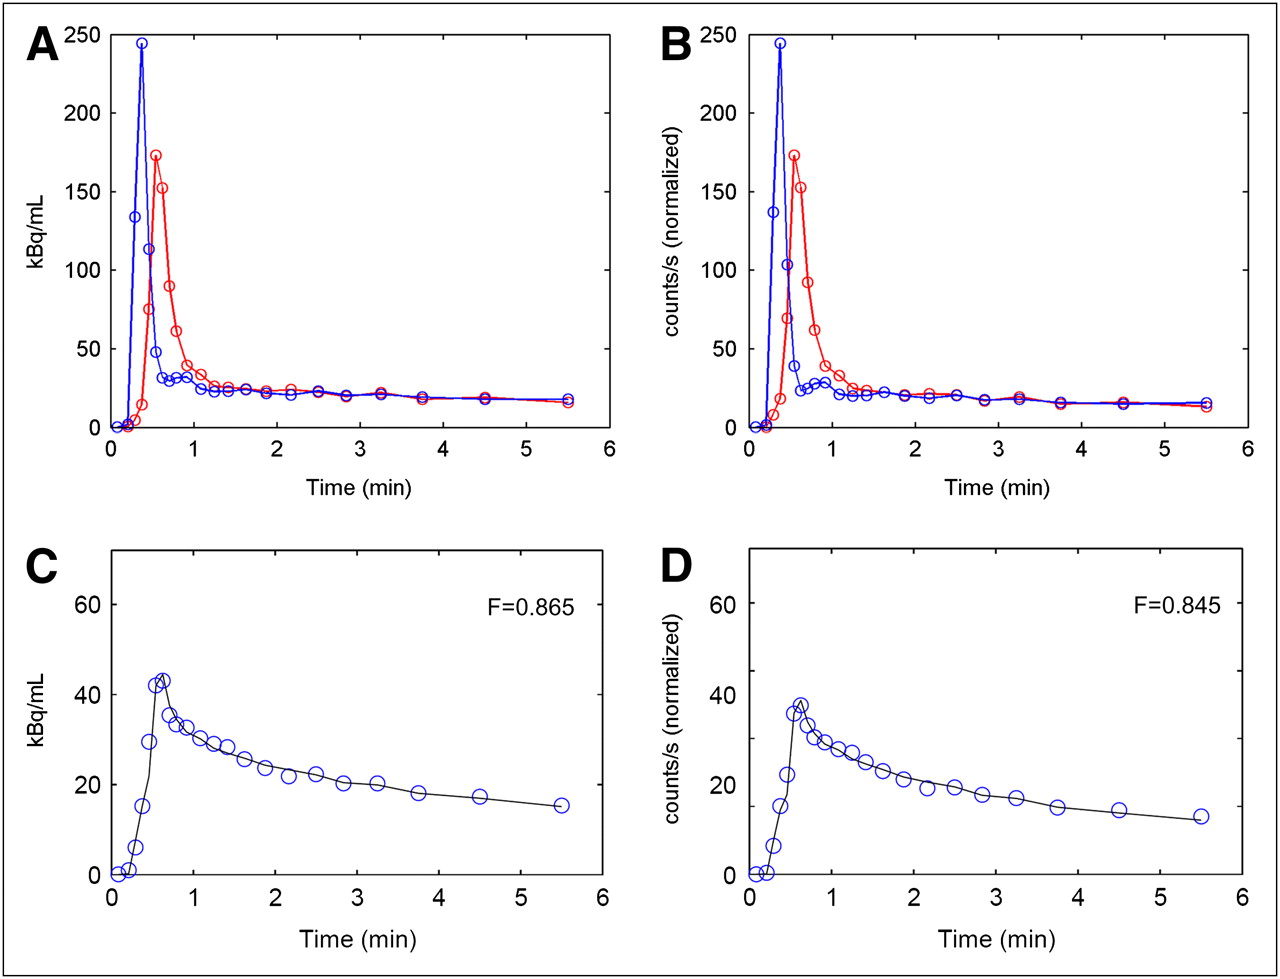
Mean (±SD) resting MBF for all myocardial segments in all 25 patients was 1.00 ± 0.45 mL·g−1·min−1 when based on CTAC and 0.96 ± 0.42 mL·g−1·min−1 when based on NAC images. For stress MBF, these values were 2.35 ± 0.95 and 2.16 ± 0.84 mL·g−1·min−1, respectively, and for CFR they were 2.56 ± 1.12 and 2.42 ± 0.95, respectively. Figure 1 shows blood and average myocardial time–activity curves for a typical patient, both with and without attenuation correction. Table 1 summarizes correlation, slope, intercept, and absolute differences between average myocardial MBF and CFR values as determined from NAC and CTAC images. Figures 2 and 3 show correlation and agreement between MBF and CFR values, respectively, for all coronary artery territories. In Table 1, regression parameters are given separately for the clinically most relevant range of CFR less than 2.

(A and B) AA (red) and RV (blue) time–activity curves, and (C and D) average myocardial time–activity curves of typical patient, extracted from CTAC (A and C) and NAC (B and D) images. Circles in C and D represent measured PET data, and solid lines fits to data according to Equation 1. NAC blood time–activity curves (B) were scaled to same maximum as CTAC blood time–activity curves in A, and same scale factor was applied to NAC myocardial time–activity curves.
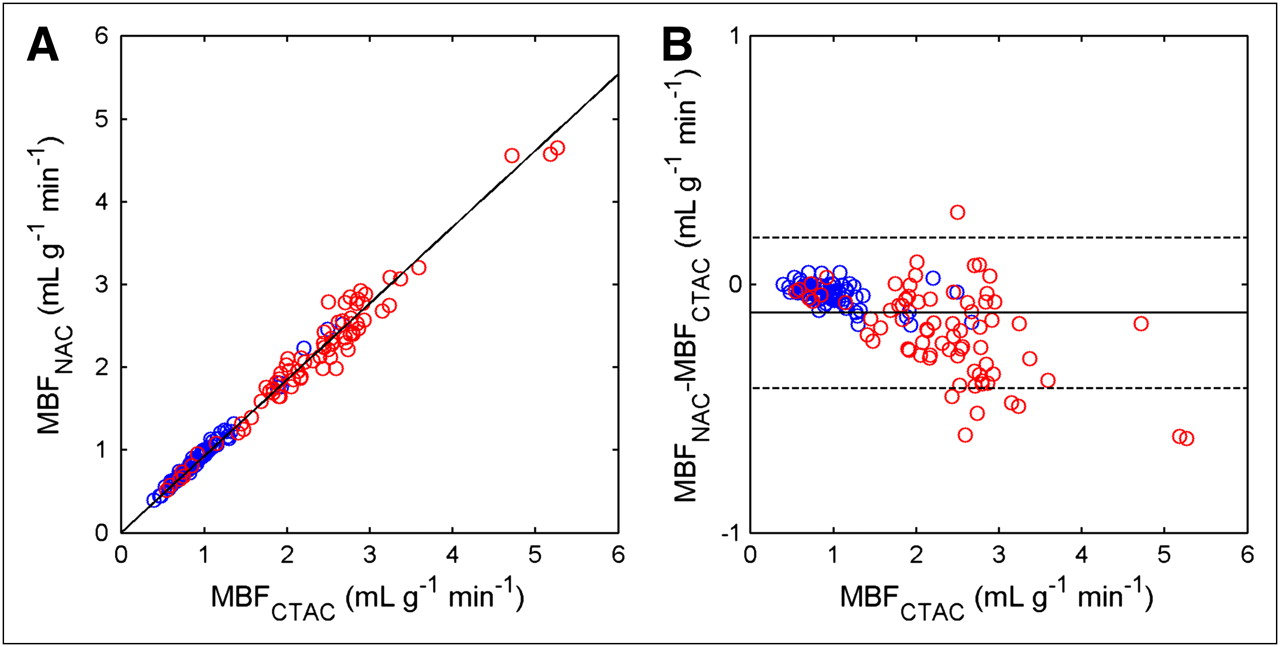
Correlation (A) and agreement (B) between CTAC and NAC rest (blue symbols) and stress (red symbols) MBF values for 3 coronary artery territories of all subjects. Solid line in left-hand graph represents linear fit to all data. Solid and dashed lines in right-hand graph depict mean difference between NAC and CTAC values, with corresponding 95% confidence intervals.

Correlation (A) and agreement (B) between CTAC and NAC CFR values for 3 coronary artery territories of all subjects. Blue symbols represent territories with CFRCTAC less than 2 and red symbols CFRCTAC greater than or equal to 2. Black and blue solid lines in left-hand graph represent linear fits to all data and to only territories with CFRCTAC less than 2, respectively. Solid and dashed lines in right-hand graph depict mean difference between NAC and CTAC values and corresponding 95% confidence intervals (black, all data; blue, CFRCTAC < 2).
Correlation, Agreement, Slope of Linear Regression with Zero Intercept, and Mean Percentage Difference Between CTAC and NAC MBF and CFR Values for Whole Myocardium
Correlation coefficients and intraclass correlation coefficients were all greater than 0.95 for coronary artery territory MBF and CFR values. However, NAC rest and stress MBF, and CFR values, showed a small but significant underestimation for all 3 coronary artery territories separately and combined (P < 0.0005). For the female patient group, the difference between CTAC- and NAC-based CFR was not significant for any of the coronary artery territories. In general, underestimation of MBF and CFR increased with MBF and CFR itself (slope of CFRNAC–CFRCTAC vs. CFRCTAC, −0.17; P < 0.0005), as also shown by slopes less than 1 in Table 1.
To illustrate the distribution of differences over the myocardium, correlation coefficients and slopes of linear regression between CTAC and NAC CFR values for each myocardial segment are shown in Figure 4. Values for men and women separately are shown in Supplemental Figure 1 (supplemental materials are available online only at http://jnm.snmjournals.org). No clear pattern in the distribution of correlation coefficients across the myocardium was found. In general, the slope of the linear regression between CTAC and NAC values was close to 1 in the basal ROIs and decreased somewhat toward the apex. No significant differences between CFR based on CTAC and NAC images were found in the basal segments, except for the inferolateral segment, and in the mid anterior and anterolateral segments, whereas the other mid and apical segments showed significant differences (P < 0.05).
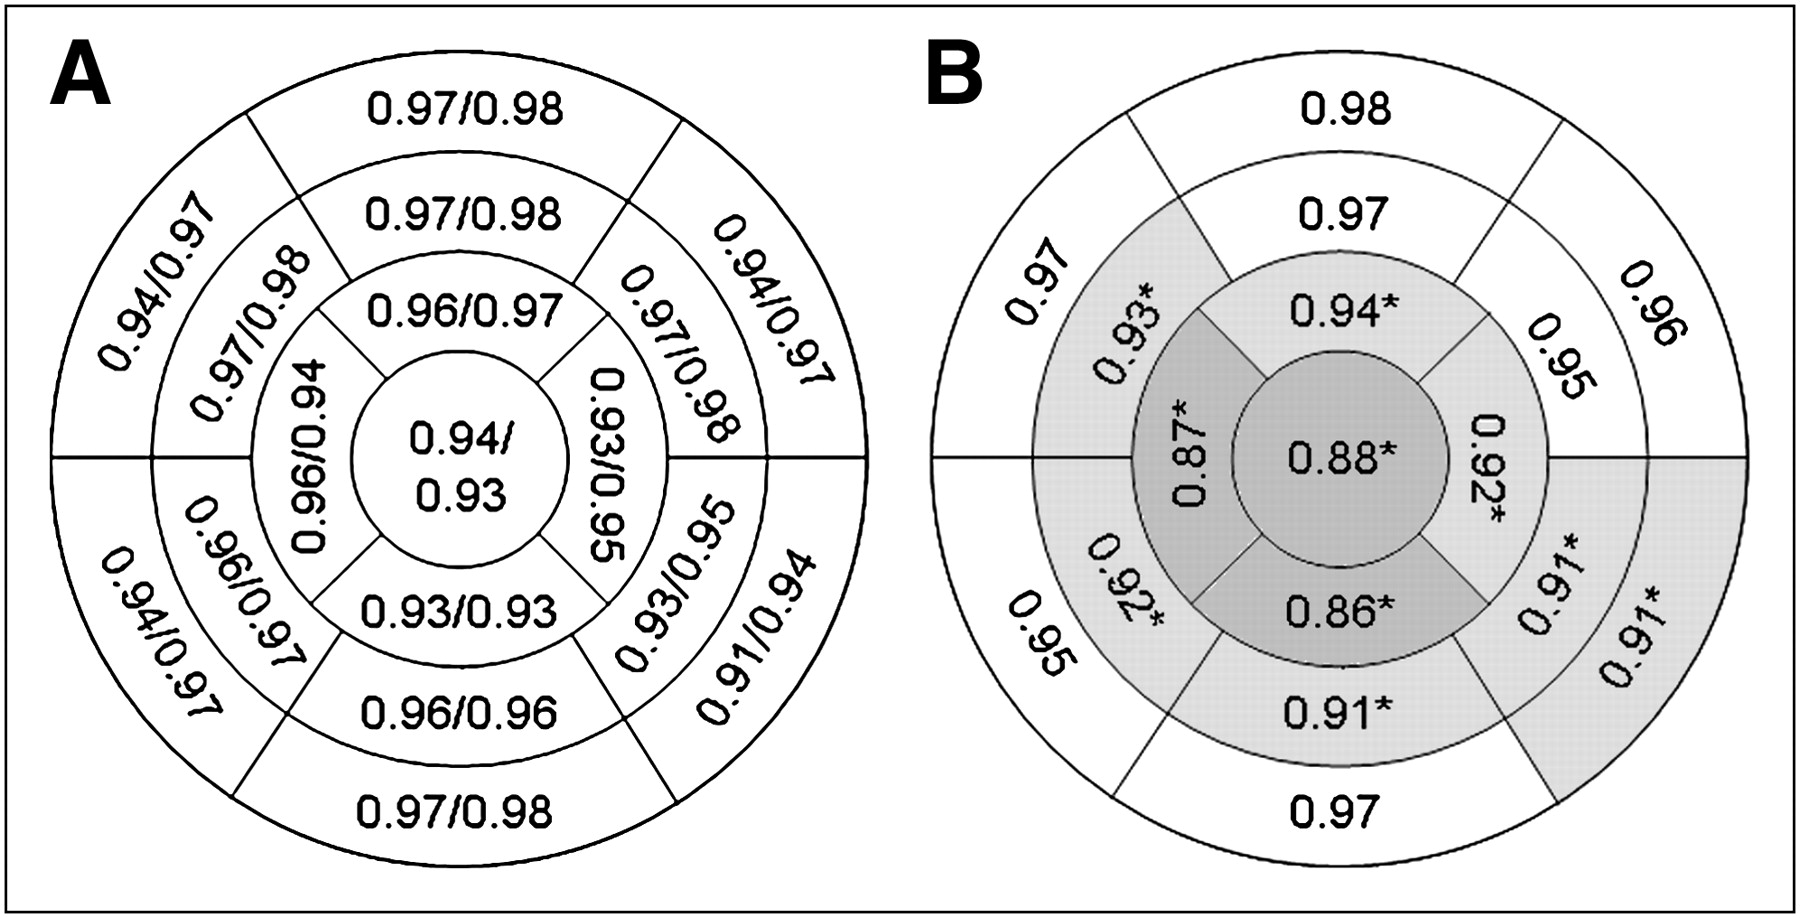
Correlation coefficients (r2) and intraclass correlation coefficients (A) and slopes of linear regression with zero intercept (B) between CTAC and NAC CFR values of all 17 myocardial segments. Darker gray level in B corresponds to lower slope. *Segments with significant difference between CTAC and NAC CFR values (paired t test, P < 0.05).
Figure 5 shows parametric short-axis MBF images of a typical patient, based on CTAC and NAC data, generated using the basis function method described above.
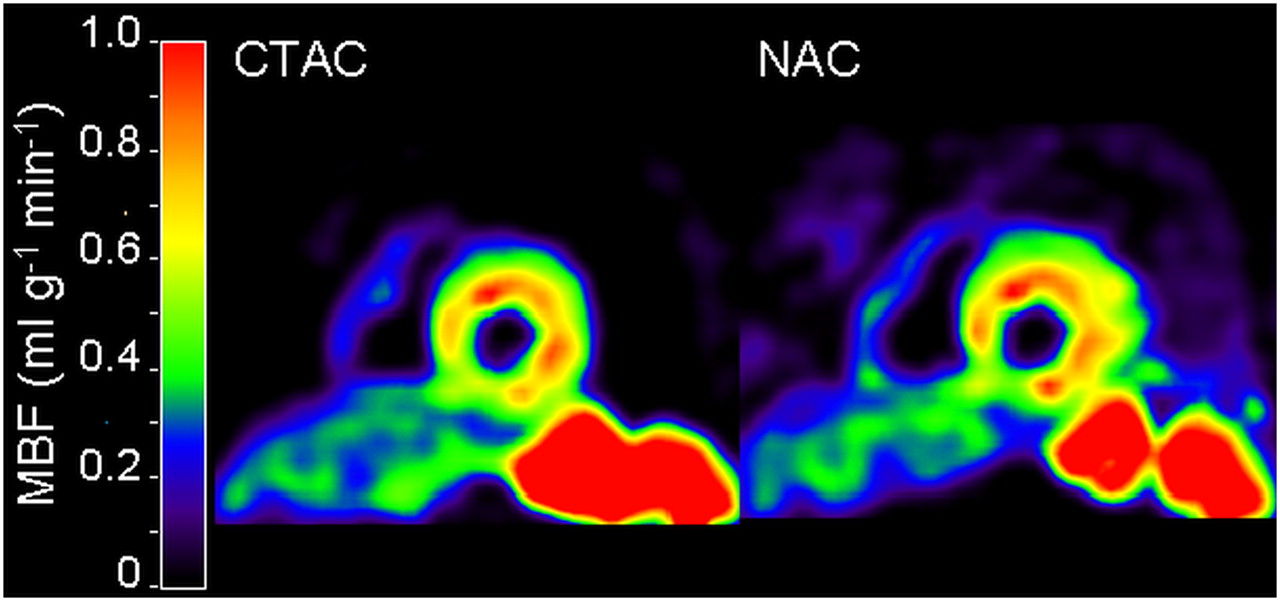
Short-axis CTAC (left) and NAC (right) resting MBF images of patient with reduced inferior wall perfusion.
DISCUSSION
In the present study, the quantitative accuracy of MBF and CFR measurements based on 15O-water images without attenuation correction was assessed. A high correlation between CTAC and NAC values was found for both MBF and CFR, although both MBF and CFR showed a small but significant underestimation when based on NAC images, especially at high flow values and in apical and inferior segments of the myocardium. For CFR less than 2, correlation and agreement between CTAC and NAC data were excellent, without significant differences between CTAC and NAC values.
The omission of attenuation correction implies that scatter correction cannot be performed either, because the single scatter simulation method for correction of scattered radiation relies on the availability of an attenuation map to describe the underlying geometry. This lack of scatter correction does not seem to influence quantitative accuracy of NAC MBF measurements to a large degree. Because water is distributed rather homogeneously, scatter contributions to input function and myocardial time–activity curves will be rather similar, probably differing by a nearly constant factor. A constant scaling factor between input function and myocardial time–activity curves, already caused by different attenuation in AA and myocardium, will only affect the height of the curves and not their shape. Therefore, lack of attenuation and scatter correction is likely to affect only spillover factors and PTF, but not MBF itself, which for 15O-water is based on the washout rate. However, the variations in slopes of NAC versus CTAC CFR values, as seen in Figure 4, may in part be explained by a slightly larger difference in scatter contribution between inferior and apical segments and the AA than between basal segments and the AA. Although the range of MBF values in the present study was quite large, the patient population did not include patients with previous myocardial infarctions, which may lead to more heterogeneous flow distributions. Therefore, further investigation of the validity of NAC images in patients with different patterns of flow distribution is warranted.
As can be seen from Table 1 and Figures 2 and 3, there was good agreement between CTAC- and NAC-based MBF and CFR values for MBF less than 2 mL·g−1·min−1 and CFR less than 2, with linear regression slopes close to 1. Above these values, NAC images showed increasing underestimations with increasing MBF and CFR, leading to slopes less than 1 as shown in Figure 4. An explanation of the underestimation of MBF in NAC images may lie in different effects of scattered radiation on the shapes of myocardial and AA time–activity curves. Myocardial time–activity curves are affected by scatter originating from nearby well-perfused organs such as the gastrointestinal tract, spleen, and liver, which is likely to lead to an increase in the tail of the time–activity curves relative to their peaks. This effect is much less in AA because of its greater distance to well-perfused tissues and leads to an apparent undercorrection for spillover and blood volume in the tails of the myocardial time–activity curves, resulting in an apparent reduction in clearance of 15O-water and corresponding decrease in apparent MBF. This decrease in apparent MBF was confirmed by the larger discrepancy between CTAC and NAC CFR and MBF values in inferior and apical myocardial segments than in basal and anterior segments. The larger decrease in apparent MBF in vasodilatation stress scans might then be explained by an increase in partial blood volume because of vasodilatation. However, for the clinically relevant range of CFR values around 1.5, generally accepted to be the level associated with ischemic heart disease (5), the use of NAC images did not lead to the underestimation of MBF and CFR. Therefore, the underestimation at higher MBF and CFR values will not have any consequences in the use of NAC images in clinical practice.
There is a visual difference between NAC and CTAC images in Figure 5, especially in the area just outside the anterior wall, which shows low perfusion values in the NAC images but zero perfusion in the CTAC images. This is mainly caused by the thresholds used for generating these parametric images, for which MBF was set to zero for voxels where PTF was less than 0.25 g·mL−1 (likely to be either lung or blood). For NAC images, however, PTF is overestimated for superficial tissues and underestimated for deeper tissues, causing overestimation of PTF in voxels just outside the anterior and lateral walls. An increased PTF threshold would yield zero MBF in these voxels but at the same time would result in inferior wall voxels with PTF values below this threshold, which would then erroneously be shown as a flow defect in the MBF images.
Together with the anatomic tissue fraction as determined from a 15O-carbon monoxide scan, PTF can be used to measure the perfusable tissue index, which has been suggested to be a marker of myocardial viability (30,31). The proposed omission of an LD-CT scan for attenuation correction would no longer yield PTF values that can be used for this purpose. Whether the perfusable tissue index is needed as an additional measure, and thus, whether an LD-CT scan is required, would depend on the clinical situation.
The use of NAC images would, obviously, solve all problems that have been reported about attenuation-correction artifacts induced by misalignment between PET and LD-CT scans. Additionally, the use of NAC images considerably reduces the radiation burden to patients referred for MBF imaging. The low amounts of administered radioactivity result in a total effective dose for a rest–stress protocol of 0.8 mSv, a reduction of several millisieverts because of omission of the LD-CT scan, which cannot be omitted for other tracers. A total effective dose of 0.8 mSv is an order of magnitude lower than typical values for 82Rb, 99mTc-methoxyisobutylisonitrile, or CT perfusion scans (16).
CONCLUSION
MBF and CFR can be measured quantitatively using 15O-water and PET without correcting for attenuation and scatter. The omission of the LD-CT scan avoids transmission–emission misalignment artifacts and considerably reduces radiation burden, resulting in a total effective dose as low as 0.8 mSv for a complete rest–stress protocol.
Acknowledgments
We thank Suzette van Balen, Judith van Es, Amina Elouahmani, Femke Jongsma, Nazerah Sais, and Annemiek Stiekema for scanning the patients and Henri Greuter, Dr. Gert Luurtsema, Robert Schuit, and Kevin Takkenkamp for producing 15O-water.
Footnotes
-
COPYRIGHT © 2010 by the Society of Nuclear Medicine, Inc.
References
- Received for publication September 14, 2009.
- Accepted for publication January 5, 2010.


Jump to section
Related Articles
Cited By...
- Sympathetic Innervation of Cold-Activated Brown and White Fat in Lean Young Adults
- Diagnostic Performance of Resting and Hyperemic Invasive Physiological Indices to Define Myocardial Ischemia: Validation With 13N-Ammonia Positron Emission Tomography
- Integrated Myocardial Perfusion Imaging Diagnostics Improve Detection of Functionally Significant Coronary Artery Stenosis by 13N-ammonia Positron Emission Tomography
- Automatic Extraction of Myocardial Mass and Volume Using Parametric Images from Dynamic Nongated PET
- Relative Flow Reserve Derived From Quantitative Perfusion Imaging May Not Outperform Stress Myocardial Blood Flow for Identification of Hemodynamically Significant Coronary Artery Disease
- Impaired Hyperemic Myocardial Blood Flow Is Associated With Inducibility of Ventricular Arrhythmia in Ischemic Cardiomyopathy
- Hybrid Imaging Using Quantitative H215O PET and CT-Based Coronary Angiography for the Detection of Coronary Artery Disease
- Parametric Images of Myocardial Viability Using a Single 15O-H2O PET/CT Scan