


Abstract
Selective internal radiation treatment (SIRT) via intrahepatic arterial administration of 90Y microspheres is an effective therapeutic modality. The conventional and generally applied MIRD schema is based on the premise that the distribution of microspheres in the liver parenchyma is uniform. In reality, however, the distribution of the microspheres follows a distinct pattern, requiring that a model be developed to more appropriately estimate radiation absorbed doses to the different structural/functional elements of the hepatic microanatomy. Methods: A systematic investigation was performed encompassing a conventional average absorbed dose assessment, a compartmental macrodosimetric approach that accounts for the anticipated higher tumor–to–normal liver activity concentration ratio, dose point-kernel convolution–derived estimates, and Monte Carlo dose estimates employing a spherical and 3-dimensional hexagonal liver model, including various subunits of the hepatic anatomy, down to the micrometer level. Results: Detailed specifics of the radiation dose deposition of 90Y microspheres demonstrated a rapid decrease in absorbed dose in and around the portal tracts where the microspheres are deposited. The model also demonstrated that the hepatocellular parenchymal and central vein doses could be at significant levels because of a cross-fire effect. Conclusion: The reported microstructural dosimetry models can help in the detailed assessment of the dose distributions in the hepatic functional subunits and in relating these doses to their effects. These models have also revealed that the there is a consistent relationship between the average liver dose as calculated by MIRD macrodosimetry and the structural dosimetry estimates in support of the clinical utility of the MIRD methodology. This relationship could be used to more realistically assess patterns of hepatic toxicity associated with the 90Y SIRT treatment.
- hepatology
- oncology
- radiobiology/dosimetry
- radionuclide therapy
- hepatic structural dosimetry
- MCNPX
- SIRT
- 90Y microspheres
Selective internal radiation treatment (SIRT) via intrahepatic arterial administration of 90Y microspheres is emerging as a mainstream therapeutic modality. The clinical efficacy and relative safety of SIRT have been demonstrated in several prospective and retrospective studies (1–10). At present, the treatment planning is largely based on visual or quantitative determination of tumor and liver volumes. The therapeutic profile could be much improved with better understanding of microsphere, radiation field, and energy deposition spacial distributions of SIRT and application of dosimetric techniques in the clinical decision-making process. Accurate liver absorbed dose determination is crucial to establish the safety of SIRT.
The conventional MIRD methodology is based on the premise that the distribution of radiopharmaceuticals in any given target volume is uniform (11). In 90Y microsphere SIRT, by virtue of hepatic microvascular architecture, the distribution of the microspheres is confined to the portal tracts. There is no microsphere lodging in the hepatocellular parenchyma. The microspheres are administered into the hepatic artery and are distributed preferentially in the tumor compartment, being trapped within the tumor microvasculature. In the normal liver, microspheres are confined to the hepatic arterial tree and are entrapped within the terminal arterioles, which have diameters of approximately 30 μm (12), comparable to those of the microspheres. 90Y is a pure β-emitting radionuclide with maximum and average β-energies of 2.28 MeV and 933.7 keV, respectively. The corresponding maximum and average path lengths of the emitted β-particles in soft tissue (1 g/cm3) are 11 and 2.5 mm (13), respectively, corresponding to 50–200 cell diameters. The microspheres are biocompatible but not biodegradable, and therefore, no biologic elimination occurs after they lodge in the hepatic microvasculature. Most of the absorbed dose deposition will occur within a limited spatial dimension range. This unique pattern of radiation source localization or distribution is clearly different from that of radioimmunotherapy or radiopeptide therapy. The total radiation absorbed dose can be determined by the microsphere-to-target geometry and the emission characteristics of 90Y and its 64-h physical half-life. There is, thus, a need to develop a more accurate and clinically applicable biophysical model–based absorbed dose methodology. This approach should translate the average derived absorbed dose estimates into biologically relevant structural dose estimates for better characterization of biologic responses and the potential clinical complications of the 90Y microsphere treatment.
This article presents detailed specifics of the radiation dose deposition of 90Y microspheres and provides a clinically relevant description of any potential SIRT-associated liver complications. A systematic investigation was performed encompassing the conventional average absorbed dose assessment—a compartmental macrodosimetry approach that accounts for the anticipated higher tumor–to–normal liver activity concentration ratio, dose point-kernel convolution–derived estimates, and Monte Carlo dose estimates using a spheric and 3-dimensional (3D) hexagonal liver model, including various subunits of the hepatic anatomy—and also providing understanding of the dose distribution in the subunits small as a micrometer. A 3D liver model was developed on Monte Carlo N-Particle Extended (MCNPX) transport code to estimate the microscopic absorbed dose distribution in various subunits in the normal liver (e.g., portal triad, hepatocellular parenchyma, central vein) and to account for the spatial activity deposition of 90Y microspheres. The absorbed dose estimates to different subunits of the hepatic anatomy—facilitated by the use of Monte Carlo radiation transport simulations, referred to as structural dosimetry—is based on the unique localization pattern of microspheres in normal liver tissue (portal tracts), relative consistent positioning of other structural subunits in the liver, and absorbed dose deposition properties of 90Y.
MATERIALS AND METHODS
Clinical Liver Tumor Model
A 2-kg average liver mass was chosen for the clinical model. To represent different degrees of tumor involvement, both 3 and 6 spheroid tumors situated in the liver measuring approximately 4 cm in diameter (50 cm3 each, corresponding to total tumor volumes of 150 cm3 and 300 cm3, respectively) were considered.
Hepatic Microanatomy
The lobular morphology was chosen to represent the microanatomic liver unit for the structural dosimetry or Monte Carlo modeling. The microscopic pattern of liver tissue, readily identified on standard histologic sections, is a lobule. A lobule, in central vein–axial fractal geometry, is a 3D radial arrangement of plates of hepatocytes radiating outward from a vein located in the center. The liver lobule morphology can be approximated by a hexagonal prism (HP) geometry with a 0.06-cm mean radius (r), 0.07-cm side length (s), and 0.15-cm length, corresponding to a volume of 0.00189 cm3 (V = 3rsl) (14). The portal tracts (or portal triads)—the connective tissue framework bearing branches of the bile duct, portal vein, and hepatic artery—are located at the vertices or corners between adjacent lobules. The central veins run along the central axis of each lobule, all of which merge to form hepatic veins. The hepatocytes occupy the greatest volume of the lobule, forming cords between portal triads and the central vein, separated by sinusoids (Fig. 1A). The repeating units of lobules form a lattice pattern discernible on histologic sections (Fig. 1B).

Hepatic lobular architecture. (A) Central vein runs along central axis of each lobule, all of which merge to form hepatic veins. Hepatocytes occupy greatest volume of lobule, forming cords between portal triads and central vein, separated by sinusoids. (B) Repeating units of lobules form lattice pattern discernible on histologic sections.
Portal tract diameters are typically in the range of 100–150 μm. The central vein, at the center of each lobule, is at a distance of approximately 600–750 μm from any deposited 90Y microsphere. Microspheres are always positioned in the distal arterial branches (at the arteriolar level when a uniform, nonclustered distribution is assumed). The systematic localization of microspheres is, thus, expected to produce a total absorbed dose distribution in consistent fractions to the distinct morphologic structures (subunits) of the liver microanatomy.
Microsphere-Administered Quantity, Activity, and Distribution
There are 2 currently available microsphere types (resin and glass), differing in their activity loading (i.e., either 50 Bq/sphere or 2,500 Bq/sphere). To represent the types, the following cases, corresponding to a total activity administration of 3 GBq, were considered: 3 GBq/60,000,000 spheres and 3 GBq/1,200,000 spheres, respectively, for a single-activity administrations of 50 Bq/sphere or 2,500 Bq/sphere. The following are biodistribution kinetic assumptions for the two types: uniform distribution of microspheres within the hepatic arterial fractal geometry, equal activity on individual microspheres for each microsphere type, and uniform population of the lobular lattice geometry.
Absorbed Dose Determination
Clinical MIRD macrodosimetry and numeric Monte Carlo particle transport methods (MCNPX) were used for the absorbed dose determinations (MCNPX, version 2.5.0 (15)).
Noncompartmental MIRD Macrodosimetry
The noncompartmental MIRD macrodosimetry method does not consider tumor and liver compartments separately. It assumes that the 90Y microspheres are uniformly distributed and deposited equally in tumor and in the normal liver tissue with a tumor-to-liver perfusion ratio (TLR) equal to 1. The liver dose from a given administered activity is calculated according to: Eq. 1where LSF refers to the lung shunt fraction (assumed to be zero).
Compartmental MIRD Macrodosimetry
The administered 90Y microsphere activity is distributed in tumor and normal liver compartments. The distribution profile is determined by the relative vascularity, expressed as TLR (tumor–to–healthy liver activity concentration ratio) and volumes of these 2 compartments. When lung shunting occurs because of intrahepatic peritumoral arteriovenous communications, a third compartment (lung) is encountered and is expressed as the LSF. For this particular study, the LSF was considered to be zero. It is assumed that the administered activity is distributed evenly within the normal liver and tumor compartments. The tumor compartment, as expected, receives a higher concentration proportional to the TLR.
The fractional liver uptake (i.e., fraction of the administered activity accumulated in the normal liver) is: Eq. 2where massliver and masstumor are the masses of normal liver and tumor, respectively.
The dose to the liver delivered from a given administered activity is: Eq. 3
Eq. 3
The fractional tumor uptake (i.e., fraction of the administered activity accumulated in the tumor) is: Eq. 4
Eq. 4
The dose to the tumor delivered from a given administered activity is: Eq. 5
Eq. 5
Point Dose Function Calculations
The point dose function calculations were made according to the convention adopted by the MIRD Committee (16). The absorbed dose rate at a distance x from a 90Y point source is given by: Eq. 6where R (x) is the absorbed dose (cGy/s), x is the distance from source (cm), A is the source activity (dis/s), n is the number of β-particles emitted per disintegration, k is the 1.6 × 10⁻⁸ (g cGy/MeV), Ē is the average β-particle energy emitted by the source (MeV), and Φ (x) is the specific absorbed fraction = point kernel (g−1).
Monte Carlo Spheric Modeling
This model consisted of one 32-μm-diameter 90Y microsphere placed inside a 10-cm-radius tissue-equivalent sphere. Both spheres are in concentric geometry, as demonstrated in Figure 2. The spatial distribution of the initial position of the source electrons is uniform inside the spheres. The angular distribution was considered isotropic. Because of spheric symmetry, the radial distance from the microsphere is the only geometric factor to be considered. The 90Y β-decay energy spectrum (according to the Fermi radioactive β-decay formula) is partitioned in 10-keV energy bins, thus producing a total of 229 energy groups (17,18).

90Y microsphere spheric model. Shell thicknesses: 10 μm (A), 100 μm (B), 1 mm (C), and 10 cm (D). (Graphical interface: MCNPPlot.)
The energy deposition was analyzed in 39 radial shells ranging from 10 μm to 10 cm, starting from the center. The average doses in these shells were assessed through the MCNPX F6:e,p tally (cell-averaged energy deposition from electrons and photons). MCNPX dose values are given as dose per particle simulated in units of MeV/g/particle. Therefore, in each case, it is necessary to multiply the results by the total number of decay electrons, Ne, to obtain the total absorbed dose: Eq. 7where A0 represents the initial activity expressed in disintegrations per second (Bq).
Monte Carlo Lobular Microanatomy Modeling
We have developed a hexagonal model for hepatic lobules for the Monte Carlo computation inclusive of all contributions to the absorbed dose in a given 3D liver volume. In this model, lobules are defined as HPs situated in a central vein axis–oriented fractal geometry (Fig. 3). The chemical composition of the structures is that of an adult healthy liver (19). The lobule height, distance from the center to the side, and distance from the center to the vertex (or corner) are 1,500, 600, and 693 μm, respectively (14). These correspond to a lobular volume of 1.87 mm3. The central vein was modeled as a pair of concentric cylinders 56 and 66 μm in diameter (representing inner and outer walls) and 1,300 μm in length placed along the central axis of the HPs (14). Portal tract structures were modeled as 3 pairs of concentric cylinders, each 1,300 μm in length, placed along the corners of each HP, representing the hepatic artery, portal vein, and bile duct (14). The inner and outer diameters of the hepatic artery, portal vein, and bile ductules were 30 and 48 μm, 36 and 47 μm, and 26.2 and 42 μm, respectively (14). The average dose deposition in the vascular and biliary structures is computed using the dose deposition characteristics in the defined volumes of these structures. The morphometry and planar depictions of the model are given in Table 1 and Figures 3 and 4.
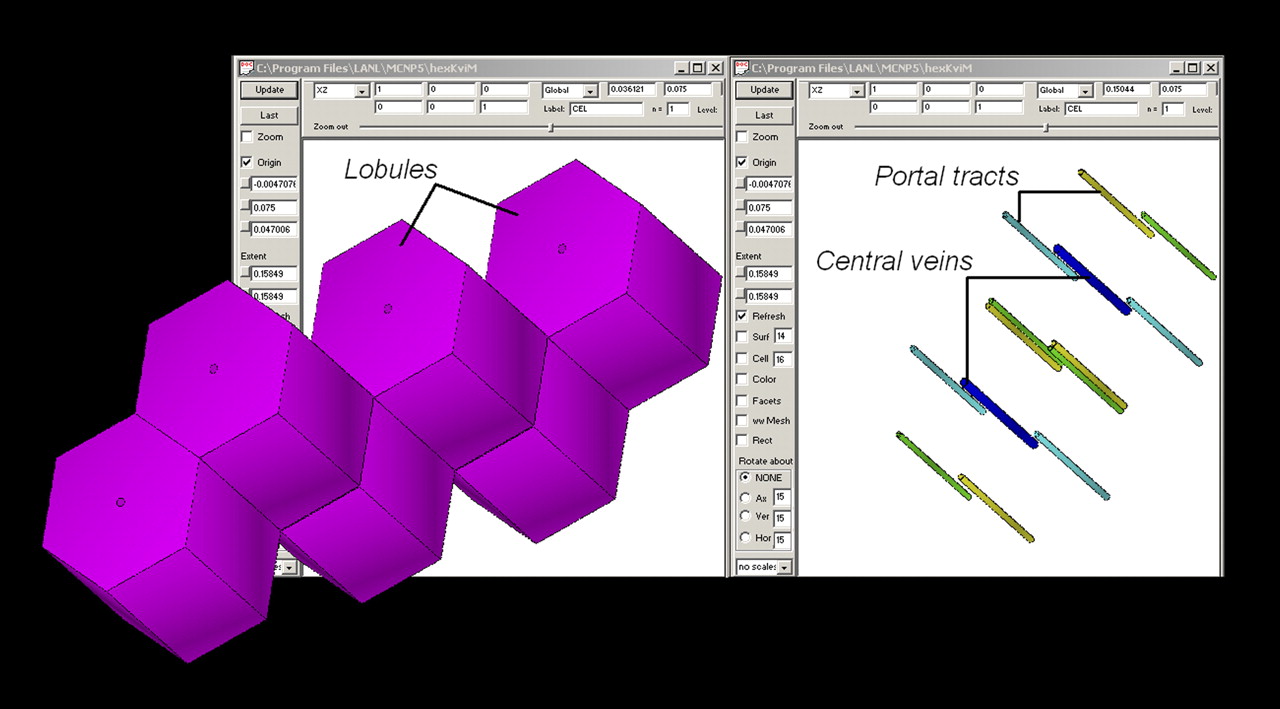
3D depiction of MCNPX lobular model. (Graphical interface: VisEd.)

Planar depiction of model. (A) Plane yz view across stratified layers (in MCNPX: right hexagonal prism, RHP), with whole model height and width. (B) Plane zx view across RHPs (along stratified layers), with whole model length and width. (Graphical interface: MCNPPlot.)
Dimensions of Lobule Structures
The hepatic parenchyma is located between the portal triad and the central vein in each lobule, with a volume only slightly less than that of the lobule, equal to 1.865 mm3 (total volume = total lobular volume − sum of the volumes of all the structures as given in Table 1). The model, based on this quantitative input, considers an average-sized liver of 2 kg (normal plus tumor tissue) containing approximately 1 million lobules, leading to approximately 2 million portal tracts (each liver lobule is associated with 6 portal tracts shared with 3 lobules). The model also assumes that the microsphere distribution is uniform in the portal distribution fractal trajectory. The microspheres reach the terminal arterioles, as they have diameters comparable to those of the microspheres and, neglecting the clustering phenomenon, are arranged in linear fashion.
The MCNPX code was applied to the following scenarios (for which the MIRD macrodosimetry results were also obtained) based on of the number of microspheres estimated to populate the portal tracts: 150-cm3 tumor volume, 3 GBq/60,000,000 spheres; 300-cm3 tumor volume, 3 GBq/60,000,000 spheres; 150-cm3 tumor volume, 3 GBq/1,200,000 spheres; and 300-cm3 tumor volume, 3 GBq/1,200,000 spheres. Thus, each portal tract had 24 spheres containing 50 Bq for the first scenario and 22 spheres containing 50 Bq for the second scenario. For the third and fourth scenarios, the total number of microspheres was less than the number of portal tracts (∼0.5); therefore, one 2,500-Bq microsphere was deposited in every other tract. Additionally, for each scenario, reflective and nonreflective boundary conditions were implemented to analyze the effect of the cross-fire phenomenon, which consists of the radiation energy depositions in the structures of a lobule by particles emitted by sources located in other lobules. The reflective boundary condition is given by a boundary that produces a mirrorlike reflection of the particle trajectory when the particle arrives at the boundary surface, and given that property, it is used for simulating periodic structures. The nonreflective boundary condition allows the particle to leak from the considered volume when the particle reaches the boundary.
RESULTS
The noncompartmental method resulted in a 75-Gy average dose estimate for all clinical scenarios, independent of the tumor volume. When the compartmental method was applied, taking tumor and liver volumes and TLR (equal to 3) into consideration, the calculated liver doses for the 150 and 300 cm3 tumor volume scenarios were 63 and 56 Gy, respectively. The number of spheres for the given 3-GBq activity was not a factor in these dose estimations.
The point dose function for 90Y revealed that the absorbed dose within a radius of 25 μm was much larger than the average liver dose calculated using clinical MIRD dosimetry methods. According to the dose point-kernel reported by Berger (16), 90% of the energy emitted by a 90Y microsphere is absorbed within the first 5.17 mm from the microsphere, a distance called X90. The most significant absorbed doses are delivered at small distances; the dose drops between 80% and 98% of the maximum absorbed dose within distances of 25 and 85 μm, respectively, from the microsphere. If a 50-Bq point source is considered, the doses at those distances would be approximately 78 Gy and approximately 6.6 Gy, respectively, and approximately 0.5 mGy at X90.
The Monte Carlo spheric model results indicated that the absorbed dose abruptly dropped around the portal tract–hepatocellular parenchyma interface and continued to decrease at a marked rate toward the center of the lobule. Figure 5 shows the radial dose distribution around a single 90Y microsphere. The nonuniformity of the dose distribution, as can be seen in Figure 5, indicates that a great amount of energy is deposited close to and around the microspheres, whereas at the distance of more than 40 μm from the center of the microsphere the radiation dose is below 10% of the maximum value. In addition, the average-to-maximum dose ratios show the significant dose nonuniformity around a microsphere. For example, for a 2-mm shell region (i.e., the volume outline at a 2-mm distance from the source), the average-to-maximum dose ratio is 0.02%. In this analysis, we are not considering the dose inside the 90Y microsphere.

Radial dose distribution around 32-μm-diameter 90Y microsphere (50-Bq initial activity). (A) Radial profile that extends until 1 cm. (B) Radial distribution along plane that crosses center of microsphere.
The Monte Carlo lobular microanatomy model revealed average parenchymal and central vein doses that were similar or close to the average liver dose obtained using the compartmental MIRD method. However, the dose estimates in the hepatic artery, bile duct, and portal vein were significantly higher than those of the hepatocellular parenchyma and central vein. Under the nonreflective boundary condition, lower absorbed dose estimates were encountered for parenchymal and central vein targets than when the reflective boundary condition was applied for each of the scenarios. The cross-fire effect (Fig. 6) is demonstrated by the difference between the dose estimates with and without reflective boundary conditions. The comparison between the high-number–low-specific-activity microsphere–populated portal tracts versus the low-number–high-specific-activity populated portal tracts demonstrated slightly lower parenchymal and central vein doses but significantly increased hepatic artery, bile duct, and portal vein doses with the latter combination. The numeric results obtained for the different dosimetric approaches for each clinical scenario are shown in Tables 2–7⇓⇓⇓⇓⇓.

Electron tracks in MCNPX hexagonal lobule model. (Graphical interface: Moritz.)
Results for 3 GBq/60 Million Sphere Administration, 150 cm3 Tumor, and 24 Microspheres per Portal Tract
Results for 3 GBq/60 Million Sphere Administration, 300 cm3 tumor, and 22 Microspheres per Portal Tract
Results for 3 GBq/1.2 Million Sphere Administration, 150 cm3 Tumor, with 1 Microsphere Every Other Portal Tract
Results for 3 GBq/1.2 Million Sphere Administration, 300 cm3 Tumor, with 1 Microsphere Every Other Portal Tract
Cross-Fire Effect by Surrounding Lobules
Specific Activity–Normalized Dose Averages and SDs
Tables 2 and 3, indicating the results for 50-Bq microspheres, and Tables 4 and 5, indicating the results for 2,500-Bq microspheres, show that the liver dose values for the compartmental and structural models are identical but that the doses to each of the microanatomic structures can be significantly different. Doses to portal tracts are consistently larger than twice the liver dose for 50-Bq microspheres. The doses to these structures can be slightly lower or more than approximately 3 times larger than the liver dose when 2,500-Bq microspheres are considered. In all cases, the doses to the central vein are slightly smaller than the liver dose, and the dose to parenchyma is essentially identical to the liver dose.
Table 6 shows the dose to the microanatomic structures when only 1 lobule is populated with microspheres (nonreflective boundary) and when all the lobules are populated with microspheres (reflective boundary) for the same number of microspheres per lobule. The difference between these 2 cases is large and almost comparable to the parenchymal dose.
Table 7 shows the specific activity–normalized dose averaged over different numbers of 50-Bq microspheres assumed to populate each hepatic artery. These values allow the dose to each of the structures to be determined for any given specific activity or activity concentration by simple multiplication because of the consistency of the dose ratios between different microanatomic lobule structures.
DISCUSSION
The first important finding revealed by the hepatic lobular Monte Carlo modeling was the demonstration of the much higher absorbed doses for the portal tract structures than the average liver dose estimates based on the MIRD macrodosimetry techniques. Because of the unique localization pattern of the microspheres in the lobular Monte Carlo lattice geometry, even though the maximum range of β-particles in the liver is approximately 11 mm (5–10 times the lobule width), a significant fraction of absorbed dose is delivered within the portal tract domain. In addition, radial dose function analysis and spheric Monte Carlo modeling demonstrated a rapid fall in the absorbed dose within a short distance from the microsphere (Fig. 5).
The central vein, which is approximately 700 μm from a deposited microsphere, received an absorbed dose that is less than 6% of the dose received by the portal tract (distance, ≤150 μm from the microsphere). A parenchymal zone, 1 mm away from a microsphere, receives an absorbed dose that is less than 1% of the dose received by the portal tract. This relatively simplistic approach indicates that it may be difficult to reach the normal-tissue complication probability external-beam radiotherapy–derived tolerance dose of 30 Gy for a 5% complication rate within 5 y (TD5/5) for uniform irradiation of the whole liver, which also means that same dose to the central vein (20). However, neither the radial dose function analysis nor the spheric Monte Carlo modeling approach takes into account the potential distal contributions from other microspheres. The effect of this cross-fire phenomenon on the hepatocellular parenchyma and central vein from the microspheres populating the corners of a hexagonal lobule was, however, considered in the lobular Monte Carlo modeling approach.
The second important finding obtained from the hepatic lobular Monte Carlo modeling was the demonstration of the significance of the cross-fire effect, leading to markedly increased absorbed dose values in the hepatocellular parenchyma and central vein. A central vein–to–portal vein ratio of approximately 0.06 obtained from the spheric MCNPX model increased to approximately 0.5 when the lobular MCNPX model was used. The cross-fire effect in the perimeter of the tumors was expected to occur within a distance of β-particle maximum range (i.e., 11 mm). This effect is directly related to the average activity in the tumor region within that range and in the adjacent lobules. Interestingly, the average liver dose estimates by the compartmental method correlated well with the MCNPX results for the hepatocellular parenchyma and central vein. This analysis also demonstrated a linear relationship between the centrilobular and centriacinar dose estimates that could prove to be useful in future predictions of specific complications of 90Y radiomicrosphere therapy (Fig. 7).
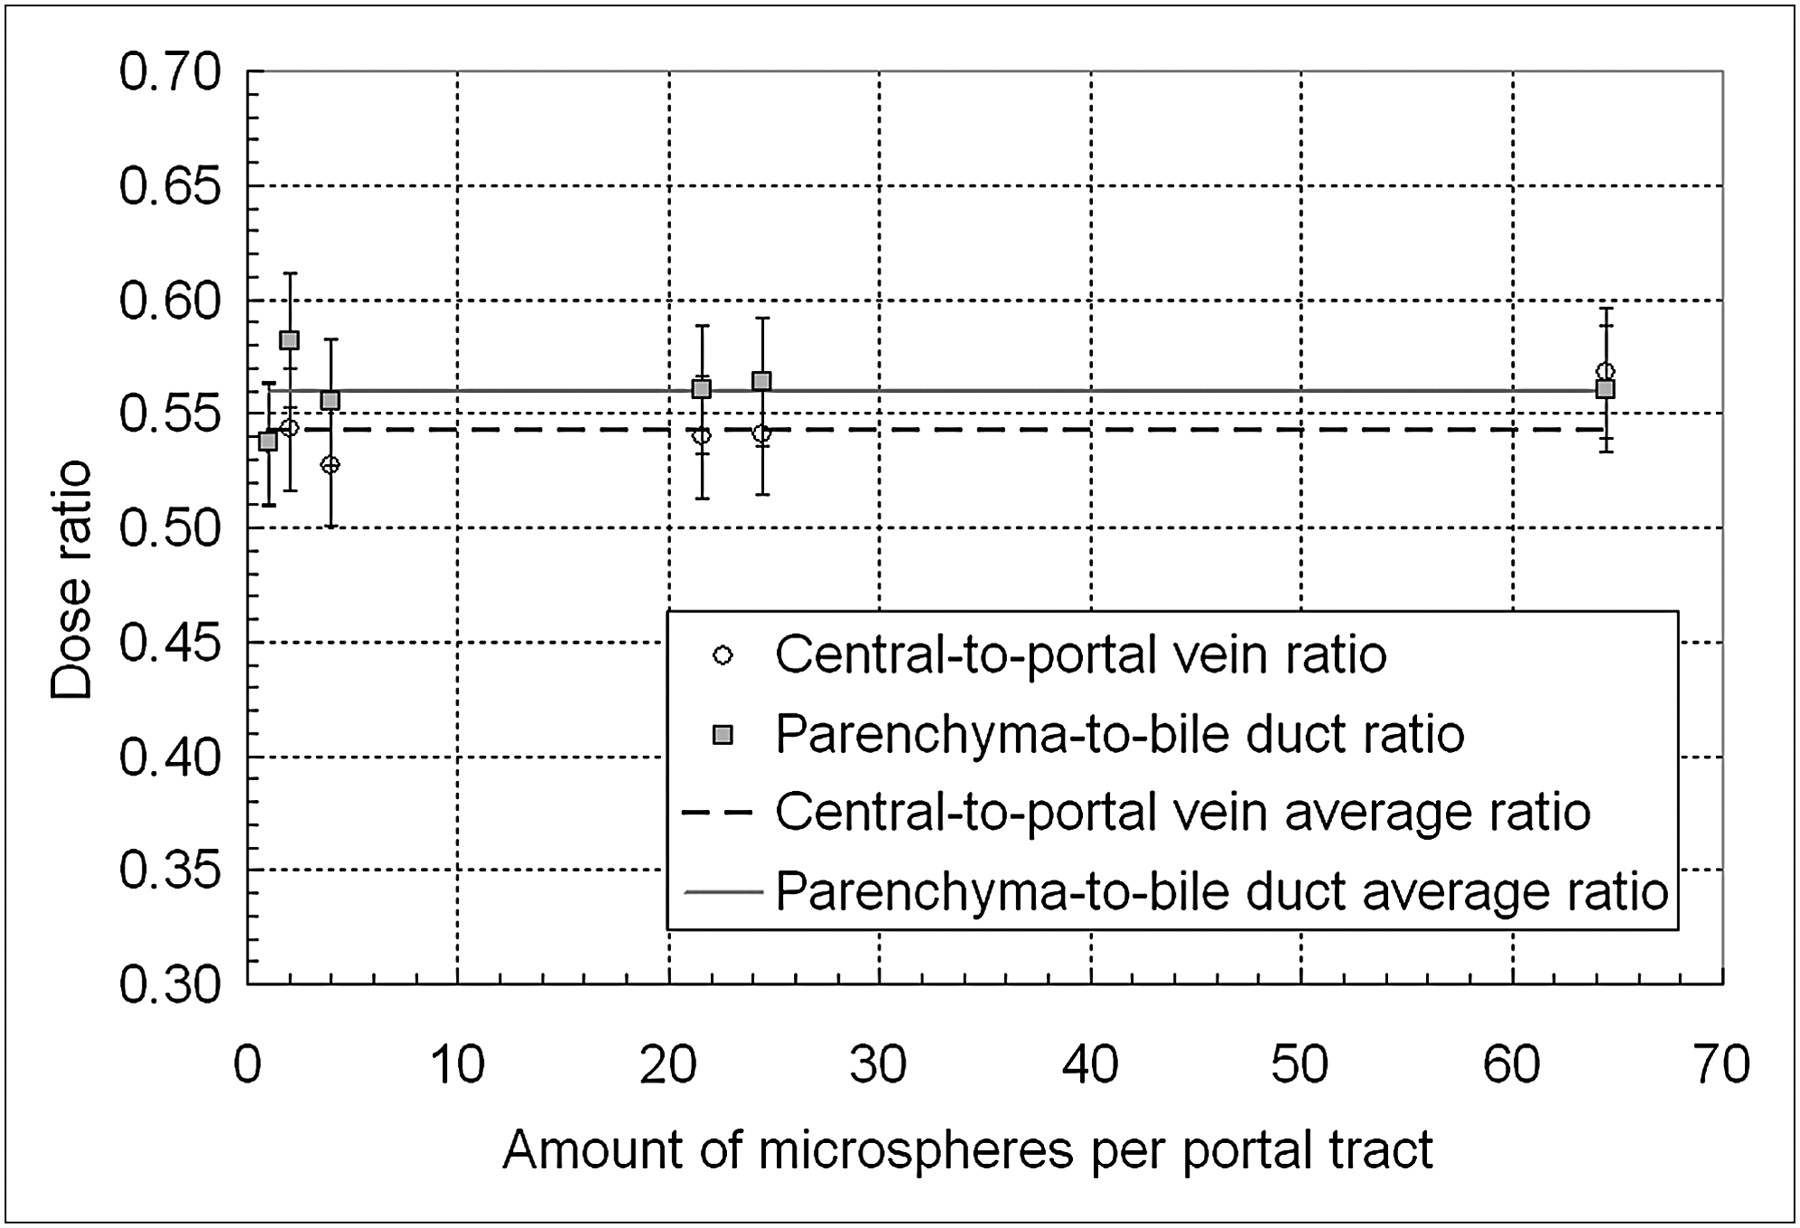
Dose ratios between central and portal veins and between parenchyma and bile ducts. Ratios are shown for different numbers of microspheres per portal tract. Mean values of those ratios are also presented.
The toxicity profile for 90Y radiomicrosphere therapy, despite its growing clinical applications, has not been clearly defined. This is due in part to the relative paucity of appropriate dosimetry data to help clarify the dose–response relationship. The highly complex disease presentation and progression patterns, variable functional liver reserve due to preexisting disease processes, and multiple prior treatments further complicate the evaluation of the treatment-associated toxicity. The growing number of observations suggests that radiomicrosphere-induced liver disease (RMILD) has a different profile from that of the classic radiation-induced liver disease (RILD) of external-beam therapy. The pathogenesis of radiation damage to the liver from the latter is dominated by vascular injury to the central vein, which is the most radiosensitive structural component in the hepatic microanatomy (21). The earliest event observed in the central vein caused by external-beam radiation is intimal damage, which leads to an eccentric wall thickening. This process, when diffuse and progressive, results in clinical venoocclusive disease characterized by the development of postsinusoidal portal hypertension, ascites, and a deterioration in liver function tests (21). Venoocclusive disease is the hallmark of classic RILD. On the other hand, by virtue of the significantly higher absorbed dose values in the portal tracts, a subacute and chronic portal triaditis, characterized by presinusoidal portal hypertension or cholangiopathy, could predominate the clinical picture of RMILD. An irregular microsphere distribution in the portal tract framework may result in a rather patchy pattern of injury, leading to clinically variable RMILD presentations. Clinically, the most commonly detected abnormalities are persistent alkaline phosphatase elevation and splenomegaly. The varying degrees of splenomegaly that have been observed after SIRT might suggest subclinical or low-grade portal hypertension (3,22). A predominance of biliary toxicity in RMILD has been emphasized in more recent publications (23,24). A clear definition of RMILD will require well-designed studies investigating the liver dose–toxicity relationship in a systematic manner. The safe liver radiation absorbed dose estimates reported using noncompartmental MIRD macrodosimetry clearly overestimate the radiation tolerance of liver tissue (25). Significant liver toxicity, particularly in high-risk patient populations, could occur at doses selected on the basis of empiric and nondosimetric guidance (9,26).
The deductions drawn on the basis of this reported structural dosimetry study are subject to the limitations of the lobular model design. The model is developed on the basis of full population of all corners of a lobule, which could overestimate the cross-fire effect. Additionally, the development of a MCNPX hexagonal lobule model inclusive of micrometric scales presents an important factor to be considered. This factor is the path length in which the electrons change their energy along the particle track simulated by MCNPX (considered in the MCNPX ESTEP card). For the case of 90Y β-particles, the default MCNPX range is on the order of the smallest dimensions of the lobular liver structures. Therefore, this range should be reduced to improve the quality of the MCNPX simulations. However, this improvement will greatly affect the MCNPX computational time. Another factor to be considered is the distance that must exist between coincident-repeated structures surfaces in order for them to be considered coincident (considered in ninth entry of MCNPX DBCN card), that is, the need to set these values to much smaller distances than the size of the microstructures. Finally, this article validates the clinical value of the compartmental MIRD macrodosimetry model (also known as partition model (27)) that provides clinically useful and reproducible average liver dose estimates. Additionally, on the basis of the linear relationship demonstrated between the average liver and portal tract dose estimates, the MIRD compartmental approach could provide relatively accurate dose estimates for the biliary and portal venous tracts, with potentially important implications. The technique and the clinical application of this method have been well described in the literature (27–30).
A careful assessment of portal triad toxicity should be considered, although 90Y microsphere therapy permits the specific delivery of much higher radiation doses to tumors than is possible by external-beam radiotherapy, and the hepatocellular and central vein toxicities may not predominate. Specific dose estimates to the functional subunits of the hepatic architecture, as reported in this study, could improve our understanding of SIRT-associated hepatic complications—that is, RMILD—which clearly have a distinct clinical presentation dissimilar to that of RILD, which is based on the more traditional external-beam radiation experience.
CONCLUSION
The reported microstructural dosimetry models can help in the detailed assessment of the dose distributions in the hepatic functional subunits and in relating these doses to their effects. These models have also revealed that there is a consistent relationship between the average liver dose as calculated by MIRD macrodosimetry and the structural dosimetry estimates in support of the clinical utility of the MIRD methodology. This relationship could be used to more realistically assess patterns of hepatic toxicity associated with the 90Y SIRT treatment.
Footnotes
-
COPYRIGHT © 2010 by the Society of Nuclear Medicine, Inc.
References
- Received for publication August 14, 2009.
- Accepted for publication October 26, 2009.


Jump to section
Related Articles
Cited By...
- A Microdosimetric Analysis of Absorbed Dose to Tumor as a Function of Number of Microspheres per Unit Volume in 90Y Radioembolization
- The Low Hepatic Toxicity per Gray of 90Y Glass Microspheres Is Linked to Their Transport in the Arterial Tree Favoring a Nonuniform Trapping as Observed in Posttherapy PET Imaging
- Image-Guided Personalized Predictive Dosimetry by Artery-Specific SPECT/CT Partition Modeling for Safe and Effective 90Y Radioembolization
- Clinical Feasibility of Fast 3-Dimensional Dosimetry of the Liver for Treatment Planning of Hepatocellular Carcinoma with 90Y-Microspheres