
Main menu

  • Home
  • Content
    • Current
    • Ahead of print
    • Past Issues
    • JNM Supplement
    • SNMMI Annual Meeting Abstracts
    • Continuing Education
    • JNM Podcasts
  • Subscriptions
    • Subscribers
    • Institutional and Non-member
    • Rates
    • Journal Claims
    • Corporate & Special Sales
  • Authors
    • Submit to JNM
    • Information for Authors
    • Assignment of Copyright
    • AQARA requirements
  • Info
    • Reviewers
    • Permissions
    • Advertisers
  • About
    • About Us
    • Editorial Board
    • Contact Information
  • More
    • Alerts
    • Feedback
    • Help
    • SNMMI Journals
  • SNMMI
    • JNM
    • JNMT
    • SNMMI Journals
    • SNMMI

User menu

  • Subscribe
  • My alerts
  • Log in
  • My Cart

Search

  • Advanced search
Journal of Nuclear Medicine
  • SNMMI
    • JNM
    • JNMT
    • SNMMI Journals
    • SNMMI
  • Subscribe
  • My alerts
  • Log in
  • My Cart
Journal of Nuclear Medicine

Advanced Search

  • Home
  • Content
    • Current
    • Ahead of print
    • Past Issues
    • JNM Supplement
    • SNMMI Annual Meeting Abstracts
    • Continuing Education
    • JNM Podcasts
  • Subscriptions
    • Subscribers
    • Institutional and Non-member
    • Rates
    • Journal Claims
    • Corporate & Special Sales
  • Authors
    • Submit to JNM
    • Information for Authors
    • Assignment of Copyright
    • AQARA requirements
  • Info
    • Reviewers
    • Permissions
    • Advertisers
  • About
    • About Us
    • Editorial Board
    • Contact Information
  • More
    • Alerts
    • Feedback
    • Help
    • SNMMI Journals
  • View or Listen to JNM Podcast
  • Visit JNM on Facebook
  • Join JNM on LinkedIn
  • Follow JNM on Twitter
  • Subscribe to our RSS feeds
OtherBASIC SCIENCE INVESTIGATIONS

Hepatic Structural Dosimetry in 90Y Microsphere Treatment: A Monte Carlo Modeling Approach Based on Lobular Microanatomy

Seza A. Gulec, Manuel L. Sztejnberg, Jeffry A. Siegel, Tatjana Jevremovic and Michael Stabin
Journal of Nuclear Medicine February 2010, 51 (2) 301-310; DOI: https://doi.org/10.2967/jnumed.109.069278
Seza A. Gulec
  • Find this author on Google Scholar
  • Find this author on PubMed
  • Search for this author on this site
Manuel L. Sztejnberg
  • Find this author on Google Scholar
  • Find this author on PubMed
  • Search for this author on this site
Jeffry A. Siegel
  • Find this author on Google Scholar
  • Find this author on PubMed
  • Search for this author on this site
Tatjana Jevremovic
  • Find this author on Google Scholar
  • Find this author on PubMed
  • Search for this author on this site
Michael Stabin
  • Find this author on Google Scholar
  • Find this author on PubMed
  • Search for this author on this site
  • Article
  • Figures & Data
  • Info & Metrics
  • PDF
Loading

Article Figures & Data

Figures

  • Tables
  • FIGURE 1. 
    • Download figure
    • Open in new tab
    • Download powerpoint
    FIGURE 1. 

    Hepatic lobular architecture. (A) Central vein runs along central axis of each lobule, all of which merge to form hepatic veins. Hepatocytes occupy greatest volume of lobule, forming cords between portal triads and central vein, separated by sinusoids. (B) Repeating units of lobules form lattice pattern discernible on histologic sections.

  • FIGURE 2. 
    • Download figure
    • Open in new tab
    • Download powerpoint
    FIGURE 2. 

    90Y microsphere spheric model. Shell thicknesses: 10 μm (A), 100 μm (B), 1 mm (C), and 10 cm (D). (Graphical interface: MCNPPlot.)
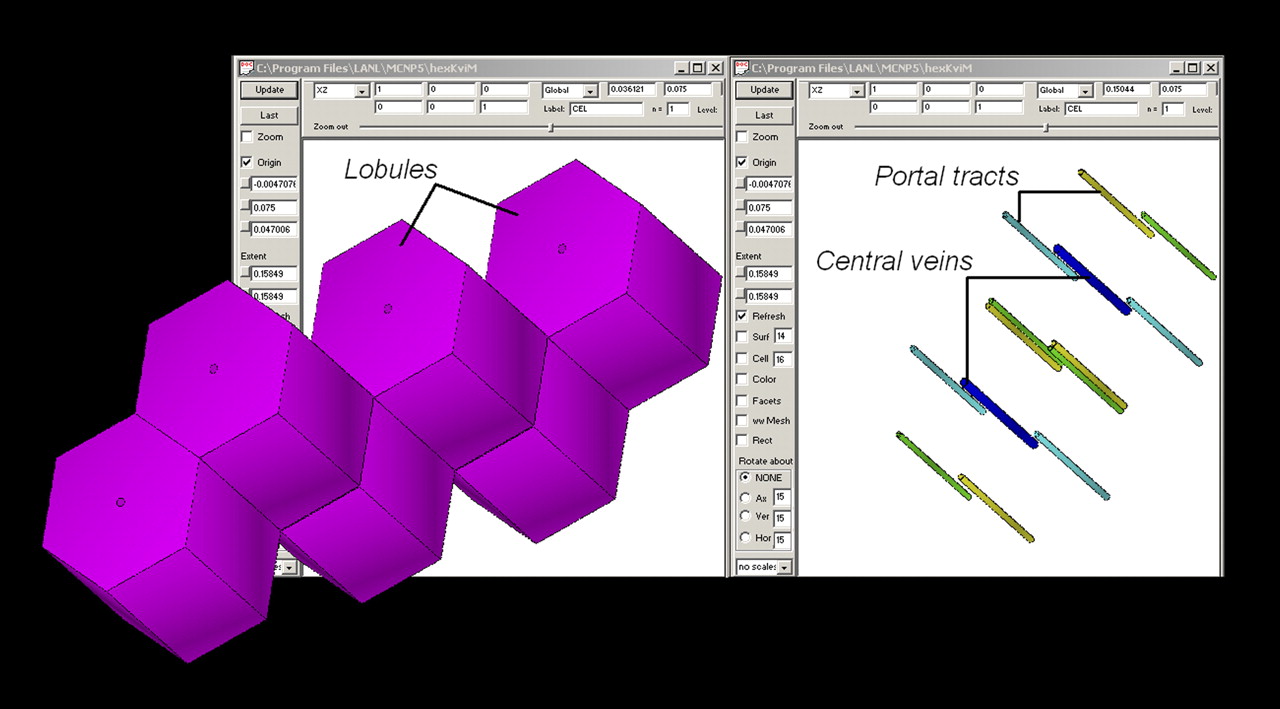
  • FIGURE 3. 
    • Download figure
    • Open in new tab
    • Download powerpoint
    FIGURE 3. 

    3D depiction of MCNPX lobular model. (Graphical interface: VisEd.)

  • FIGURE 4. 
    • Download figure
    • Open in new tab
    • Download powerpoint
    FIGURE 4. 

    Planar depiction of model. (A) Plane yz view across stratified layers (in MCNPX: right hexagonal prism, RHP), with whole model height and width. (B) Plane zx view across RHPs (along stratified layers), with whole model length and width. (Graphical interface: MCNPPlot.)

  • FIGURE 5. 
    • Download figure
    • Open in new tab
    • Download powerpoint
    FIGURE 5. 

    Radial dose distribution around 32-μm-diameter 90Y microsphere (50-Bq initial activity). (A) Radial profile that extends until 1 cm. (B) Radial distribution along plane that crosses center of microsphere.

  • FIGURE 6. 
    • Download figure
    • Open in new tab
    • Download powerpoint
    FIGURE 6. 

    Electron tracks in MCNPX hexagonal lobule model. (Graphical interface: Moritz.)

  • FIGURE 7. 
    • Download figure
    • Open in new tab
    • Download powerpoint
    FIGURE 7. 

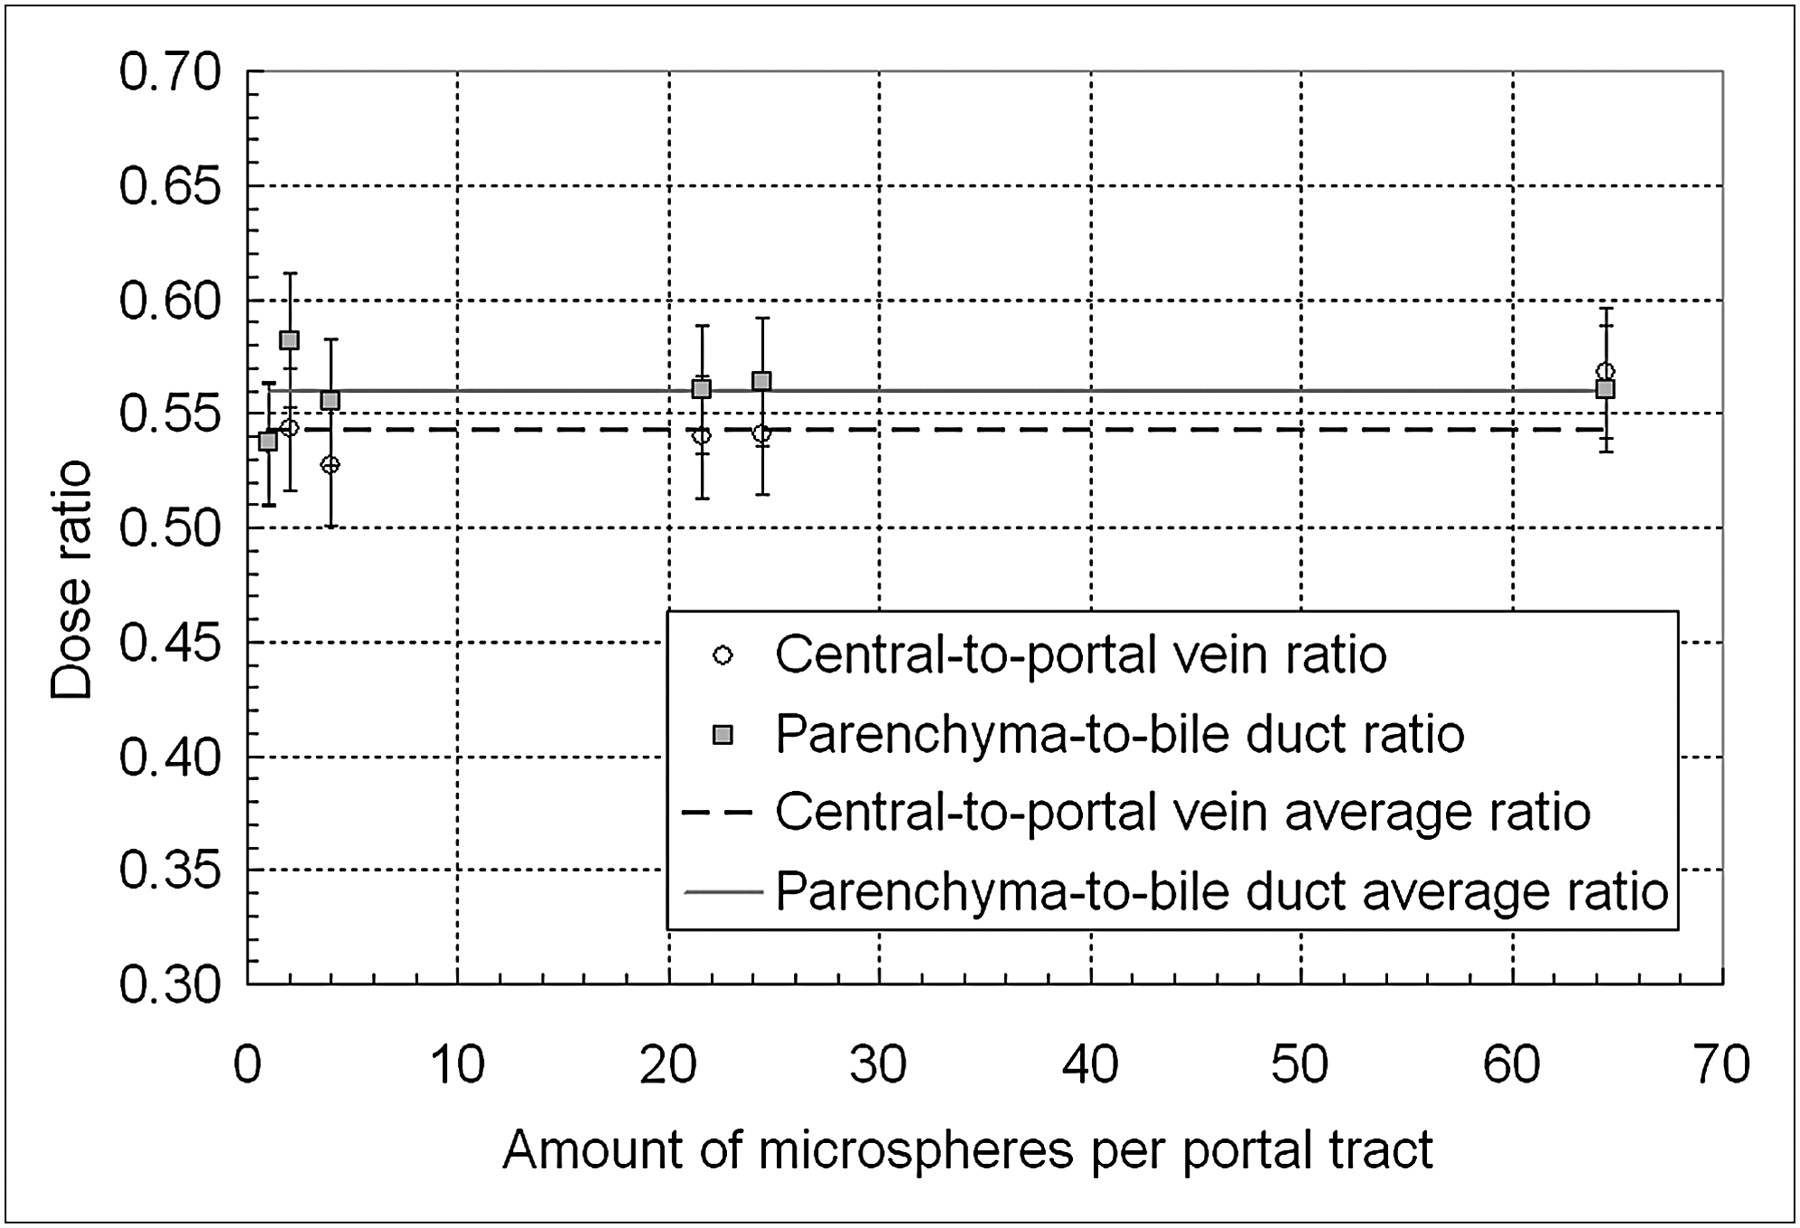
    Dose ratios between central and portal veins and between parenchyma and bile ducts. Ratios are shown for different numbers of microspheres per portal tract. Mean values of those ratios are also presented.

Tables

  • Figures
    • View popup
    TABLE 1

    Dimensions of Lobule Structures

    StructureInner radius (μm)Outer radius (μm)Length (μm)Volume (mm3)
    Central vein28331,3001.25·10−3
    Portal vein1823.51,3009.32·10−4
    Hepatic artery15241,3001.43·10−3
    Bile ductule13.1211,3001.10·10−3
    90Y microsphere—15—1.41·10−5
    Lobule—6001,5001.87
    • View popup
    TABLE 2

    Results for 3 GBq/60 Million Sphere Administration, 150 cm3 Tumor, and 24 Microspheres per Portal Tract

    ModelNoncompartmentalCompartmentalStructural
    Fractional liver uptakeNA0.80.8
    Activity in liver (GBq)32.42.4
    No. of spheres in liver (M)604848
    Liver dose (Gy)756364
    Tumor dose (Gy)NA167NA
    Hepatic artery dose (Gy)NANA188
    Bile duct dose (Gy)NANA112
    Portal vein dose (Gy)NANA109
    Parenchymal dose (Gy)NANA63
    Central vein dose (Gy)NANA59
    • NA = not assessed.

    • 2,000 cm3 liver; LSF, 0; TLR, 3.

    • View popup
    TABLE 3

    Results for 3 GBq/60 Million Sphere Administration, 300 cm3 tumor, and 22 Microspheres per Portal Tract

    ModelNoncompartmentalCompartmentalStructural
    Fractional liver uptakeNA0.650.65
    Activity in liver (GBq)31.951.95
    No. of spheres in liver (M)603939
    Liver dose (Gy)755656
    Tumor dose (Gy)NA167NA
    Hepatic artery dose (Gy)NANA167
    Bile duct dose (Gy)NANA100
    Portal vein dose (Gy)NANA97
    Parenchymal dose (Gy)NANA56
    Central vein dose (Gy)NANA52
    • NA = not assessed.

    • 2,000 cm3 liver; LSF, 0; TLR, 3.

    • View popup
    TABLE 4

    Results for 3 GBq/1.2 Million Sphere Administration, 150 cm3 Tumor, with 1 Microsphere Every Other Portal Tract

    ModelNoncompartmentalCompartmentalStructural
    Fractional liver uptakeNA0.80.8
    Activity in liver (GBq)32.42.4
    No. of spheres in liver (M)60480.96
    Liver dose (Gy)756364
    Tumor dose (Gy)NA167NA
    Hepatic artery dose (Gy)NANA58–339
    Bile duct dose (Gy)NANA58–171
    Portal vein dose (Gy)NANA58–167
    Parenchymal dose (Gy)NANA64
    Central vein dose (Gy)NANA58
    • NA = not assessed.

    • 2,000 cm3 liver; LSF, 0; TLR, 3. Doses to portal tract structures are reported for both with- and without-microsphere cases.

    • View popup
    TABLE 5

    Results for 3 GBq/1.2 Million Sphere Administration, 300 cm3 Tumor, with 1 Microsphere Every Other Portal Tract

    ModelNoncompartmentalCompartmentalStructural
    Fractional liver uptakeNA0.650.65
    Activity in liver (GBq)31.951.95
    No. of spheres in liver (M)600.780.78
    Liver dose (Gy)755657
    Tumor dose (Gy)NA167NA
    Hepatic artery dose (Gy)NANA52–300
    Bile duct dose (Gy)NANA51–151
    Portal vein dose (Gy)NANA51–148
    Parenchymal dose (Gy)NANA56
    Central vein dose (Gy)NANA51
    • NA = not assessed.

    • 2,000 cm3 liver; LSF, 0; TLR, 3. Doses to portal tract structures are reported for both with- and without-microsphere cases.

    • View popup
    TABLE 6

    Cross-Fire Effect by Surrounding Lobules

    StructureAbsorbed dose (Gy) Reflective boundaryNonreflective boundaryDifference
    Central veins591247
    Portal veins1095950
    Hepatic arteries18813751
    Bile ductules1126250
    Parenchyma631548
    • 2,000 cm3 liver; LSF, 0; TLR, 3; 3 GBq/60 M sphere administration, 150 cm3 tumor, and 24 microspheres per portal tract.

    • View popup
    TABLE 7

    Specific Activity–Normalized Dose Averages and SDs

    StructureSpecific activity–normalized dose (Gy/MBq/g)Relative SD
    Central veins473%
    Portal veins863%
    Hepatic arteries1483%
    Bile ductules873%
    Parenchyma490.5%
    • Cases considered for estimates are 1, 2, 4, 22, 24, and 64 microspheres per portal tract. SDs are similar to simulation numeric errors.

PreviousNext
Back to top

In this issue

Journal of Nuclear Medicine: 51 (2)
Journal of Nuclear Medicine
Vol. 51, Issue 2
February 2010
  • Table of Contents
  • Table of Contents (PDF)
  • About the Cover
  • Index by author
Print
Download PDF
Article Alerts
Sign In to Email Alerts with your Email Address
Email Article

Thank you for your interest in spreading the word on Journal of Nuclear Medicine.

NOTE: We only request your email address so that the person you are recommending the page to knows that you wanted them to see it, and that it is not junk mail. We do not capture any email address.

Enter multiple addresses on separate lines or separate them with commas.
Hepatic Structural Dosimetry in 90Y Microsphere Treatment: A Monte Carlo Modeling Approach Based on Lobular Microanatomy
(Your Name) has sent you a message from Journal of Nuclear Medicine
(Your Name) thought you would like to see the Journal of Nuclear Medicine web site.
Citation Tools
Hepatic Structural Dosimetry in 90Y Microsphere Treatment: A Monte Carlo Modeling Approach Based on Lobular Microanatomy
Seza A. Gulec, Manuel L. Sztejnberg, Jeffry A. Siegel, Tatjana Jevremovic, Michael Stabin
Journal of Nuclear Medicine Feb 2010, 51 (2) 301-310; DOI: 10.2967/jnumed.109.069278

Citation Manager Formats

  • BibTeX
  • Bookends
  • EasyBib
  • EndNote (tagged)
  • EndNote 8 (xml)
  • Medlars
  • Mendeley
  • Papers
  • RefWorks Tagged
  • Ref Manager
  • RIS
  • Zotero
Share
Hepatic Structural Dosimetry in 90Y Microsphere Treatment: A Monte Carlo Modeling Approach Based on Lobular Microanatomy
Seza A. Gulec, Manuel L. Sztejnberg, Jeffry A. Siegel, Tatjana Jevremovic, Michael Stabin
Journal of Nuclear Medicine Feb 2010, 51 (2) 301-310; DOI: 10.2967/jnumed.109.069278
Twitter logo Facebook logo LinkedIn logo Mendeley logo
  • Tweet Widget
  • Facebook Like
  • Google Plus One
Bookmark this article

Jump to section

  • Article
    • Abstract
    • MATERIALS AND METHODS
    • RESULTS
    • DISCUSSION
    • CONCLUSION
    • Footnotes
    • References
  • Figures & Data
  • Info & Metrics
  • PDF

Related Articles

  • This Month in JNM
  • PubMed
  • Google Scholar

Cited By...

  • A Microdosimetric Analysis of Absorbed Dose to Tumor as a Function of Number of Microspheres per Unit Volume in 90Y Radioembolization
  • The Low Hepatic Toxicity per Gray of 90Y Glass Microspheres Is Linked to Their Transport in the Arterial Tree Favoring a Nonuniform Trapping as Observed in Posttherapy PET Imaging
  • Image-Guided Personalized Predictive Dosimetry by Artery-Specific SPECT/CT Partition Modeling for Safe and Effective 90Y Radioembolization
  • Clinical Feasibility of Fast 3-Dimensional Dosimetry of the Liver for Treatment Planning of Hepatocellular Carcinoma with 90Y-Microspheres
  • Google Scholar

More in this TOC Section

  • Design and Fabrication of Kidney Phantoms for Internal Radiation Dosimetry Using 3D Printing Technology
  • Synthesis and Biologic Evaluation of Novel 18F-Labeled Probes Targeting Prostate-Specific Membrane Antigen for PET of Prostate Cancer
  • Tumor-Specific Binding of Radiolabeled PEGylated GIRLRG Peptide: A Novel Agent for Targeting Cancers
Show more Basic Science Investigations

Similar Articles

SNMMI

© 2025 SNMMI

Powered by HighWire