


Abstract
Several treatment strategies are used for selective internal radiation therapy with 90Y-microspheres. The diversity of approaches does not favor the standardization of the prescribed activity calculation. To this aim, a fast 3-dimensional (3D) dosimetry method was developed for 90Y-microsphere treatment planning and was clinically evaluated retrospectively. Methods: Our 3D approach is based on voxel S values (VSVs) and has been implemented in the software tool VoxelDose. VSVs were previously calculated at a fine voxel size. The time-integrated activity (TIA) map is derived from pretherapeutic 99mTc-macroaggregated-albumin SPECT/CT. The fine VSV map is resampled at the voxel size of the TIA map. Then, the TIA map is convolved with the resampled VSV map to construct the 3D dose map. Data for 10 patients with 12 tumor sites treated by 90Y-microspheres for hepatocellular carcinoma were collected retrospectively. 3D dose maps were computed for each patient, and tumoral liver and nontumoral liver (TL and NTL, respectively) were delineated, allowing the computation of descriptive statistics (i.e., mean absorbed dose, minimum absorbed dose, and maximum absorbed dose) and dose–volume histograms. Mean absorbed doses in TL and NTL from VoxelDose were compared with those calculated with the standard partition model. Results: The estimated processing time for a complete 3D dosimetry calculation is on the order of 15 min, including 10 s for the dose calculation (i.e., VSV resampling and convolution). An additional 45 min was needed for the semiautomatic and manual segmentation of TL and NTL. The mean absorbed dose (±SD) was 422 ± 263 Gy for TL and 50.1 ± 36.0 Gy for NTL. The comparison between VoxelDose and partition model shows a mean relative difference of 1.5% for TL and 4.4% for NTL. Results show a wide spread of voxel-dose values around mean absorbed dose. The minimum absorbed dose within TL ranges from 32 to 267 Gy (n = 12). The fraction of NTL volume irradiated with at least 80 Gy ranges from 4% to 70% (n = 10), and the absorbed dose from which 25% of NTL was the least irradiated ranges from 14 to 178 Gy. Conclusion: This article demonstrates the feasibility of a fast 3D dosimetry method for 90Y-microspheres and highlights the potential value of a 3D treatment planning strategy.
Selective internal radiation therapy (SIRT) via intrahepatic arterial administration of 90Y-microspheres, also called transarterial radioembolization, is a promising modality for the treatment of primary and metastatic liver cancer. The clinical efficacy and relative safety of SIRT have been demonstrated in several prospective and retrospective studies (1,2). Two microsphere products are commercially available. TheraSphere (glass microspheres; MDS Nordion) and SIR-Spheres (resin microspheres; Sirtex Medical) were approved by the U.S. Food and Drug Administration in 1999 and 2002, respectively.
The efficiency of SIRT treatment is based on a vascular selectivity process responsible for a differential effect leading to a higher concentration of radioactivity within the tumor tissue than in nontumoral tissues. The more differential this effect is, the more effective the treatment should be. Selectivity of microspheres can be improved by obstructing certain vessels during a pretreatment hepatic angiogram to spare healthy tissue, but the resulting differential effect is still constrained by the arterial system. It is well known that the anatomy of the mesenteric system and the hepatic arterial bed has a high degree of variation among patients (3).
The incidence of complications after SIRT for appropriately selected patients is low (4), but serious complications have been reported when microspheres were inadvertently deposited in excessive amounts in organs other than liver—that is, extrahepatic visceral sites (5–8) and to a lesser extent the lungs (9). Previous studies with 90Y-microspheres demonstrated that the highest tolerable dose to the lungs can reach 30 Gy for a single injection (10).
Several methods have been proposed in the literature to assess the prescribed activity. Some of them are based on empiric models (11), whereas others are based on a planning treatment strategy including a dosimetry step (12,13). For glass microspheres, the recommended dose to the targeted liver defined on CT images (i.e., lobe, segment, or subsegment) is between 80 and 150 Gy, leading to a wide range of possible administered activity (14). Thus, a more restrictive range of 120 ± 20 Gy is often prescribed. For resin microspheres, a first method recommends a standard amount of administered activity, which is adapted only according to the tumor size with respect to the volume of the liver. A variant of this empiric method is to adjust the administered activity also according to the body surface area (11).
The aim of treatment planning methods based on dosimetry is to optimize the tumor response and prevent complications by administering the highest possible activity to the tumor while maintaining low radiation dose to sensitive tissues such as the lungs and normal or cirrhotic liver. This method is based on the standard MIRD scheme at the organ and tissue level (15) and is called the partition model (12). This planning treatment strategy needs volume measurement of the liver and tumor tissues and the amount of implanted activity into each of these 2 compartments and lungs. This approach has been included in the standard procedure for resin microspheres (11), with a dose constraint of 80 Gy to normal liver, 70 Gy to cirrhotic liver, and no constraint to the tumor.
This diversity of approaches does not favor standardized medical practices and leads to wide variation in the prescription of the administered activity, complicating the interpretation of clinical results and metaanalysis and the treatment efficiency.
The treatment procedure outline is as follows (16). First, a pretreatment hepatic angiogram was performed, and all vessels that could transport microspheres to nontarget organs were identified and, if possible, blocked to prevent the spread of 90Y-microspheres outside the liver. To simulate the treatment, 99mTc-macroaggregated-albumin (99mTc-MAA) was injected into the hepatic artery in a manner similar to the application during microsphere treatment. Then, the distribution of 99mTc-MAA was visualized by γ-scintigraphy. Planar or whole-body scintigraphy was performed to identify extrahepatic accumulation of radioactivity and to assess lung shunt fraction (F). Additional SPECT and SPECT/CT scans have also been proposed to improve the sensitivity and specificity (17) in the identification of extrahepatic visceral sites at risk to select patients and prevent postinjection complications (18).
The combination of morphologic imaging (CT or CT angiography) and functional imaging (planar, whole body, SPECT, or SPECT/CT) can be used for volume and activity measurements to assess the prescribed activity according to the planning strategy used. The whole dosimetry process for the treatment planning can be time-consuming because of nondedicated software tools. Furthermore, the prescribed dose refers to a mean absorbed dose (Dmean) without taking into account the heterogeneity of dose distribution within the liver and tumor tissue. In external-beam radiation therapy (EBRT), it has been established for many years that not only the mean dose but also the 3D dose distribution are essential parameters to predict treatment efficiency and protect organs at risk. The latter is analyzed using isodose curves and dose–volume histograms (DVHs).
Our aim was to propose a fast 3D dosimetry methodology for SIRT with 90Y-microspheres allowing the assessment of the Dmean to the tumoral liver (TL) and the nontumoral liver (NTL) isodose curves and DVH. The 3D dose calculation is based on fine voxel S values (VSVs) (19) and has been implemented in the software tool VoxelDose (20). As a proof of concept, the clinical feasibility of our 3D approach was tested retrospectively with data from 10 patients treated by 90Y-microspheres for hepatocellular carcinoma (HCC) at the Comprehensive Cancer Institute Eugène Marquis of Rennes (France).
MATERIALS AND METHODS
3D Dosimetry Principles
The proposed 3D dosimetry approach is based on the MIRD scheme at the voxel level described in the MIRD Pamphlet 17 (21) and recently extended to any voxel dimensions (19). Briefly, the Dmean to a target voxel, T, is the result of the contribution of itself and all surrounding voxel sources S:
Both can be represented as matrices. Thus, Equation 1 was implemented as a discrete convolution between the TIA map containing each individual Ã(voxelS) and the VSV map. The TIA map and VSV map must have the same voxel size. To the aim of calculating absorbed doses whatever the SPECT device and voxel dimension, the VSVs were previously calculated at a fine voxel size for several radionuclides and medium (i.e., soft tissues and lung) with the Monte Carlo code MCNPX (22) (Oak Ridge National Laboratory). To adapt these fine-resolution VSV sets to the TIA map voxel size, a resampling algorithm was developed (19) to create a VSV map at the desired voxel dimension. After this resampling process, the 3D dose map was calculated by convolving the TIA map with the VSV map using the fast Hartley transform. The procedure is illustrated in Figure 1.

Diagram illustrating principle of 3D dosimetry approach. Precalculated fine VSV map is resampled at voxel size of TIA map. Then, resampled VSV map is convolved with TIA map to compute 3D absorbed dose for each individual voxel.
When tissues or organs are delineated, several parameters and descriptive statistics on the 3D dose map can be computed, such as the Dmean and median, maximum, and minimum absorbed doses in the corresponding volume of interest (Dmed, Dmax, and Dmin [in Gy], respectively). Several tools have also been developed for the 3D dose map analysis. Isodose curves can be drawn and the corresponding volumes calculated, as well as DVHs, from which characteristic values can be noted.
Patients and Treatment with 90Y-Microspheres
Data for 10 patients receiving SIRT with glass microspheres for HCC were collected to perform a retrospective dosimetry. Glass microspheres were prescribed as a first-line treatment for 6 patients and after a recurrence of HCC for 4 patients. In 5 patients, the HCC was multifocal. The average tumor diameter (±SD) was 6.8 ± 3.3 cm.
The treatment was performed as described by Salem et al. (23) and following the instructions for use of glass microspheres (14). A pretreatment hepatic angiogram was performed to evaluate the potential lung and gastrointestinal irradiation. At the end of this first angiogram, 110 MBq of 99mTc-MAA were injected. A planar acquisition (256 × 256; 5 min) and SPECT/CT projections were acquired on a Symbia T2 γ-camera (Siemens Healthcare) (64 projections, 360°, 128 × 128, 30 s per projection, and 130 kV). SPECT data were reconstructed using a 3D ordered-subset expectation maximization algorithm (5 iterations and 8 subsets) on syngo MI Workplace (Siemens Healthcare) with CT-based attenuation correction and scatter compensation based on scatter projection estimates and nonuniform collimator response compensation to recover isotropic resolution. The voxel size was 4.8 × 4.8 × 4.8 mm. CT data were reconstructed with a soft-tissue filter and a voxel size of 0.976 × 0.976 × 5 mm.
The assessment of the microspheres activity to administer was based on the standard scheme proposed by the vendor (14). The activity to administer was calculated using Equation 2, with an initial objective of delivering a dose of 120 ± 20 Gy to the targeted liver mass, defined by the radiologist on CT data, while not exceeding a cumulative dose of 30 Gy to the lungs. Depending on the tumor volume, this targeted liver mass corresponds to a liver lobe, segment, or subsegment.
The value of 49.67 Gy/GBq corresponds to the absorbed dose coefficient of 90Y for a mass of 1 kg of soft tissue.
The percentage of F was estimated on planar imaging. Regions of interest, corresponding to the lungs and liver, were delineated on anterior and posterior views. The geometric mean of the number of counts on conjugate views was calculated for the liver and lungs. Then, F was calculated according to the following relationship:
The corresponding dose to lungs was calculated using Equation 4, assuming a total mass of 1 kg for both lungs, as proposed by the study by Lau et al. (24).
The therapeutic injection was performed under angiography, in the same condition as the pretherapeutic procedure. The details of the treatment planning are summarized in Table 1.
Patient Data
Dosimetry Assessment Using Partition Model
For the purposes of this study, the partition model (12) was used retrospectively to estimate Dmean to the TL and NTL, for which TL plus NTL corresponds to the total liver volume. The TL volume was determined for the reconstructed SPECT data by applying a manual threshold using volumetric analysis software on MI Workplace. The level of threshold was set up by taking into account anatomic a priori—that is, liver boundaries and tumor description from previous CT angiography scans (Table 2). The NTL volume was deduced from TL and the total liver volume. Twelve tumoral compartments, or tumoral sites, were then identified, corresponding to 2 sites for patients 5 and 6 and to 1 site for the other patients.
Comparison of Dmean to TL Calculated by Partition Model Approach and VoxelDose
The absorbed dose in TL and NTL (DTL/NTL) was calculated according to the amount of activity (ATL/NTL_0) in the corresponding compartment (TL or NTL) at t = 0 (Eqs. 5 and 6).
3D Dosimetry Assessment
The following data were collected for the 10 patients: F, the administered activity, and the 99mTc-MAA SPECT/CT data. Additional structures were segmented to complete patient data, allowing 3D dosimetry analysis. The CT data were registered to the reconstructed SPECT data with MI Workplace, to match CT and SPECT slices without degrading in-plane CT resolution, leading to a voxel size of 0.976 × 0.976 × 4.8 mm. The transformation matrix was calculated from SPECT and CT field-of-view matching. Then, the liver was manually segmented on the registered CT data with the OsiriX software tool (open source).
The TIA map for 90Y-microspheres was derived from the 99mTc-MAA SPECT/CT dataset, assuming similar distributions within the liver for 90Y-microspheres and 99mTc-MAA SPECT/CT. The F has been considered to determine absolute activity distribution within voxels of the liver. Then, the activity at the time of injection and the time-integrated activity for each voxel belonging to the liver were calculated. Because glass microspheres remain permanent in the liver, we considered only the physical decay of 90Y (64.05 h) for the time-integrated activity calculation.
The 3D dose maps and the descriptive statistics—Dmean, Dmed, Dmax, and Dmin (in Gy)—in the TL and NTL were calculated. Dmean calculated with VoxelDose was compared with Dmean calculated with the standard partition model. The percentage of relative difference between partition model and VSV approaches were calculated. DVHs were computed for TL and NTL, and the following characteristic values were extracted from DVHs in NTL: V80 Gy, corresponding to the fraction of NTL receiving at least 80 Gy, and D25%, the absorbed dose for which 25% of NTL was the least irradiated.
RESULTS
Examples of 3D dose map and isodose curves are given in Figure 2 for patient 1. The Dmean calculated with VoxelDose was 422 ± 263 Gy (n = 12) for TL and 50.1 ± 36.0 Gy (n = 10) for NTL. Detailed results derived from descriptive statistics are given in Tables 2 (TL) and 3 (NTL). Dmean calculated with VoxelDose in TL and NTL are in agreement with those calculated by partition model. The relative difference is less than 1.5% for TL and slightly higher for NTL (4.4%).

3D dosimetry results for patient 1. (A) Transverse slice of 3D dose map fused with CT. (B) Isodose curves superimposed on transverse slice of CT. Blue curve = isodose 1% of maximum dose; green curve = isodose 5% of maximum dose; yellow curve = isodose 10% of maximum dose; orange curve = isodose 30% of maximum dose; red curve = isodose 50% of maximum dose.
Results from Tables 2 and 3 show a wide spread of voxel-dose values around Dmean. A more detailed distribution of absorbed dose is given in DVHs (Fig. 3 for TL and Fig. 4 for NTL). The DVHs of TL exhibit a plateau at the origin more or less extended from one patient to another. The end of the plateau corresponds to the Dmin to TL given in Table 2. Thus, for the 10 patients, the Dmin within tumor voxels ranges from 32 Gy (patient 1) to 267 Gy (patient 7). On the other hand, the DVHs of NTL show that a high fraction of NTL was spared from high radiation doses (vertical part of the DVHs along the y-axes). For instance, patients 6 and 3 had at least 50% of the normal liver that received less than 2 Gy. Table 4 gives the V80 Gy and D25% for each patient.
Comparison of Dmean to NTL Calculated by Partition Model Approach and VoxelDose
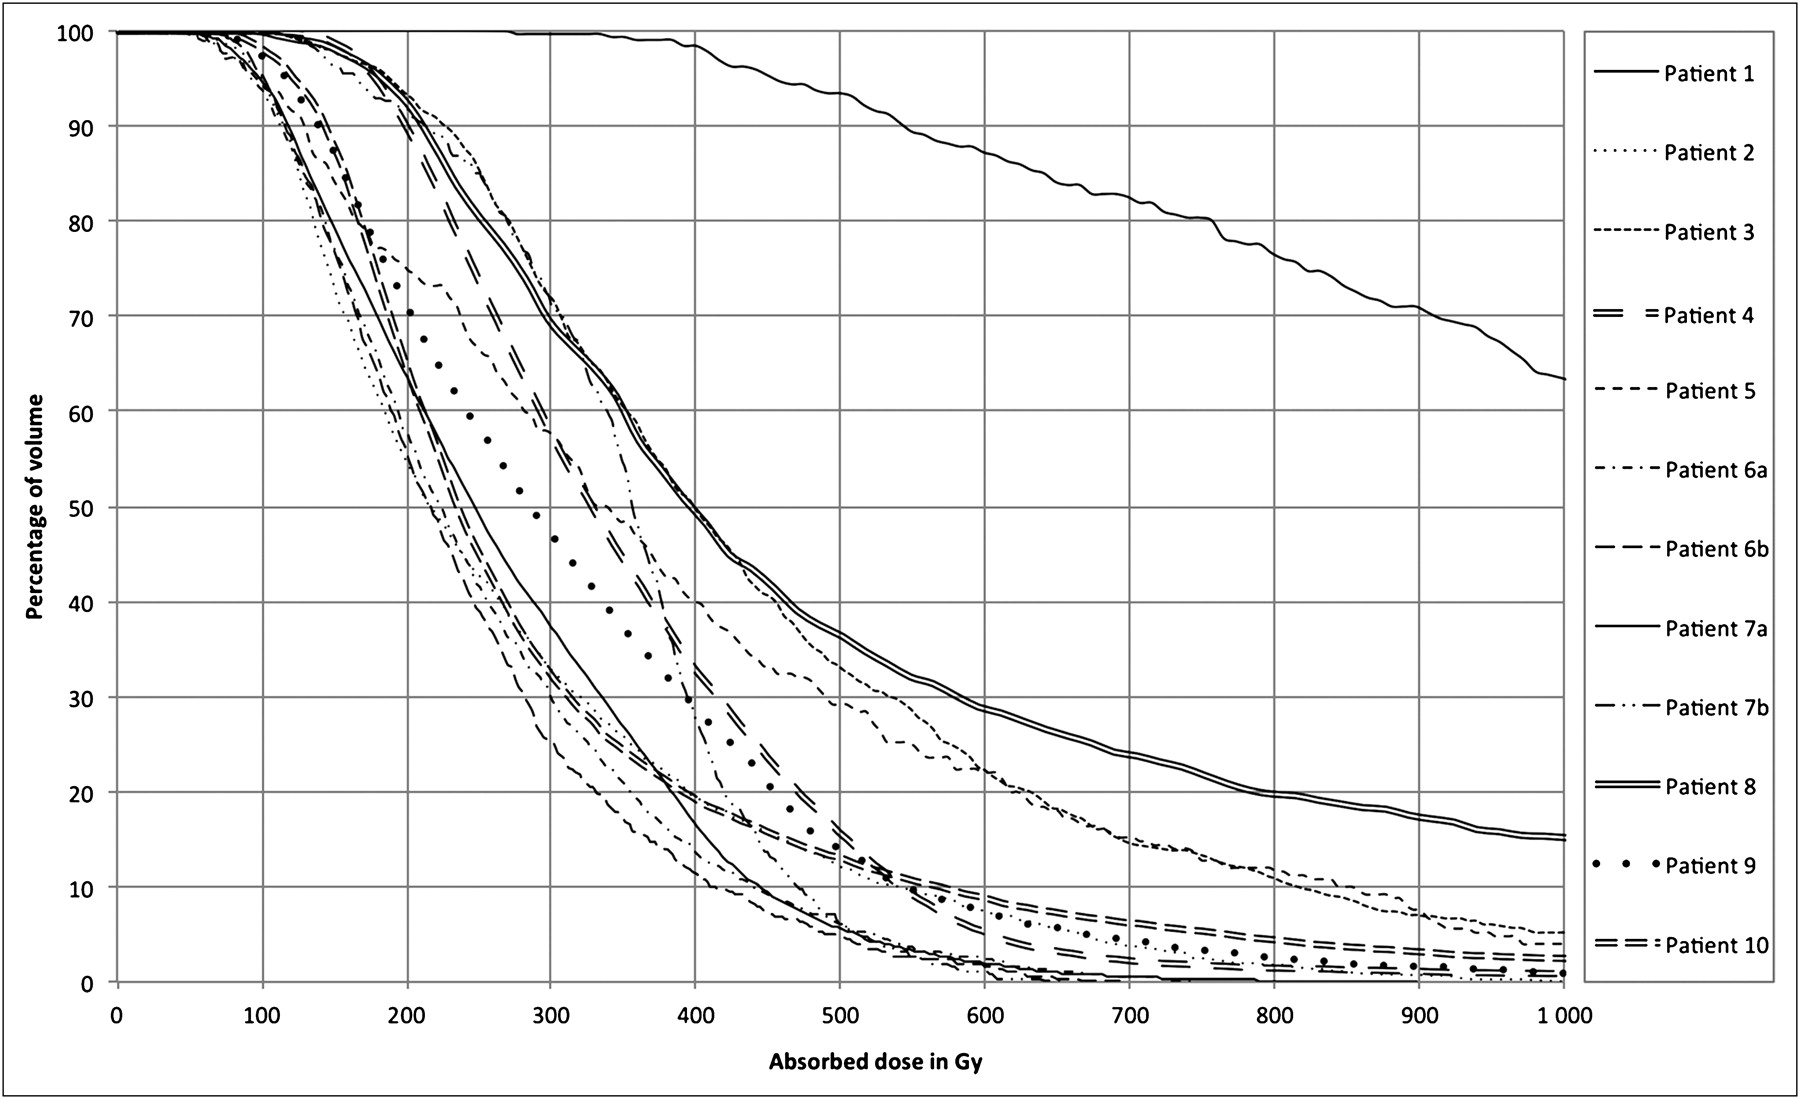
DVH in TL for each patient. Patients 6 and 7 had 2 tumor sites.
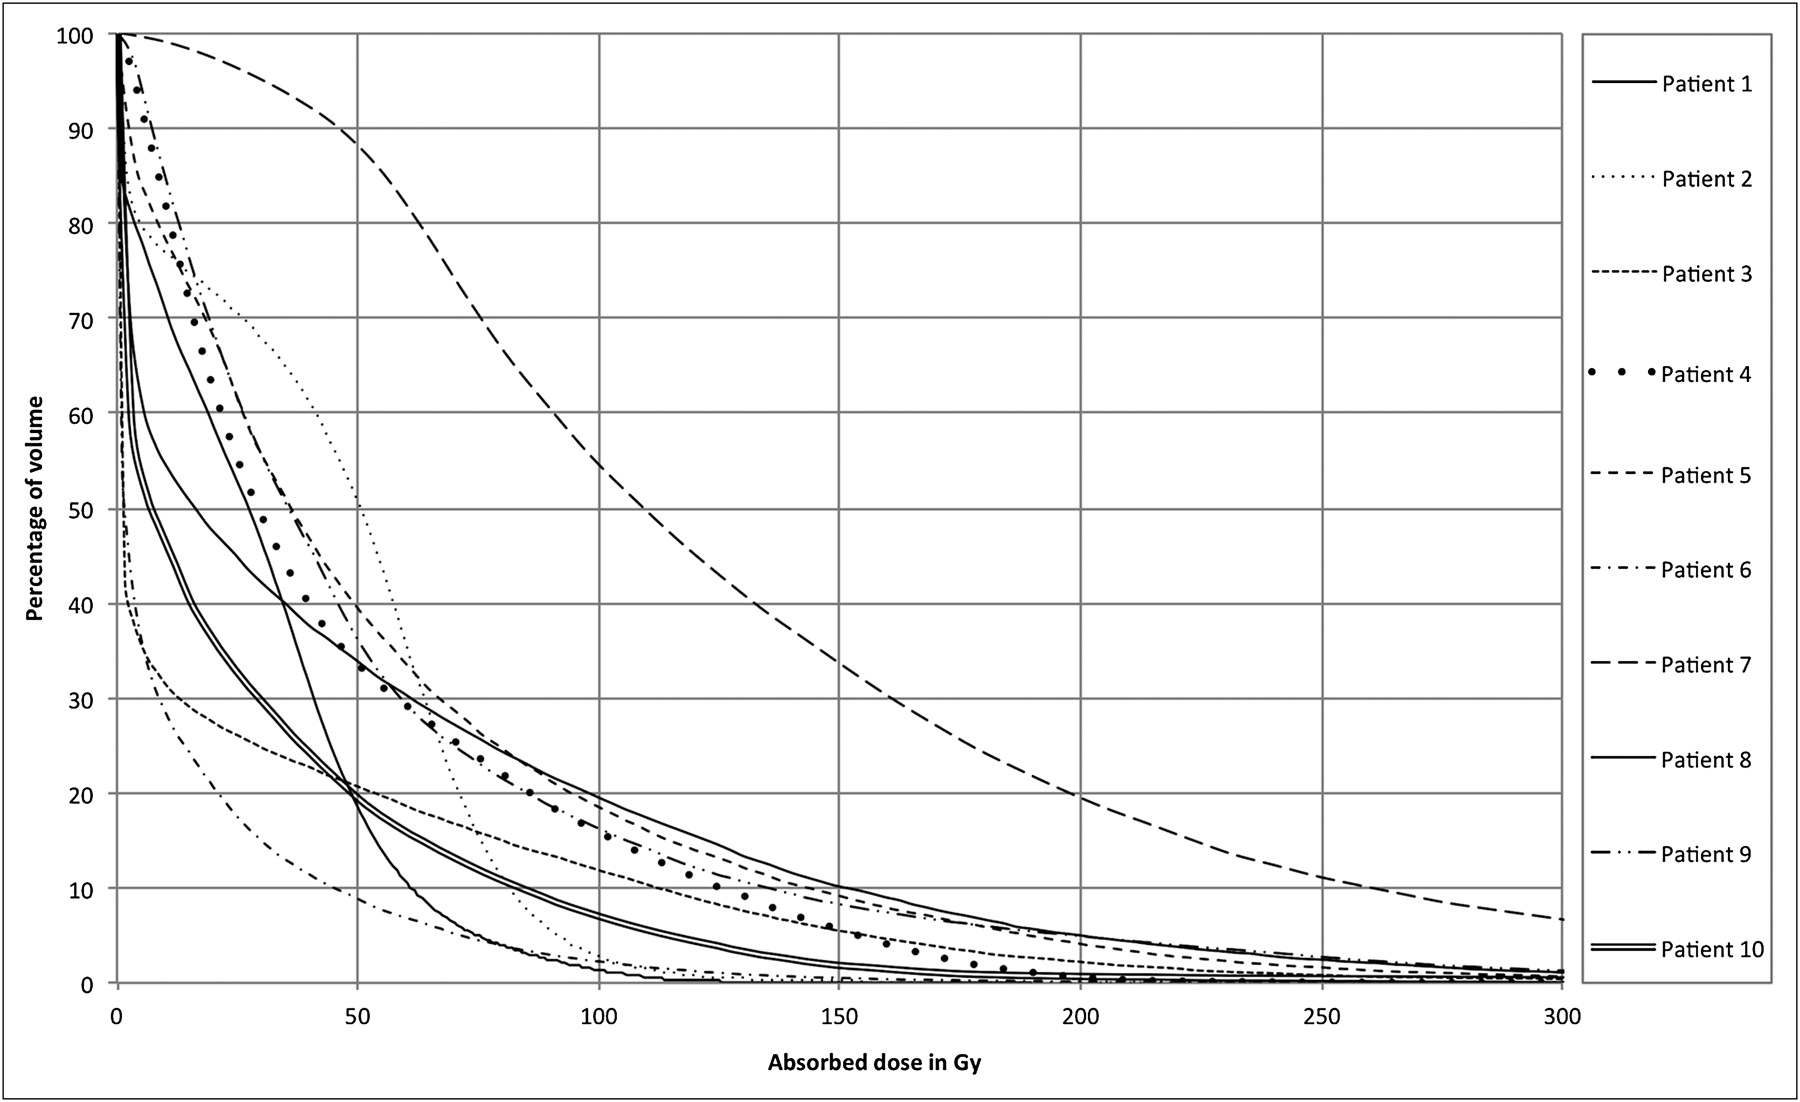
DVH in NTL for each patient.
Patient V80 Gy and D25% in NTL
As shown in a previous study (19), the dose calculation itself takes 10 s at maximum, from VSV resampling to convolution. The estimated processing time for a complete 3D dosimetry calculation is 15 min, including SPECT quantitation, SPECT/CT registration, and TL definition from SPECT thresholding. Additional manual delineation of the liver increased the whole processing time to 1 h. This delineation is a prerequisite to assessing descriptive statistics and DVH for NTL.
DISCUSSION
The aim of this work was to propose a fast 3D dosimetry methodology for 90Y-SIRT allowing the assessment of the Dmean to the targeted liver and the nontargeted liver, dose distribution heterogeneities, DVH, and, thus, the prescribed dose and activity that can be administered. The dose calculation itself is fast (<10 s). To obtain this speed, VSVs were previously calculated at a fine voxel size for several radionuclides and media (i.e., soft tissues, lung) using Monte Carlo simulations (19). To adapt these fine-resolution VSV sets to the γ-camera voxel dimension, a resampling algorithm was developed to create a VSV map at the desired voxel size. Another advantage is that the computation time is not related to the heterogeneity of the activity distribution within the sources, as is the case with Monte Carlo approaches. The estimated processing time for a complete 3D dosimetry calculation is 15 min, including SPECT quantitation, SPECT/CT registration, and TL definition from SPECT thresholding. At the end of the process, the 3D dose map can be visualized, and isodose curves can be drawn. If one wants to assess descriptive statistics and DVH on NTL, additional liver delineation must be performed, with an additional time of 45 min with voxels of 0.976 × 0.976 × 4.8 mm. To increase the speed and improve the reproducibility of processing it would be interesting to develop an automatic delineation algorithm of the liver on CT data. A 3D dosimetry approach based on dose kernel convolution (25) has been previously proposed in the literature for 90Y-microspheres and was evaluated on the data of 1 patient. Our approach has been developed to be used for any voxel dimension and validated with comparison to direct Monte Carlo simulations (19). This study demonstrates the feasibility of its application in clinical routine. The main drawback of our approach is that it does not take into account tissue heterogeneities. In the case of 90Y, which is a pure β-emitter with a limited penetration in soft tissue (mean, 2.5 mm; maximum, 11 mm), the impact of tissue heterogeneities on dose computation would remain negligible when working inside the liver. Dose perturbations at the liver boundaries cannot be simulated by our approach. However, considering previous work by Buffa and Verhaegen on interface dosimetry (26), this shortcoming would have a limited influence on the DVH analysis.
Because of the limited tissue penetration of 90Y, Gulec et al. (27) have performed a hepatic structural dosimetry using a Monte Carlo modeling approach based on lobular microanatomy. These results are in agreement with a previous 3D in vitro dosimetry study using hepatic arterial infusion of 90Y-microspheres for a VX2 tumor model in New Zealand White rabbits (24). The nonuniformity of dose deposition in TL and NTL was shown on liver tissue samples (200 μm thick). This cellular dosimetry gave some interesting complementary information on dose distribution heterogeneity at a microanatomy level.
Our approach is based on dosimetry computation at the voxel level. Although this highlights a wide range of dose heterogeneity, one can argue that the lack of reliable activity measurement at the voxel level mainly is due to the limited spatial resolution of γ-camera, leading to a high partial-volume effect for structures below 2–3 times the full width at half maximum of the impulse response. Even if we keep in mind that 3D dosimetry from SPECT or PET quantitation suffers from potential partial-volume effect and cannot reveal heterogeneities at a submillimeter level, 3D dosimetry is a promising modality for a better control of differential effect and the establishment of a dose–effect relationship.
The use of 99mTc-MAA SPECT/CT data for 90Y-microsphere treatment planning is conditioned by the similarity between 99mTc-MAA and 90Y-microsphere liver perfusion. Indeed, both injections should be done under the same conditions—that is, catheter placement and injection technique. Posttherapeutic 90Y-bremsstrahlung SPECT/CT or 90Y-PET/CT (28) could be used as a validation for pretherapeutic dosimetry with an objective measurement of the similarity (29).
The clinical feasibility of our 3D approach was tested retrospectively on the data of 10 patients treated by SIRT with 90Y-microspheres for HCC. Dmean calculated with VoxelDose in TL and NTL are in good agreement with those calculated by the partition model (Tables 2 and 3). The Dmean calculated by VoxelDose is slightly higher than that calculated by the partition model. This result may be partly explained by the fact that in the partition model, an absorbed dose coefficient of 49.67 Gy/GBq for 1 kg of tissue for 90Y is taken, assuming an absorbed fraction of 1 for every compartment. This constant value does not take into account the cross-dose contribution as a first approximation due to the limited penetration of 90Y emissions.
The results from Tables 2 and 3 show a significant dispersion of voxel-dose values around the Dmean in TL and NTL. DVHs (Figs. 3 and 4), as well as Table 4, give a more detailed view of this dispersion. The shape of DVHs is in agreement with those found by Sarfaraz et al. (25) for 1 patient. These DVHs could have a potential value in dose prescription as in EBRT. For the TL, one of the main interesting parameters is likely Dmin (Table 2) to ensure that the entire TL receives at least a fixed minimal dose, Dmin playing the role of DEBRT, the prescribed dose in EBRT. For the NTL, a constraint based on a Dmean is probably not the most appropriate planning treatment strategy (25) because of the difference of dose distribution among patients. For instance, patients 1 and 6 received at least 80 Gy to the same fraction of NTL volume (Table 4, V80 Gy = 4%), whereas 75% of the NTL received less than 43 Gy (patient 1) and 14 Gy (patient 6) corresponding to D25%. A strategy based on preserving a fraction VDmin (volume irradiated by a minimum dose Dmin) of NTL should be more appropriate to take into account the residual hepatic functional reserve than Dmean. For instance, in EBRT, Lee et al. (30) have proposed dose prescription guidelines based on the fraction V50% (volume irradiated by 50% of the isocenter dose) of normal liver treated. The fraction V50% is divided into the following 4 intervals: if V50% is less than 25%, then DEBRT equals 59.4 Gy; if V50% is between 25% and 49%, then DEBRT is between 45 and 54 Gy; if V50% is between 50% and 75%, then DEBRT is between 30.6 and 41.4 Gy; and if V50% is greater than 75%, no treatment is administered. Even if there is not yet a consensus regarding which level radiation dose can be safely delivered to normal and pathologic liver, either in EBRT (31) or in SIRT, the use of a 3D planning treatment strategy should have a potential value in SIRT.
CONCLUSION
To improve the treatment efficiency of SIRT by 90Y-microspheres, a fast 3D dosimetry methodology was developed allowing the definition of the amount of activity to administer. The clinical feasibility of our 3D approach was tested retrospectively on the data for 10 patients treated by SIRT with 90Y-microspheres for HCC, leading to a highlighting of the potential value of a 3D planning treatment strategy in SIRT.
DISCLOSURE STATEMENT
The costs of publication of this article were defrayed in part by the payment of page charges. Therefore, and solely to indicate this fact, this article is hereby marked “advertisement” in accordance with 18 USC section 1734.
Acknowledgments
No potential conflict of interest relevant to this article was reported.
Footnotes
Published online Nov. 8, 2011.
- © 2011 by Society of Nuclear Medicine
REFERENCES
- Received for publication July 1, 2011.
- Accepted for publication August 1, 2011.


Jump to section
Related Articles
Cited By...
- Retrospective Voxel-Based Dosimetry for Assessing the Ability of the Body-Surface-Area Model to Predict Delivered Dose and Radioembolization Outcome
- Partition Model-Based 99mTc-MAA SPECT/CT Predictive Dosimetry Compared with 90Y TOF PET/CT Posttreatment Dosimetry in Radioembolization of Hepatocellular Carcinoma: A Quantitative Agreement Comparison
- Three-Dimensional Personalized Monte Carlo Dosimetry in 90Y Resin Microspheres Therapy of Hepatic Metastases: Nontumoral Liver and Lungs Radiation Protection Considerations and Treatment Planning Optimization
- A Clinical Dosimetric Perspective Uncovers New Evidence and Offers New Insight in Favor of 99mTc-Macroaggregated Albumin for Predictive Dosimetry in 90Y Resin Microsphere Radioembolization
- Study of the Impact of Tissue Density Heterogeneities on 3-Dimensional Abdominal Dosimetry: Comparison Between Dose Kernel Convolution and Direct Monte Carlo Methods
- Radiodosimetric Estimates for Radioembolic Therapy of Liver Tumors: Challenges and Opportunities