


Abstract
90Y-microsphere selective internal radiation therapy (SIRT) is a valuable treatment in unresectable hepatocellular carcinoma (HCC). Partition-model predictive dosimetry relies on differential tumor-to-nontumor perfusion evaluated on pretreatment 99mTc-macroaggregated albumin (MAA) SPECT/CT. The aim of this study was to evaluate agreement between the predictive dosimetry of 99mTc-MAA SPECT/CT and posttreatment dosimetry based on 90Y time-of-flight (TOF) PET/CT. Methods: We compared the 99mTc-MAA SPECT/CT results for 27 treatment sessions (25 HCC patients, 41 tumors) with 90Y SIRT (7 glass spheres, 20 resin spheres) and the posttreatment 90Y TOF PET/CT results. Three-dimensional voxelized dose maps were computed from the 99mTc-MAA SPECT/CT and 90Y TOF PET/CT data. Mean absorbed dose ( ) was evaluated to compute the predicted-to-actual dose ratio (
 ) in tumor volumes (TVs) and nontumor volumes (NTVs) for glass and resin spheres. The Lin concordance (
 ) was used to measure accuracy (
 ) and precision (ρ). Results: Administered activity ranged from 0.8 to 1.9 GBq for glass spheres and from 0.6 to 3.4 GBq for resin spheres, and the respective TVs ranged from 2 to 125 mL and from 6 to 1,828 mL. The mean dose
  was 240 Gy for glass and 122 Gy for resin in TVs and 72 Gy for glass and 47 Gy for resin in NTVs.
  was 1.46 ± 0.58 (0.65–2.53) for glass and 1.16 ± 0.41 (0.54–2.54) for resin, and the respective values for
  were 0.88 ± 0.15 (0.56–1.00) and 0.86 ± 0.2 (0.58–1.35). DR variability was substantially lower in NTVs than in TVs. The Lin concordance between
  and
and  (resin) was significantly better for tumors larger than 150 mL than for tumors 150 mL or smaller (
 = 0.93 and
  = 0.95 vs.
  = 0.57 and
  = 0.93; P < 0.05). Conclusion: In 90Y radioembolization of HCC, predictive dosimetry based on 99mTc-MAA SPECT/CT provided good estimates of absorbed doses calculated from posttreatment 90Y TOF PET/CT for tumor and nontumor tissues. The low variability of
  demonstrates that pretreatment dosimetry is particularly suitable for minimizing radiation-induced hepatotoxicity.
- selective internal radiation therapy (SIRT)
- 90Y radioembolization
- predictive dosimetry
- hepatocellular carcinoma (HCC)
In selective internal radiation therapy (SIRT), 90Y-microsphere radioembolization is a valuable therapeutic option in patients presenting with unresectable hepatocellular carcinoma (HCC) not eligible for other therapeutic options (1–3).
SIRT with 90Y-charged microspheres relies on differential vascularization between tumor and nontumor liver parenchyma, resulting in favorable, potentially tumoricidal, deposition of microsphere activity in tumors while minimizing absorbed dose to the functional parenchyma, thus preventing toxicity. Two microsphere types are clinically available: resin spheres (SIR spheres; SirTex Medical Ltd.) and glass spheres (TheraSphere; Nordion Inc.). Despite being of similar size (∼30 μm), these two types of sphere differ in specific activity, density ( glass spheres/GBq;
  resin spheres/GBq), and injection solution (NaCl for glass spheres; water for resin spheres), leading to potential differences in embolic effect and local variations in the radiation dose deposited in tissues.
Predictive dosimetry has included hepatic CT angiography for catheter positioning and partition modeling based on 99mTc-macroaggregate albumin (MAA) SPECT/CT acquisition (4,5).
The manufacturer-recommended activity for resin spheres is based on a semiempiric formula including body surface area (6,7) and tumor burden. This approach can be refined using a 3-compartment partition model (4) including the lungs, liver TVs, and liver NTVs derived from a pretreatment 99mTc-MAA SPECT/CT scan. The prescribed glass sphere activity is based on a 2-compartment model (lungs and targeted liver regions) aiming to deliver a dose of 80–150 Gy to the targeted liver volume.
90Y time-of-flight (TOF) PET/CT dosimetry (8) provides a valuable tool to verify 99mTc-MAA SPECT/CT–based predictive dosimetry.
Accurate TV and NTV predictive dosimetry is essential for patient safety, good tumor control with low hepatic toxicity, and evaluation of the dose response. The predictive value of 99mTc-MAA SPECT/CT–based dosimetry is debated (9,10). In hepatic metastases from colorectal cancer, Flamen et al. (11) observed that metabolic response using total tumor glycolysis correlated well with 99mTc-MAA–predicted dose. In contrast, Wondergem et al. (12) reported poor agreement between 99mTc-MAA SPECT/CT–evaluated activity distribution and posttreatment bremsstrahlung SPECT/CT findings; these results were debated by Kao (13). In HCC patients treated with glass spheres, Garin et al. (14) reported that 99mTc-MAA SPECT/CT accurately predicted tumor response and survival. Kao et al. (15) reported a good dose–response correlation and reliable predictive dosimetry for 99mTc-MAA SPECT/CT compared with posttreatment 90Y TOF PET in HCC patients treated with resin spheres. Postradioembolization 90Y TOF PET/CT can also provide valuable information in cases of extrahepatic shunt (16), helping the physician take appropriate corrective actions and improving posttherapy patient management.
We aimed to evaluate agreement between 99mTc-MAA SPECT/CT–based predictive dosimetry and posttreatment 90Y TOF PET/CT–based dosimetry for both TV and NTV in HCC patients treated with both resin and glass spheres. To our knowledge, this is the first report assessing and comparing both devices in patients treated at the same institution using the same clinical procedure.
MATERIALS AND METHODS
All procedures were performed in accordance with the ethical standards of the institutional and national research committee and with the Declaration of Helsinki. Informed consent was obtained from individual participants before study inclusion.
Cohort Description
We retrospectively compared 27 treatment sessions on 25 HCC patients (Table 1) who underwent 90Y SIRT between May 2012 and November 2013. Sequential SIRT whole-liver sessions (n = 1) and lobar-plus-segmentectomy sessions (n = 1) at 2- and 7-mo intervals were considered as distinct procedures. In total, there were 20 lobar (17 right and 3 left), 2 whole-liver, 2 lobar-with-segment-boost, 2 segment, and 1 partial-lobe treatments. In total, 41 tumors (TV) were identified and analyzed.
Patient Age, Administered Activity, TVs, and NTVs for Glass and Resin Spheres
According to the Barcelona Clinic liver cancer classification, 3 patients had stage A disease, 14 had stage B, and 8 had stage C. Only one patient had a normal liver; all others had cirrhotic liver disease (16 Child–Pugh A, 6 B, and 2 C). Lobar or sectorial portal vein thrombosis was present in 7 patients. Among the 25 patients, 11 were treatment-naive and 14 had already undergone various procedures before radioembolization (5 hepatectomy or segmentectomy, 8 chemoembolization, and 6 radiofrequency ablation or thermoablation). Seven treatments (11 tumors) were performed with glass spheres and 20 (30 tumors) with resin spheres; details are summarized in Table 1.
Patients with small TVs (≤150 mL) were preferentially treated with 90Y-glass spheres because of their higher specific activity and lower particle number, aiming at avoiding tumor saturation and consequent reflux to nontarget volumes. All tumors treated with glass spheres were 150 mL or smaller, whereas tumors selected for resin spheres had a wider range of volume (6–1,828 mL).
Activity Determination
Resin sphere dosimetry is based on a 3-compartment partition model aiming at keeping the dose to the NTV below 70 Gy and 50 Gy for lobar and total liver treatment, respectively, as recommended by Lau et al. (7).
Determination of glass sphere activity is based on a 2-compartment model (lungs plus targeted liver region) aiming at delivering a dose of between 80 and 150 Gy to the targeted liver volume. In analogy with the resin sphere dosimetry, we refined the activity determination by applying as a second step a partition model accounting for TV and NTV and differential particle distribution (tumor-to-nontumor ratio) estimated from 99mTc-MAA SPECT/CT to predict TV and NTV dose. In lobar radioembolization, we keep the average predicted NTV dose to below 70 Gy provided this allows a predicted tumor dose of more than 205 Gy (14).
Pretherapy 99mTc-MAA SPECT/CT
Hepatic angiography was performed, and after occluding single or multiple accessory hepatic arteries (when present) with coils, 120–180 MBq of 99mTc-MAA in 5 mL of physiologic solution were slowly administrated via the catheter, the exact position of which was noted and registered on the angiogram to guide catheter repositioning for the treatment session.
The patient was immediately (<20 min) transferred to the nuclear medicine department for SPECT/CT, with whole-body and planar images being acquired within 1 h for evaluation of lung shunting. Abdominal SPECT/CT images (Discovery 670/Infinia Hawkeye IV; GE Healthcare) were acquired (120 × 20 s, low-energy high-resolution collimator) and reconstructed with a Xeleris 3.1 workstation (GE Healthcare) using 3-dimensional (3D) ordered-subset expectation maximization (4 iterations × 10 subsets) with a Butterworth filter (cutoff, 0.5 cycles/cm; order, 10) and CT-based attenuation correction. The TV, NTV, and tumor-to-nontumor ratio were assessed on the SPECT/CT images, with morphologic information obtained from any available imaging modality (enhanced CT, MR, or 18F-FDG PET/CT) when needed.
Posttherapeutic 90Y TOF PET
The required activity in gigabecquerels determined from 99mTc-MAA dosimetry was administered according to the manufacturer’s instructions. The injected activity was measured, as well as the postprocedural activity in the delivery system and catheters. The actual (i.e., gold standard) dose absorbed by tissue was quantified from posttreatment 90Y TOF PET/CT performed within 6 h after 90Y-sphere administration (Discovery 690; GE Healthcare) (17). The PET acquisition duration was 30 min per bed position, for 1 or 2 bed positions depending on the axial dimension of the liver. The list-mode acquisition integrating TOF data was reconstructed using 3D ordered-subset expectation maximization (VPFX [GE Healthcare], 2 iterations × 16 subsets) including a gaussian postreconstruction filter of 5 mm in full width at half maximum. All image corrections (normalization, dead time, activity decay, random coincidences, attenuation, and scatter) were applied.
Image Segmentation, Volume-of-Interest Definition, and Dosimetry
PMOD software (release 3.4; PMOD Technologies Ltd.) was used for coregistration of 90Y TOF PET and 99mTc-MAA SPECT images with CT or MR images and for manual or semiautomatic (threshold) delineation of TVs and NTVs by the nuclear medicine physician and technologist.
TVs, NTVs, and tumor-to-nontumor ratios estimated from the 99mTc-MAA SPECT images using partition model dosimetry were applied to determine the activity of 90Y-spheres to be administered (18). For each procedure, 3D voxelized 90Y dose maps were computed from the 99mTc-MAA SPECT/CT and 90Y TOF PET/CT acquisitions with assumption of local energy deposition (19), which considers the measured voxel activity to contribute to the absorbed dose in only the voxel itself. Permanent sphere implantation was also assumed. We performed a phantom study to determine the accuracy of total-activity recovery in 90Y PET acquisitions. For that purpose, a Kyoto liver phantom (1.8-L liver volume) was used. Even when our PET scanner was calibrated to measure 90Y emission quantitatively, we found 5%–10% deviations compared with the actual total activity in the phantom. Thus, we preferred to rescale the total PET signal to the activity administered to improve the accuracy of total-activity recovery.
The total therapeutic administered activity was partitioned proportionally to the relative voxel intensity to derive both predictive SPECT and posttreatment PET 3D activity maps in units of kBq/mL. The 3D voxelized dose map was then obtained by rescaling the activity map by a factor 49.67 Gy/(GBq/kg) (20,21). Dose–volume histograms for both TV and NTV were obtained. Average absorbed doses in tumors were corrected for partial-volume effects through multiplication by appropriate recovery coefficients according to tumor size, estimated by phantom measurements with both the 90Y TOF PET and the 99mTc-SPECT modalities (Supplemental Fig. 1; supplemental materials are available at http://jnm.snmjournals.org).
Data Analysis
Dose maps allowed us to define, for each volume of interest, the mean 90Y dose computed from 99mTc-MAA SPECT ( ) and from 90Y TOF PET (
 ) and a predicted-to-actual dose ratio:
 Eq. 1This ratio has a clear interpretation: for values of
  less than 1, predictive dosimetry underestimates mean absorbed dose, whereas for values of
  greater than 1, mean absorbed dose is overestimated.
The value derived from the dose–volume histogram representing the minimum absorbed dose delivered to 70% of the target volume (the 70th percentile dose [ ]) was evaluated from 99mTc-MAA SPECT (
 ) and from 90Y TOF PET (
 ); this estimator has recently been used to characterize dose response in SIRT (15). The values of
  and
and  were evaluated for TV and NTV. To assess agreement between
  and
and  distributions, we use the Lin concordance coefficient (22),
  :
: Eq. 2where ρ (
 ) is the Pearson correlation coefficient of the linear relationship between the data (precision) whereas
  (
( ) is a bias coefficient, which measures departure of the best-fit curve from the 45° line (accuracy).
RESULTS
We compared the predictive dosimetry from the 99mTc-MAA SPECT–derived dose map with the posttreatment dosimetry obtained from the 90Y TOF PET dose map for TVs and NTVs.
Tumor
The average, minimum, and maximum values of mean tumor doses  and
and  and tumor dose ratios
  and
and  are summarized according to the specific therapeutic approach (glass spheres [11 tumors] and resin spheres [30 tumors]) in Figure 1 and Table 2.
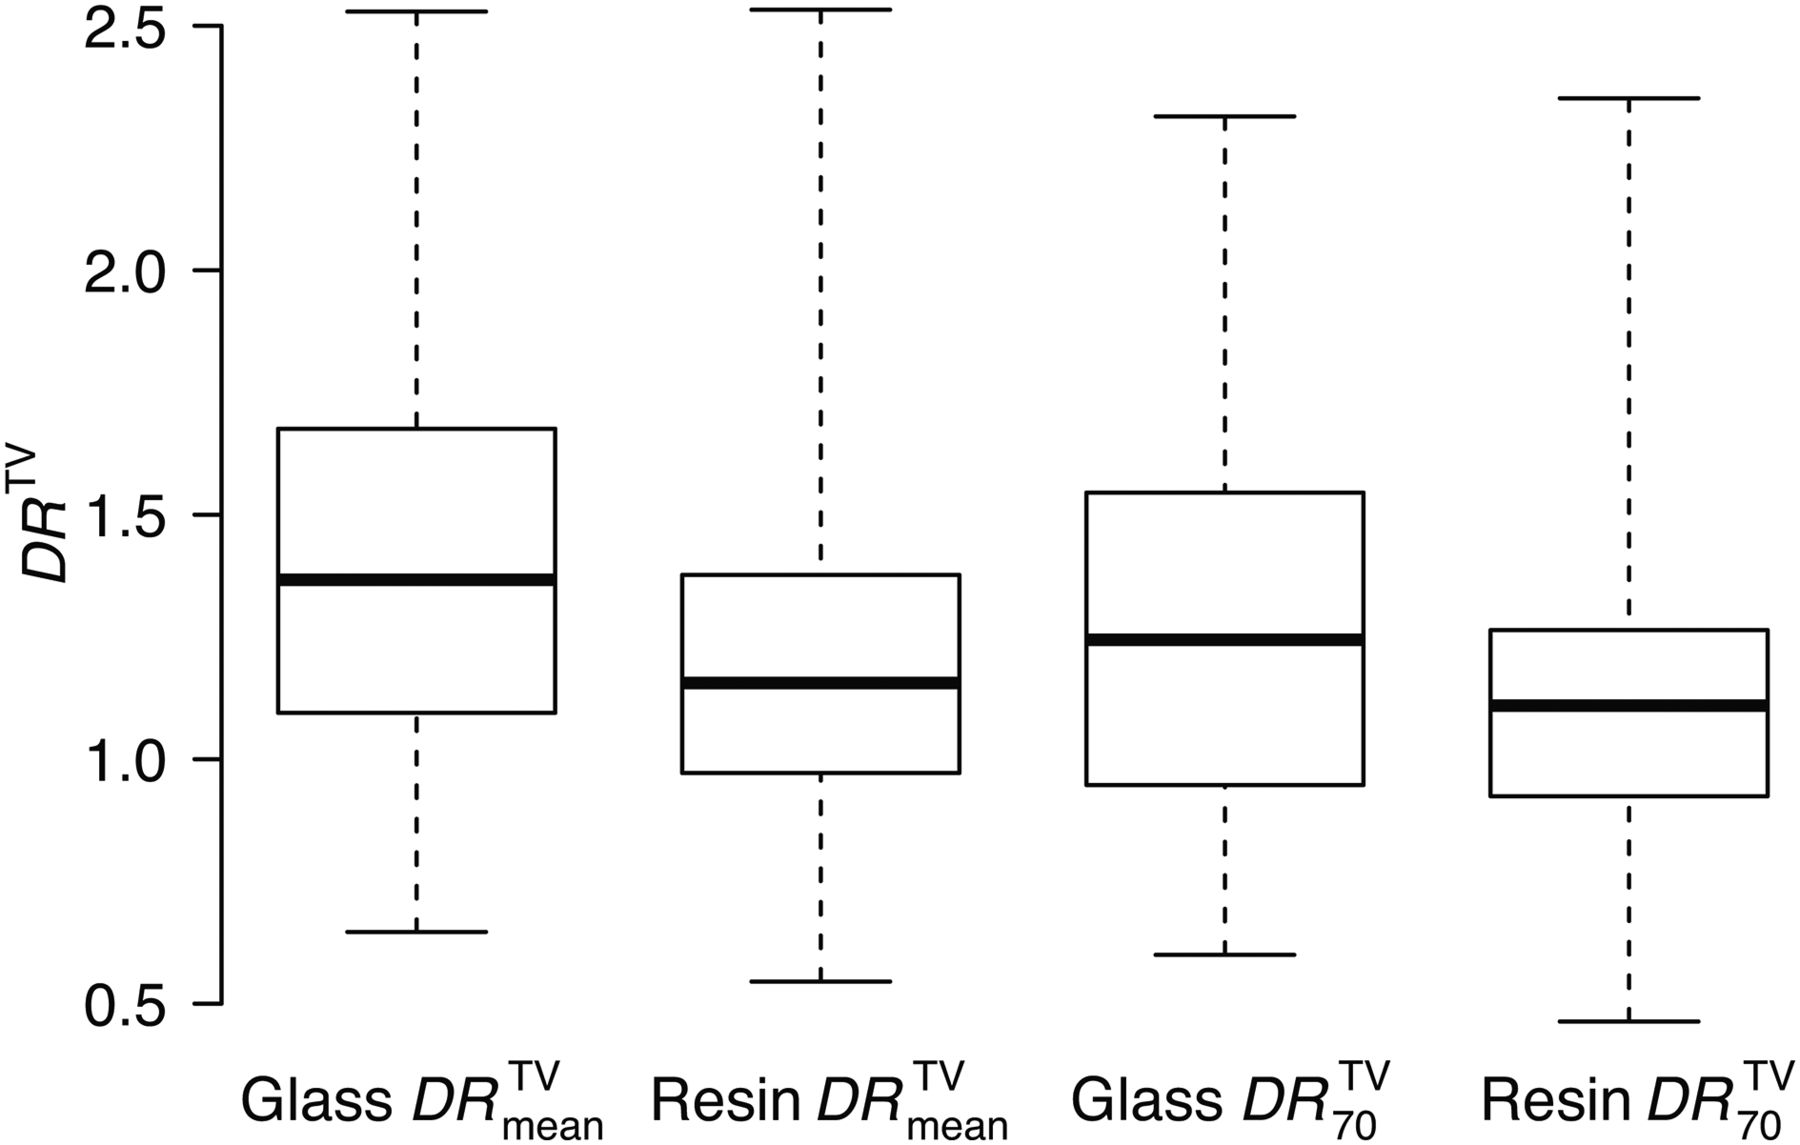
Box plot of 90Y predicted-to-actual dose ratios  and
and  in TVs for both resin and glass spheres, as defined in Equation 1.
Tumor Predicted Doses  , Absorbed Doses
  , and Their Ratio for Glass and Resin Spheres
 and
and  quantifications gave comparable results. Overall,
  values indicated a trend for the predictive dosimetry to overestimate the dose as obtained from posttreatment 90Y TOF PET–derived dose maps. In particular, our results showed a large variability of
  . In specific patients, for both glass and resin therapeutic approaches, we found
  values as low as 0.6 and as high as 2.5. This result quantitatively describes the extent of diametric uncertainty when using 99mTc-MAA SPECT/CT for tumor predictive dosimetry. The dosimetric uncertainty for tumor is less (i.e., better) for resin spheres than for glass spheres as evidenced by the
  distribution in Figure 1.
An example of liver treated with glass spheres and an example of liver treated with resin spheres are shown in Figure 2 and Supplemental Figure 2, respectively. Figure 2 shows glass sphere SIRT, with a TV of 1,350 mL and a 1.7-GBq administered activity. Two tumors are visible, one of which is representative of poor quantitative agreement (tumor 1,  = 2.53) and the other of good quantitative agreement (tumor 2,
  = 1.20) between predictive and posttreatment dosimetry. TVs, mean predicted doses, mean absorbed doses, and dose ratios are listed in Table 3. Poor and good quantitative agreement between predictive and posttreatment dosimetry are also evidenced in the dose–volume histograms (Figs. 2C and 2D).
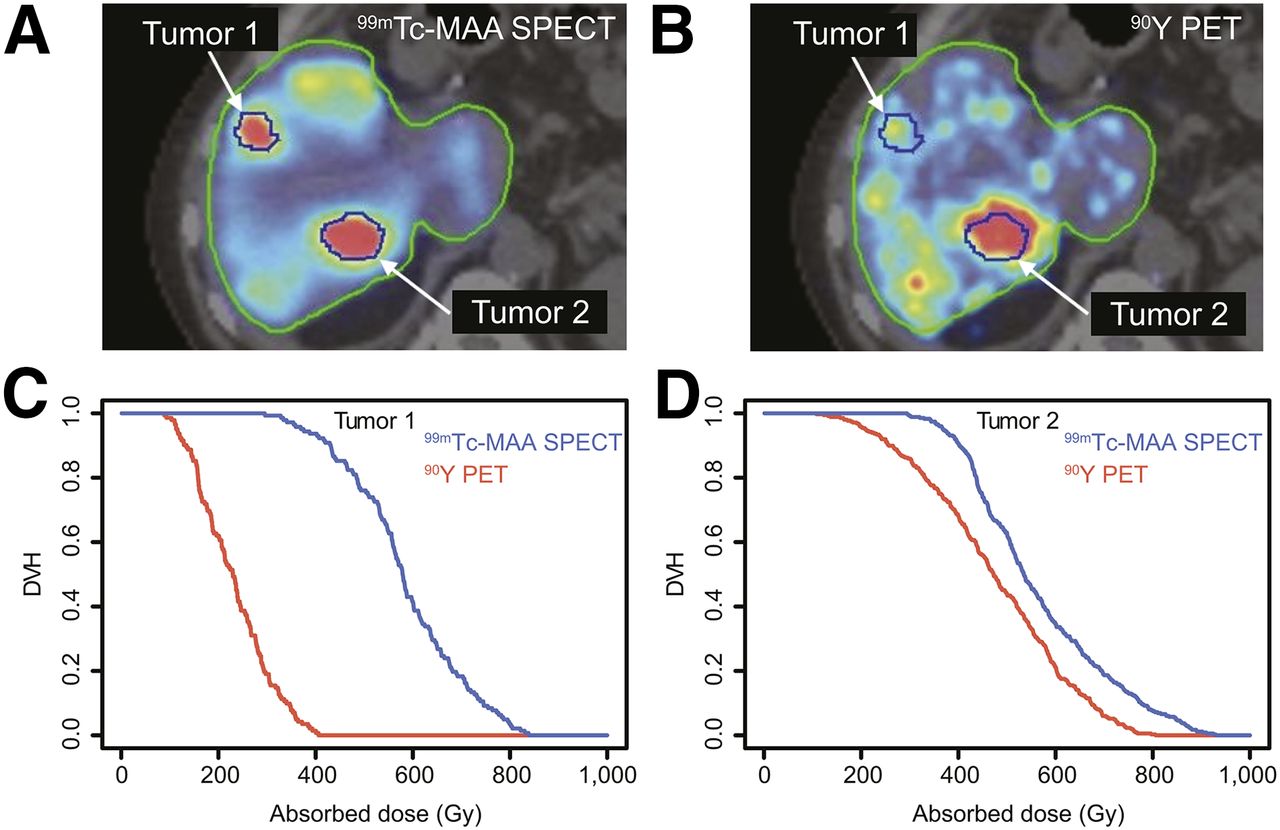
(A and B) 99mTc-MAA SPECT (A) and 90Y TOF PET (B) images of liver treated with glass spheres, with treated volume delimited by green lines and tumors by blue lines. (C and D) Dose–volume histograms (DVH) of tumors 1 (C) and 2 (D), with blue lines corresponding to 90Y dosimetry based on 99mTc-MAA SPECT spatial distribution and red lines to 90Y TOF PET (posttreatment dosimetry).
Volumes and Doses for TVs of Figure 2 and Supplemental Figure 2
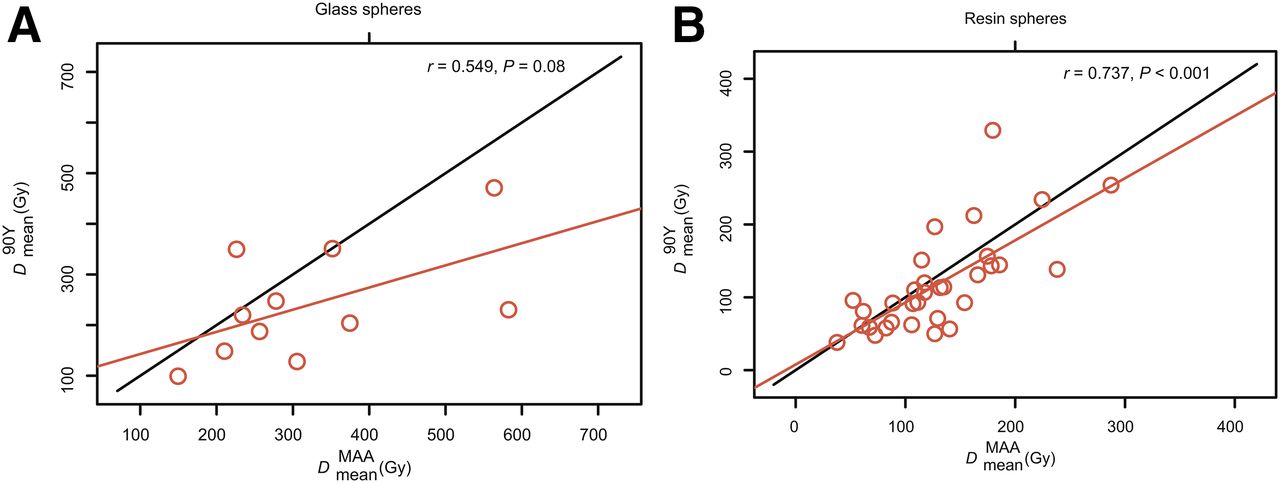
The comparison between predicted and posttreatment tumor doses,  , is presented in Figure 3, which reports the results for glass spheres and resin spheres separately. The Lin concordance for each specific case is summarized in Table 4. Overall, concordance was better for resin spheres than for glass spheres. Glass sphere concordance was higher for
  than for
  because of the higher accuracy (Cb) characterizing the
  quantification.

Comparison of mean tumor dose ( ) between predictive 90Y dosimetry based on 99mTc-MAA SPECT and posttreatment dosimetry based on 90Y TOF PET for glass (A) and resin (B) spheres. Diagonal red lines indicate linear regression fitted with least-squares method; diagonal black line indicates perfect concordance.
Lin Concordance Coefficients, in TV, Between Predictive Dosimetry Based on 99mTc-MAA SPECT and Posttreatment Dosimetry Based on 90Y TOF PET for Dmean and D70 for Both Types of Microsphere (Fig. 4)
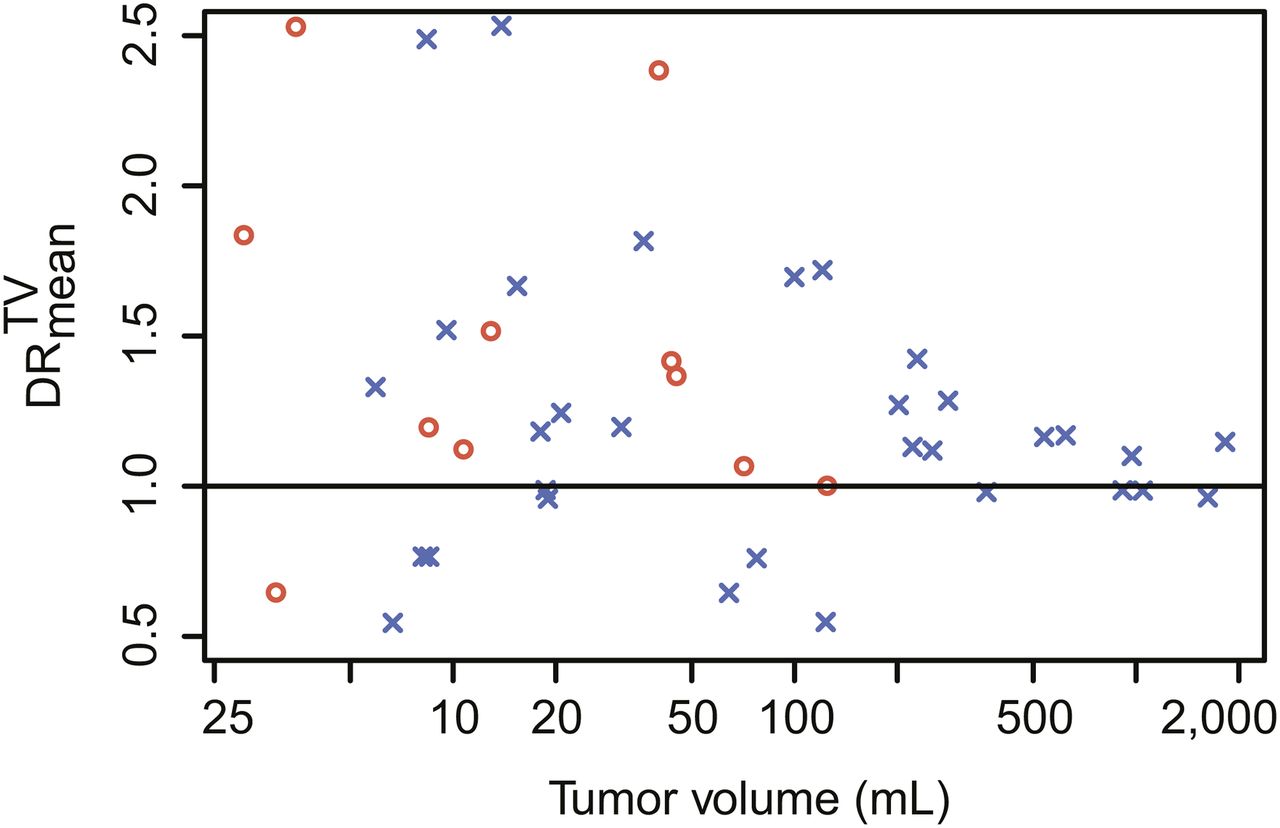
The tumor  distribution as a function of TV is shown in Figure 4. We separately analyzed the
  values obtained for resin spheres as a function of TV. As summarized in Figure 5, we found a larger
  variability in smaller tumors (≤150 mL, 16/30 TV) than in larger tumors (>150 mL, 14/30 TV). When we compared this last result with the
  distribution obtained for the glass sphere approach (as shown in Fig. 1), we found that the tumor
  variability for tumors 150 mL or smaller was similar regardless of the sphere type.

Predicted-to-actual dose ratio  as function of TV for glass spheres (red dots) and resin spheres (blue crosses).

Box plot of predicted-to-actual dose ratios  and
and  in TVs for resin spheres.
The comparison between predicted and posttreatment dosimetry in terms of  for the two cases—resin spheres 150 mL or smaller and resin spheres larger than 150 mL—is reported in Supplemental Figure 3. The Lin concordance for these two cases is presented in Table 5. Regardless of the quantification matrix (
 or
or  ), we found similar accuracy for both cases, whereas better precision was found for TVs larger than 150 mL, resulting in better concordance compared with TVs of 150 mL or less.
Lin Concordance Coefficients, in TV, Between Predictive Dosimetry Based on 99mTc-MAA SPECT and Posttreatment Dosimetry Based on 90Y TOF PET for Dmean and D70 for Resin Microspheres (Fig. 7)
NTVs
The comparison between predictive and posttreatment dosimetry in NTV was based on 27 treatments, with glass spheres (7/27 treatments) and resin spheres (20/27 treatments) being analyzed separately. In NTV, the average dose (glass or resin) from predictive and posttreatment dosimetry and the averaged dose ratios are summarized in Table 6. The  distribution is reported as a box plot in Figure 6. We observed reduced
  variability for lower TV/NTV ratios, as was the case for patients treated with glass spheres. The comparison of
  based on predictive 99mTc-MAA SPECT versus posttreatment 90Y TOF PET–derived dose maps is reported in Figure 7. The Lin concordance in NTV is presented in Table 7.
Nontumor Predicted Doses  , Absorbed Doses
  , and Their Ratio
  for Glass and Resin Spheres
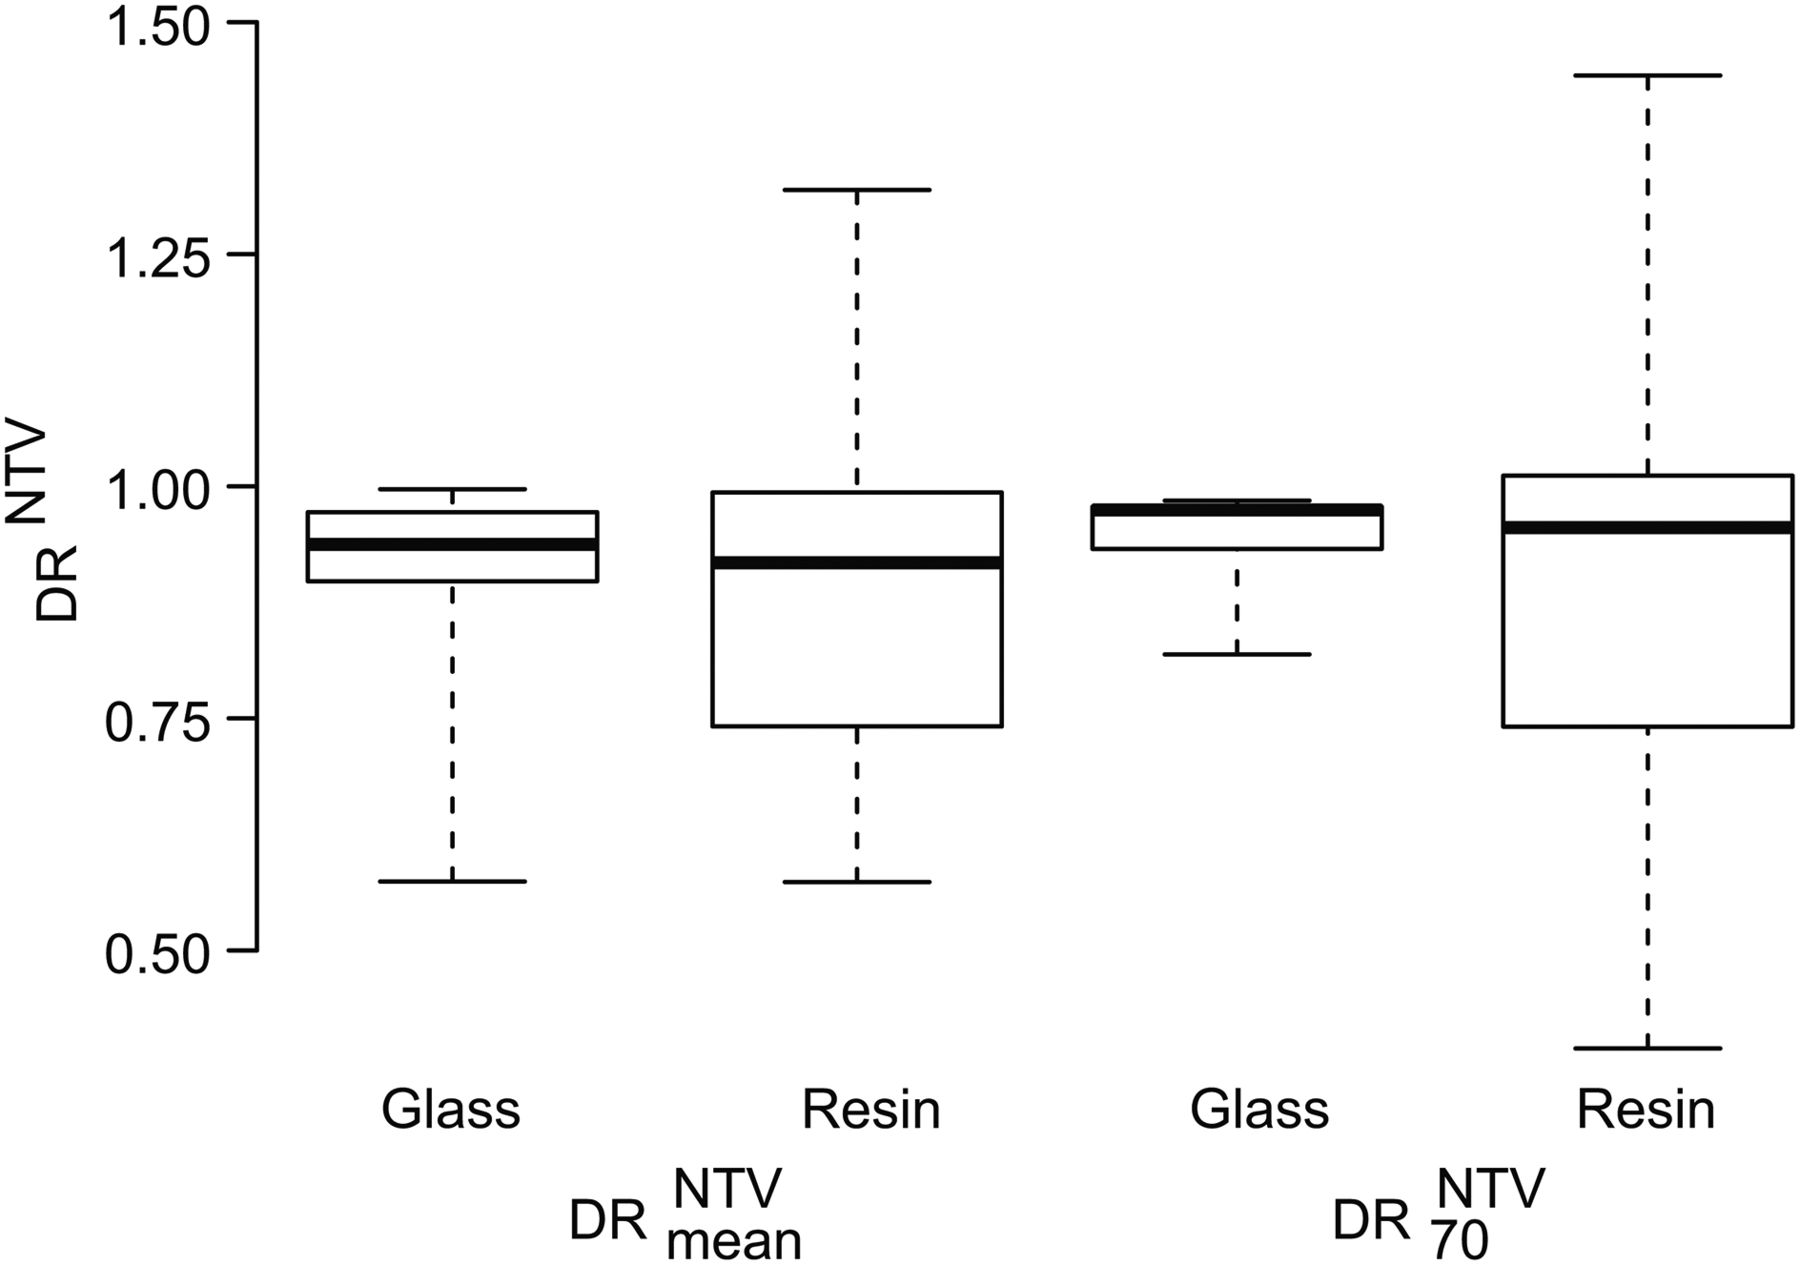
Box plot of predicted-to-actual dose ratios  and
and  in NTV for both resin sphere and glass sphere treatment sessions, as defined in Equation 1.

Comparison of nontumor mean dose  between predictive 90Y dosimetry based on 99mTc-MAA SPECT and posttreatment dosimetry based on 90Y TOF PET for glass (A) and resin (B) spheres. Diagonal red lines indicate linear regression fitted with least-squares method; diagonal black line indicates perfect concordance.
Lin Concordance Coefficients, in NTV, Between Predictive Dosimetry Based on 99mTc-MAA SPECT and Posttreatment Dosimetry Based on 90Y TOF PET for Dmean and D70 for Both Types of Microsphere (Fig. 7)
For both glass and resin spheres, concordance was very good: ρc,glass = 0.97 and ρc,resin = 0.86 for  ; ρc,glass = 0.99 and ρc,resin = 0.85 for
  .
.
Supplemental Figure 4 shows  as a function of the TV/NTV ratio. For large TV/NTV values, there was a tendency toward underestimation of predictive dose versus posttreatment dose.
DISCUSSION
Tumor Dosimetry and TVs
Predictive 90Y dosimetry of tumors based on 99mTc-MAA SPECT agreed well overall with posttherapy dosimetry based on 90Y TOF PET, with a tendency for predictive dosimetry to overestimate posttherapy dosimetry ( > 1) for both resin spheres and glass spheres. We observed a large
  variability, especially for small TVs (≤150 mL).
Our result agrees with similar observations made by Kao et al. (15) based on lower tumor statistics and valid only for resin spheres. In specific patients, we found tumors whose  were as low as 0.6 or as high as 2.5. Some possible causes of disagreement include different kinetics between 99mTc-MAA and spheres, modified tumor vascularization, and inability to perfectly reproduce the position of the catheter between 99mTc-MAA deposition and 90Y-sphere administration (12). Other sources of measured
  variability are differences between the PET and SPECT modalities (image resolution, noise level, contrast, and partial-volume effect). We tried to reduce variability in partial-volume effect by correcting estimated tumor activity using phantom-derived recovery coefficients. Nevertheless, the remaining variability seems to affect small TVs more severely than large ones. Statistical Lin analysis in tumors showed comparable concordance (ρc) for both
  and
and  quantification regardless of the therapeutic device (glass or resin spheres) or tumor size. Better concordance was found for resin sphere dosimetry than for glass sphere dosimetry (Fig. 3; Table 4). This finding could be due to bias, as the glass spheres were specifically chosen for small tumors (TV ≤ 150 mL) in the lobar or segment approach.
We found comparable concordance between the two types of spheres for TVs of 150 mL or less. The higher concordance found for TVs larger than 150 mL (Table 5) is explained by a better precision (ρ), whereas the accuracy (Cb > 0.9) did not change appreciably with tumor size, confirming the robustness of our approach.
Average 99mTc-MAA uptake in TV has been shown to depend on tumor type (23), and a large variation in uptake has been observed within each given tumor type. Therefore, an extension of the present work to tumor types other than HCC could be of interest.
NTV
Predictive dosimetry in NTV tended to slightly underestimate posttreatment dosimetry ( < 1). Quantitative agreement between predictive and posttreatment dosimetry was more accurate for NTV than for TV (lower
  variability), possibly because of a better overall agreement achievable in larger volumes than in smaller ones. This hypothesis is supported by Figure 6, which indicates lower
  variability for patients treated with glass spheres, for whom the TV/NTV ratio was also lower as shown in Supplemental Figure 4. In view of the observed low
  variability, we are confident that severe overdosing of the remaining functional parenchyma can be avoided, thus providing a safe treatment to the patient.
Even when agreement between predictive 90Y dosimetry based on 99mTc-MAA SPECT and posttreatment dosimetry based on 90Y TOF PET was good for both TV (averaged overestimation, ∼30%) and NTV (averaged underestimation, ∼10%), some cases of important discrepancy occurred (extreme values in Fig. 6 and Table 6).
One limitation of our study was the low number of patients treated with the glass sphere approach (7 procedures; 11 TVs).
This study concerned and compared predictive and posttreatment dosimetry for both glass sphere radioembolization and resin sphere radioembolization performed by the same team at the same institution, thus adopting uniform, repeatable radioembolization and imaging procedures. In most other published studies, resin sphere radioembolization and glass sphere radioembolization were not performed at the same institution or by the same staff. We believe our approach (unification and homogeneity of patient preparation, activity administration, imaging procedures, and data analysis) in assessing and comparing the dosimetry for the two therapeutic options helps reduce quantitative bias.
CONCLUSION
In HCC patients undergoing 90Y-sphere radioembolization, we conclude that the 90Y dose inferred from 99mTc-MAA SPECT/CT is, in both TVs and NTVs, a valuable predictor of the posttreatment 90Y TOF PET/CT–derived absorbed dose. In particular, the low variability of  shows promise for predicting the absorbed dose in the remaining functional parenchyma and possibly for preserving hepatic function by minimizing toxicity. Furthermore, our analysis suggests that the predictive value in NTV is better for low TV/NTV ratios. Nevertheless, a discrepancy between predictive and posttreatment dosimetry was found in specific cases, possibly because of the differences in physical properties between 99mTc-MAA and 90Y-spheres, morphologic variations in hepatic or tumor vascularization, or an inability to perfectly reproduce the administration procedure. Therefore, we recommend performing post-SIRT dosimetry based on 90Y TOF PET/CT, especially if fractionated treatment or dose–response/dose–toxicity studies are needed. Postradioembolization 90Y TOF PET/CT can also provide valuable information in cases of extrahepatic shunt, helping the physician take appropriate corrective actions and improving posttherapy patient management.
Our study on the quantitative agreement of predictive and post-SIRT dosimetry found that, at a macroscopic level, there are no relevant differences between glass and resin spheres for TVs of 150 mL of less.
DISCLOSURE
The costs of publication of this article were defrayed in part by the payment of page charges. Therefore, and solely to indicate this fact, this article is hereby marked “advertisement” in accordance with 18 USC section 1734. No potential conflict of interest relevant to this article was reported.
Footnotes
↵* Contributed equally to this work.
Published online Jun. 15, 2016.
- © 2016 by the Society of Nuclear Medicine and Molecular Imaging, Inc.
REFERENCES
- Received for publication January 25, 2016.
- Accepted for publication May 16, 2016.


Jump to section
Related Articles
Cited By...
- Voxel-Based Dosimetry Predicts Hepatotoxicity in Hepatocellular Carcinoma Patients Undergoing Radioembolization with 90Y Glass Microspheres
- The Impact of Radiobiologically Informed Dose Prescription on the Clinical Benefit of 90Y SIRT in Colorectal Cancer Patients
- Resin Versus Glass Microspheres for 90Y Transarterial Radioembolization: Comparing Survival in Unresectable Hepatocellular Carcinoma Using Pretreatment Partition Model Dosimetry