


Abstract
The aim of this study was to quantitatively evaluate the ability of the body-surface-area (BSA) model to predict tumor-absorbed dose and treatment outcome through retrospective voxel-based dosimetry. Methods: Data from 35 hepatocellular carcinoma patients with a total of 42 90Y-resin microsphere radioembolization treatments were included. Injected activity was planned with the BSA model. Voxel dosimetry based on 99mTc-labeled macroaggregated albumin SPECT and 90Y-microsphere PET was retrospectively performed using a dedicated treatment planning system. Average dose and dose–volume histograms (DVHs) of the anatomically defined tumors were analyzed. The selected dose metrics extracted from DVHs were minimum dose to 50% and 70% of the tumor volume and percentage of the volume receiving at least 120 Gy. Treatment response was evaluated 6 mo after therapy according to the criteria of the European Association for the Study of the Liver. Results: Six-month response was evaluated in 26 treatments: 14 were considered to produce an objective response and 12 a nonresponse. Retrospective evaluation of 90Y-microsphere PET–based dosimetry showed a large interpatient variability with a median average absorbed dose of 60 Gy to the tumor. In 62% (26/42) of the cases, tumor, nontumoral liver, and lung doses would have complied with the recommended thresholds if the injected activity calculated by the BSA method had been increased. Average doses, minimum dose to 50% and 70% of the tumor volume, and percentage of the volume receiving at least 120 Gy were significantly higher in cases of objective response than in nonresponse. Conclusion: In our population, average tumor-absorbed dose and DVH metrics were associated with tumor response. However, the activity calculated by the BSA method could have been increased to reach the recommended tumor dose threshold. Tumor uptake, target and nontarget volumes, and dose distribution heterogeneity should be considered for activity planning.
Today, for 90Y-resin microspheres (SIR-Spheres; SIRTeX Medical), 3 activity-planning methods are recommended by the manufacturer: the empiric model, the body-surface-area (BSA) model, and the partition model (1,2). The empiric model recommends exclusively 3 values of activity based on tumor involvement. The BSA method, which has been historically used for chemotherapy, is based on patient surface area and tumor involvement but neglects the tumor-to-normal liver (T/N) uptake ratio. The partition model, which is based on the MIRD principles and is considered more accurate and personalized, accounts for tumor avidity but assumes a uniform dose distribution in the tumor. Despite its semiempiric nature, the BSA method is the most widely used so far because of its simplicity.
Many authors have discussed BSA-model limitations, emphasizing the lack of correlation with liver volume, tumor avidity, and absorbed dose and recommending more accurate and personalized methods (3–6). However, these limitations have not been quantitatively addressed with a voxel-based dosimetry. This study was a retrospective 3-dimensional voxel-based dosimetry analysis of a hepatocellular carcinoma population treated by 90Y-microsphere radioembolization with injected activity planned using the BSA-method calculation. The aim was to quantitatively evaluate the ability of the BSA method to predict tumor-absorbed dose and treatment outcome.
MATERIALS AND METHODS
Patient Characteristics
This study included 35 patients with unresectable hepatocellular carcinoma at our institution who underwent 42 treatments by radioembolization with 90Y-resin microspheres from February 2012 to December 2015. Of these 35 patients, 23 were included in the “Sorafenib Versus Radioembolization in Advanced Hepatocellular Carcinoma” protocol. Authorization for an ancillary study was obtained from the principal investigator. All patients gave written informed consent to treatment and to retrospective analysis of their clinical and imaging data for research purposes. All procedures were performed in accordance with the ethical standards of the institutional and national research committee and the Declaration of Helsinki.
The baseline characteristics for the treatments are reported in Table 1. In an individual patient, treatments targeting the right and left lobes separately or sequential treatments at more than a 6-mo interval were considered distinct procedures. There were 1 whole-liver, 35 lobar, and 6 segmental treatments. A retrospective dosimetric study was conducted on the 42 radioembolization sessions.
Baseline Characteristics for 42 Treatments
99mTc-Labeled Macroaggregated Albumin (99mTc-MAA) Imaging and Activity Planning
99mTc-MAA was injected into the hepatic artery as a 90Y-microsphere surrogate. Planar and SPECT/CT images were acquired within an hour. This simulation step was used to estimate lung shunt fraction and to verify right targeting and absence of extrahepatic deposition.
SPECT/CT data were acquired using an Infinia Hawkeye IV (GE Healthcare) with the following parameters: spectroscopic window at 140 keV ± 10%, 32 projections, 25 s/projection, 128 × 128 matrix, 4.4 × 4.42 × 4.42 mm voxels, and low-energy high-resolution collimator. SPECT data were reconstructed on a Xeleris 3.0562 workstation (GE Healthcare) using ordered-subset expectation maximization with 5 iterations and 8 subsets, and attenuation and scatter were corrected using standard commercial solutions (GE Healthcare).
Activity was planned by using the 90Y-microsphere manufacturer recommendations at that time. Following the most recent method proposed by Kennedy et al. (7), the BSA model was applied according to the type of treatment. For total liver treatment, ;for lobar treatment,
 ;and for segmental treatment,
 where BSA (m2) = 0.20247 × height0.725 (m) × weight0.425 (kg), Vtumor = tumor volume, Vtumor lobe = tumor volume in treated lobe, Vtotal lobe = lobe volume including tumor, Vtumor segment = tumor volume in treated segment, Vtotal segment = segment volume including tumor, and Vtotal liver = total liver volume including tumor. These volumes were previously defined by radiologists on contrast-enhanced CT or MRI.
Lung shunt fraction was evaluated using anterior and posterior planar scans. A dose to the lungs of more than 25 Gy or the presence of significant focal extrahepatic uptake was considered a contraindication to treatment.
90Y-Microsphere Imaging
90Y-microsphere distribution was controlled for each treatment session by a PET/CT examination on the next day. Liver-centered PET/CT acquisitions were performed on a Biograph non–time-of-flight PET/CT device (Siemens Healthcare) for a total scan duration of 40 min. The PET reconstruction parameters for posttreatment dosimetry were 3-dimensional ordered-subset expectation maximization (1 iteration, 8 subsets) with point-spread-function compensation, attenuation correction, gaussian postfiltering of 4 mm in full width at half maximum, a 128 × 128 matrix, and a voxel size of 5.3 × 5.3 × 3.4 mm.
Retrospective Dosimetry
Retrospective 99mTc-MAA SPECT– and 90Y-microsphere PET–based voxel dosimetry was performed using a treatment-planning system (PLANET Dose; DOSIsoft SA) following a process similar to the one used in external-beam radiation therapy (Fig. 1).

Process of retrospective pre- and posttreatment dosimetry. Tumor and NTL are delineated in red and blue, respectively.
The first step was the anatomic segmentation of target volumes (considered one global unique volume) and whole-liver volume on contrast-enhanced CT or MR images by a single radiologist using the diagnostic workstation available in the radiology department (AW Workstation; GE Healthcare). When relevant (n = 2), any necrotic (i.e., nonenhancing) area was subtracted from the tumor volume to assess dose in the viable tumor only. Contours were then imported as RT-Struct sets in the treatment-planning system. Lesions smaller than 2 cm were not considered for dose assessment in order to limit bias induced by the partial-volume effect. The nontumoral liver (NTL) volume was defined in the treatment-planning system by subtracting the tumor volume from the total liver volume.
99mTc-MAA SPECT/CT and 90Y-microsphere PET/CT images were coregistered with the reference examination (contrast-enhanced CT or MRI). 99mTc-MAA SPECT images were normalized so that total hepatic uptake matched the actual therapeutic activity corrected for lung shunt fraction and residual activity.
A 3-dimensional dose map was calculated for pre- and posttreatment dosimetry using a kernel convolution algorithm at the voxel level based on the formalism detailed in MIRD pamphlet no. 17 (8). The dose to a given target voxel k from N surrounding source voxels h (including the target voxel itself, h = 0) is given by the equation where
where  is the time-integrated activity within voxel h and
  is the absorbed dose per unit cumulated activity between each voxel pair (S value). This equation was implemented in the dose calculation algorithm as a discrete convolution between the time-integrated activity map containing each individual
  and the voxel S-value kernel.
The average dose to the tumor was studied, as well as 3 metrics extracted from dose–volume histograms (DVH): the minimum dose to 50% and 70% of the tumor volume (D50 and D70, respectively) and the percentage of the volume receiving at least 120 Gy (V120).
Therapy Response
Treatment response was evaluated on follow-up contrast-enhanced CT or MRI obtained 6 mo after radioembolization by 2 radiologists. Response was defined according to the recommendations of the European Association for the Study of the Liver (9). Tumor response was conventionally classified as complete response (absence of any enhancing tissue), partial response (≥50% decrease in enhancing tissue), progressive disease (≥25% increase in size of one or more measurable lesions or appearance of new lesions), or stable disease. Objective response (OR) was defined as either complete or partial response. Stable or progressive disease were considered a nonresponse (NR).
Statistical Analysis
The optimal-to-actual (BSA-planned) activity ratio was calculated for each evaluation based on 90Y-microsphere PET dosimetry. Optimal activity was defined as the injected activity that would enable achievement of the tumor, NTL, and lung dose criteria (≥120, <50, and <30 Gy, respectively), as reported in the literature (7,10). For each case, the ratio lower bound corresponds to an optimal injected activity that would enable deliverance of 120 Gy to the tumor. The ratio upper bound represents the maximal activity complying with the 50-Gy limit to the NTL and the 30-Gy limit to the lungs. When the activity ratio based on the NTL or lung threshold was lower than the ratio based on the tumor threshold, only the NTL or lung tolerance criteria were considered.
Dose metrics based on 99mTc-MAA SPECT and 90Y-microsphere PET were compared using paired Student t tests. 90Y-microsphere–based dose metrics in OR and NR were compared using the Student t test. Pearson correlation and Bland–Altman analysis were used to evaluate the agreement between optimal activities based on 99mTc-MAA and 90Y-microsphere dosimetry. A P value of 0.05 or less was considered significant.
RESULTS
Therapy Response
Six-month response assessment was available in 26 treatments because of early deaths that occurred before 6 mo (n = 16). The 6-mo response rate according to the criteria of the European Association for the Study of the Liver for these 26 treatments was 54%. There were 14 ORs, including 4 complete and 10 partial responses, and 12 NRs, including 5 cases of stable disease and 7 of progressive disease. For one patient, response was considered complete because his disease was downstaged and he benefited from a hepatectomy 4 mo after radioembolization.
Dosimetry
Table 2 summarizes the main dosimetric data over the analyzed treatments: injected activity, lung shunt fraction, treated tumor volume, average dose to the tumor and to the NTL, minimum dose to 50% and 70% of tumor volume, and percentage of volume receiving at least 120 Gy. Average dose to the tumor and all DVH indices based on 90Y-microsphere PET dosimetry were significantly higher in OR than in NR (97 ± 53 Gy vs. 60 ± 24 Gy for average dose to tumor; 87 ± 49 Gy vs. 50 ± 21 Gy and 61 ± 38 Gy vs. 34 ± 17 Gy for minimum dose to 50% and 70%, respectively, of tumor volume; and 28% ± 28% vs. 9% ± 13% for percentage of volume receiving at least 120 Gy). The difference between 99mTc-MAA SPECT– and 90Y-microsphere PET–based dosimetry was not significant for any metric except average dose to NTL.
Dose Metrics for All Treatments and for Those with a 6-Month Tumor Response Evaluation*
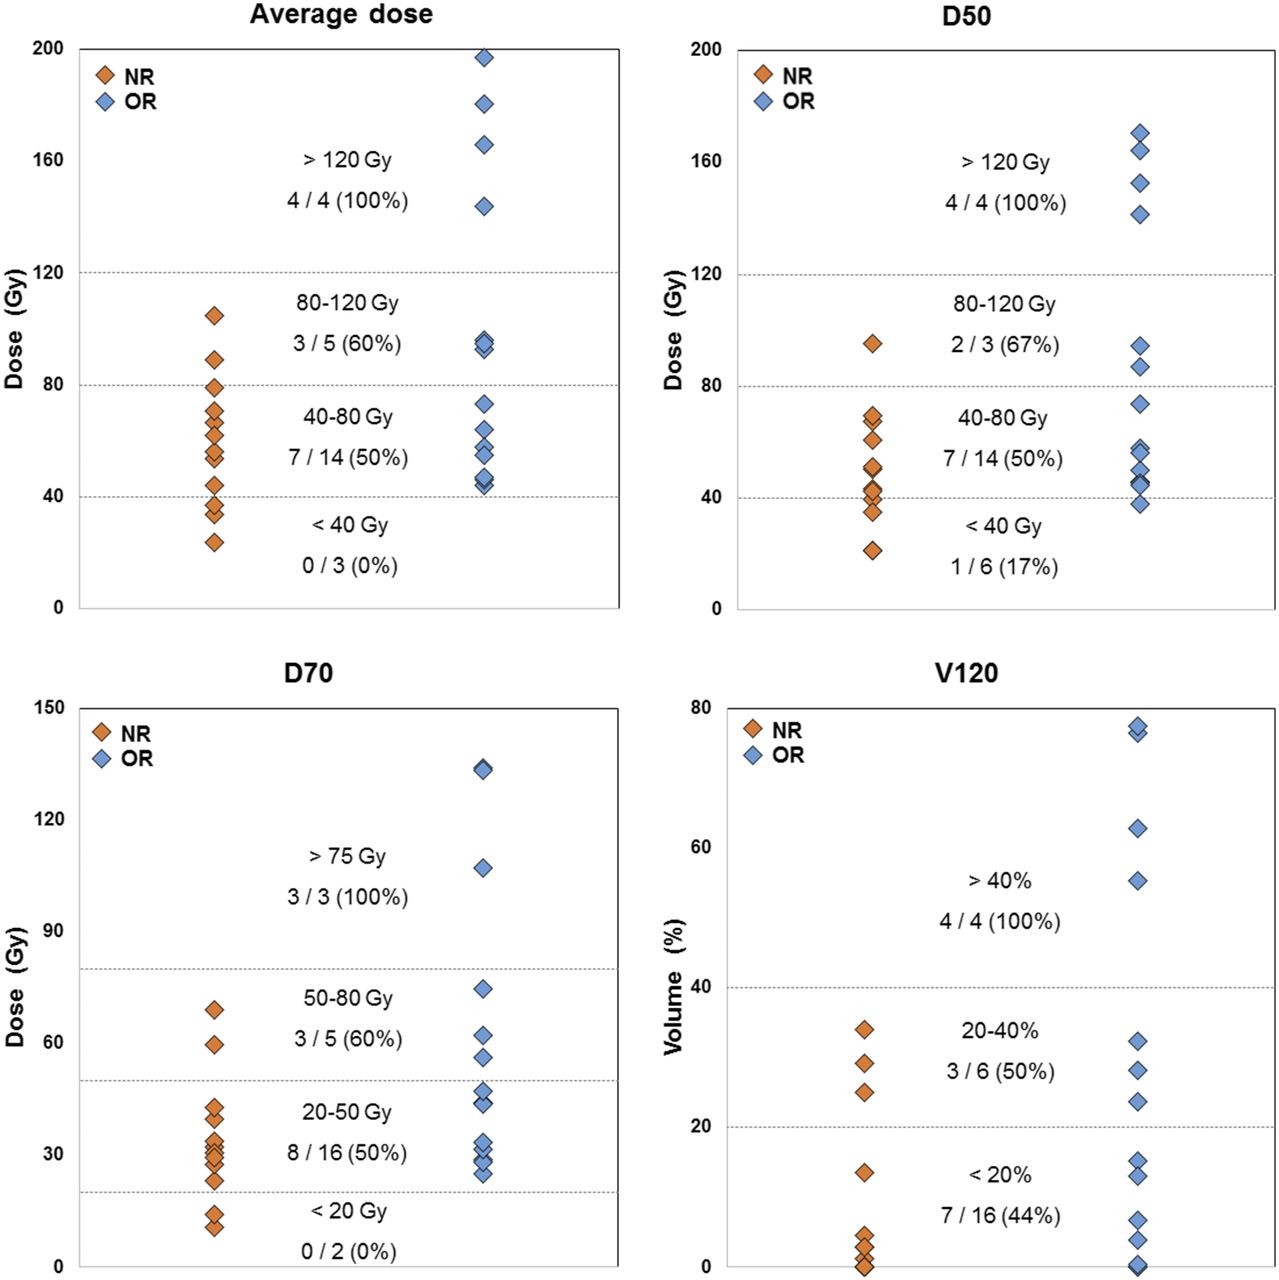
Figure 2 shows the distribution of 90Y-microsphere PET–based average tumor dose and DVH metrics in NR and OR treatments. Number and percentage of responding tumors are specified for stratified ranges of each dose metric, highlighting the dose–effect relationship.

90Y-microsphere PET–based average tumor dose and DVH metrics in NR and OR treatments. Number and percentage of responding tumors are specified for stratified ranges of dose metrics, highlighting dose–effect relationship. D50 and D70 = minimum dose to 50% and 70%, respectively, of tumor volume; V120 = percentage of volume receiving at least 120 Gy.
Regarding 90Y PET–based tumor dosimetry, for an average dose of 120 Gy or more, all treatments (n = 4) were found to result in an OR. In contrast, for an average dose of 40 Gy or less, all treatments (n = 3) resulted in a progressive disease state. For average doses ranging from 44 to 105 Gy, the treatments resulted in an OR (n = 10), stable disease (n = 5), or progressive disease (n = 4) state.
Regarding 90Y PET–based D70, for a dose of 80 Gy more, all treatments (n = 3) were found to result in an OR, with the average tumor dose ranging from 93 to 180 Gy. For doses of 20 Gy or less (which means 30% of the volume was receiving < 20 Gy), all treatments (n = 2) resulted in a progressive disease state, with the average tumor dose being 24–34 Gy. For doses ranging from 23 to 69 Gy, the treatments resulted in an OR (n = 11), stable disease (n = 5), or progressive disease (n = 5) state.
Optimal Activity
For each of the 42 treatments, the optimal activity to reach a dose of 120 Gy to the tumor was calculated using a proportionality relationship based on 90Y-microsphere dosimetry and ranged from 0.43 to 7.8 GBq. When the 50- and 30-Gy limits were added to the NTL and lungs, respectively, the optimal activity ranged from 0.43 to 6.9 GBq.
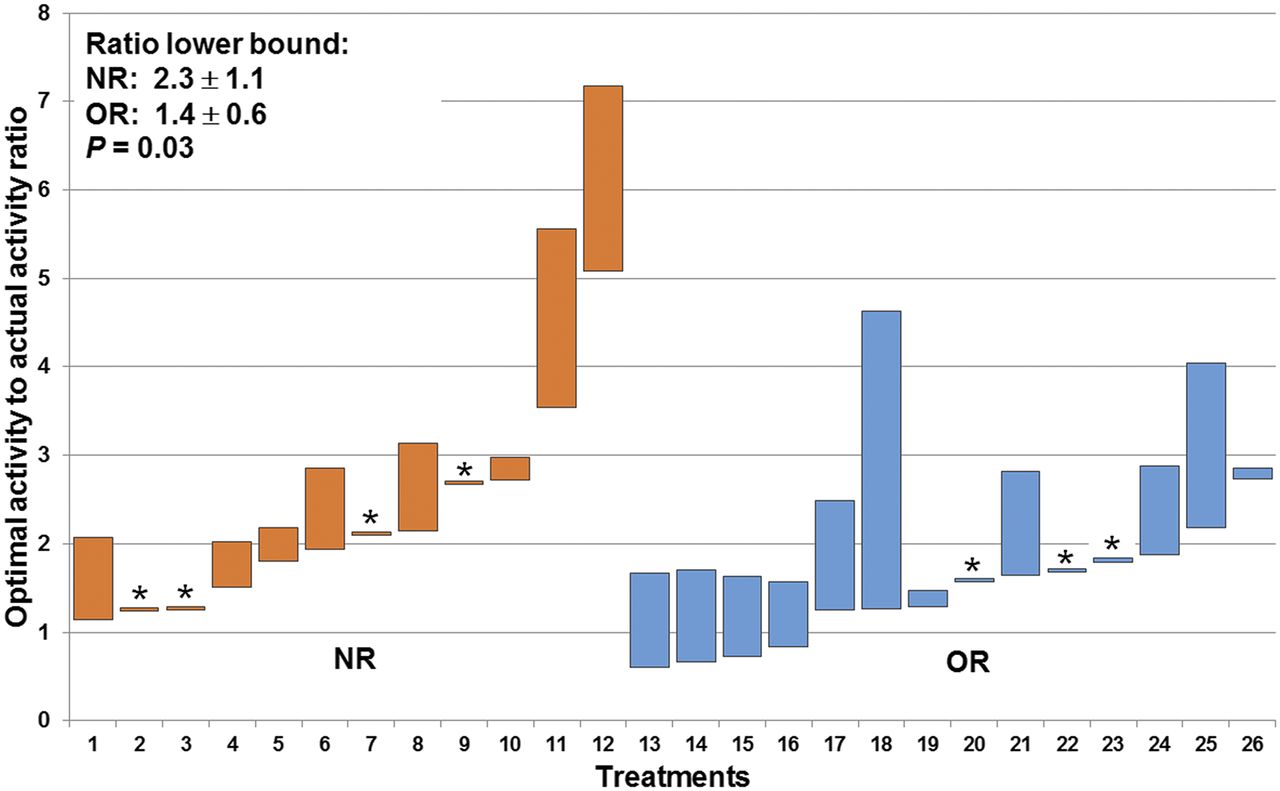
The ratio of the optimal activity to the activity planned by the BSA model was calculated for each of the 26 treatments that were evaluated at 6 mo. Figure 3 shows the ratios according to tumor response. The ratios to reach an average dose of 120 Gy to the tumor while keeping the dose to the NTL and the lungs under the tolerance thresholds were significantly higher in the NR group (2.3 ± 1.1; range, 1.1−5.1) than in the OR group (1.4 ± 0.6; range, 0.6−2.7; P = 0.03). In 73% of the treatments (19/26), 120 Gy to the tumor could have been delivered while keeping the dose to the NTL and lungs less than 50 and 30 Gy, respectively. Considering all treatments, this proportion was 62% (26/42). In the remaining treatments, the 120-Gy objective would not have been achievable because of unfavorable tumor targeting.

Optimal-to-actual (BSA-based) activity ratio for each of 26 treatments with 6-mo European Association for Study of Liver response evaluation. Lower bound corresponds to 120 Gy objective to tumor, upper bound to 50 and 30 Gy limitations to NTL and lungs, respectively. Treatments in which NTL and lung dose limitations would not allow 120 Gy to reach tumor are marked with asterisk.
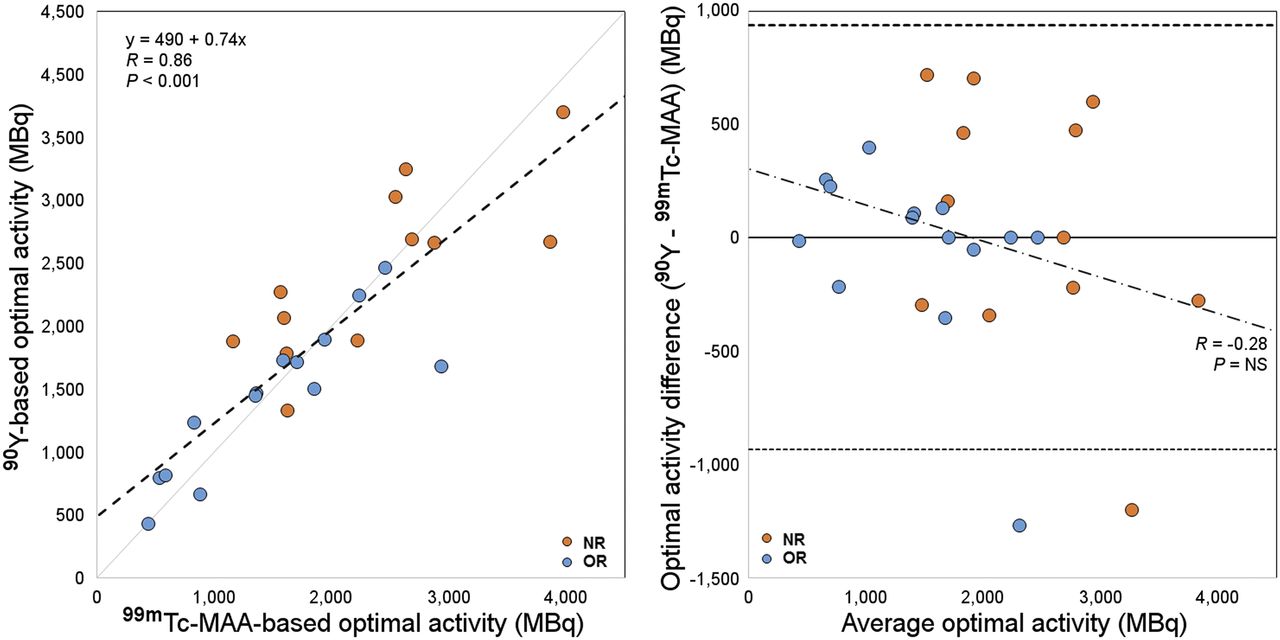
Figure 4 shows the comparison (correlation plot and Bland–Altman diagram) between 99mTc-MAA SPECT– and 90Y-microsphere PET–based optimal activities. The 2 dosimetric approaches agreed well overall (R = 0.86, P < 0.001).

Comparison between optimal-activity calculations based on 99mTc-MAA and 90Y-microsphere dosimetry. In scatterplot on left, dashed line stands for linear regression. In Bland–Altman diagram on right, solid line indicates mean difference and dashed lines 95% limits of agreement. NS = not significant.
DISCUSSION
Therapy Response
Tumor response was assessed according to the criteria of the European Association for the Study of the Liver as recommended in the literature. Keppke et al. showed that the use of combined criteria (size and necrosis) is more accurate for response assessment after radioembolization than the use of criteria based only on size (11). A 6-mo evaluation was chosen because the full response after radioembolization is supposed to be assessable 4–8 mo after therapy (12).
Retrospective evaluation of the 3-dimensional dose delivered to the tumor showed two main results—one regarding the BSA method and the other regarding the dose–effect relationship.
The BSA Method: A Nondosimetry Approach
The first result relates to an overall analysis of delivered dose when activity was planned with the more recent version of the BSA method described by Kennedy et al. (7). In the literature, the recommended dose to be delivered to hepatocellular carcinoma tumors to achieve response with 90Y-resin microsphere radioembolization is 120 Gy (10). In our population, the median value of the average dose was 60 Gy, which is half the recommended dose, and in only 6 cases (14% of the treatments) was the average tumor dose higher than the 120-Gy objective. As for the doses to the NTL, they were all lower than the 50-Gy threshold. Furthermore, in 26 of 42 treatments (62%), 120 Gy to the tumor could have been delivered while keeping the dose to the NTL and to the lungs less than 50 Gy and 30 Gy, respectively. The underdosing retrospectively observed in most of the cases could be related to the BSA calculation used, which is not a dosimetry-based method, as mentioned by Kao et al. (3). This possibility is illustrated by Figure 3, which shows that the optimal injected activity would be higher than the injected activity planned by the BSA model for all treatments that resulted in an NR (ratio > 1). In the remaining 38% of treatments, the 120-Gy objective would not have been achievable because of unfavorable tumor targeting.
More recently, Kao et al. discussed the limitations of the BSA method by pointing out, particularly, the missing T/N ratio in the BSA formula (13). T/N ratio referring to the preferential 90Y-microsphere implantation in the tumor is lesion-based and underlies radioembolization efficacy. Low dose-values are precisely due to unfavorable T/N ratios. Neglect of the T/N ratio could partly explain the high interpatient variability in average absorbed doses to tumor (for posttreatment dosimetry, 74 ± 47 Gy; range, 23−197 Gy) while the same planning objective was assumed when applying the BSA method. Also, as noted by several authors, the BSA method is not correlated with liver size. This method may be suitable in a healthy population but can lead to over- or underdosage in cancerous livers, especially in situations of extreme tumor burden (5,14,15) or atrophic liver related to chronic liver disease.
Moreover, Kao et al. interestingly noted that being based only on patient height, weight, and tumor involvement, the range of activities calculated by the BSA method would mainly be included between 1 and 3 GBq when considering extreme cases (3). In our population, to reach the 120-Gy mean absorbed dose to the tumor while keeping the dose to the NTL and the lungs below the respective 50- and 30-Gy tolerance thresholds, injected activity should have ranged from 0.43 to 6.5 GBq. This range of activity exceeds the activity vials available today. These theoretic values would need to be adjusted with consideration of other factors, such as patient baseline condition, remaining hepatic function, and tumor uptake (1); hence, multiplying the activity by a simple coefficient would likely not be adequate in most cases. The flaw is in the BSA formula itself, which is not adapted for this therapy because it disregards essential parameters such as T/N ratio, liver volume, and dose distribution heterogeneity. Today, only voxel-based dosimetry integrates all these variables, and its feasibility has already been proven (16,17).
Dose–Effect Relationship
The second interesting result regards the relationship between dose and treatment response for hepatocellular carcinoma patients. Average dose and all dose metrics extracted from DVHs were significantly higher in OR than in NR (Table 2).
Although the mean value of D70 was 45 Gy over the treatments we analyzed, a D70 higher than 80 Gy resulted in an OR for all treatments (n = 3). Kao et al., who were among the earliest authors to analyze DVHs for 90Y-microsphere radioembolization, suggested a D70 100 Gy objective for a complete response (18). Putting aside differences in methodology, discrepancies between the two thresholds can be explained by the fact that delivered doses were higher in their population and the selected patients were treated under highly favorable conditions. In both studies, this DVH analysis was performed on a small number of patients. A larger study is required to define dose thresholds from DVH as additional dosimetric indicators to the average dose commonly used. In agreement with the tumor-dose objectives given in the literature, all tumors (n = 4) receiving an average dose higher than 120 Gy were found to respond to treatment (10).
Therefore, combining average dose value and dose metrics extracted from DHVs could help to plan a suitable therapeutic activity and predict treatment response.
As reported by several authors, both the BSA and the partition models assume a homogeneous 90Y-microsphere deposition (6,19). However, as Kao et al. pointed out, many studies have shown 90Y-microsphere deposition heterogeneity at microscopic and macroscopic levels (3,19–22). For this reason, interest in voxel-based dosimetry for predicting tumor control is growing, as D’Arienzo et al. concluded in their case report (23). In addition to greater accuracy, dose map calculation provides analysis tools (dose profiles, isodose displays, DVHs) similar to those used in external-beam radiation therapy to help the medical team optimize treatment planning.
Limitations and Perspectives
Caution should be taken with the dose values given here, as they are only an indication of the dose–effect relationship. They cannot be taken for clinically applicable dose thresholds, because of two main limitations. First, a limited number of patients was included to ensure homogeneity of tumor histology, 90Y-microsphere type, and planning methodology within the cohort. Second, 90Y-microsphere PET–based dosimetry may suffer from variability due to image noise and free-breathing acquisitions, as well as bias related to the partial-volume effect and registration inaccuracies.
In this study, tumor dosimetry based on 99mTc-MAA did not significantly differ from that based on 90Y-microspheres. Although 99mTc-MAA is not a perfect 90Y-microsphere surrogate, as already discussed in the literature (24,25), it is today the only consensual method to assess dose before treatment and it plays a key role in planning the activity to inject. That is why the agreement between 99mTc-MAA SPECT and 90Y-microsphere PET dosimetry needs to be investigated in more detail.
As is shown in Figure 3, in most cases there was a wide margin of decision between the two classic approaches discussed in the literature, that is, the minimal efficient activity (preserving the NTL as much as possible while delivering sufficient dose to the tumor) (10) and the maximal tolerable activity (26). Individual therapeutic decisions require a patient-based approach taking into account clinical status, hepatic functional reserve, and cumulative-dose issues if future therapies are considered.
CONCLUSION
This retrospective study yielded two main results. First, the activity to administer as calculated by the BSA method could have been increased in most cases to comply with the dose thresholds recommended in the literature. Second, in our population, tumor dosimetry (whether in terms of average dose or DVH metrics) was markedly associated with tumor response. The increasing interest in radioembolization is going to require dosimetry tools and reference levels that allow us to better personalize treatments.
DISCLOSURE
Marilyne Kafrouni is an employee of DOSIsoft SA (Cachan, France) as a PhD student. Sébastien Vauclin is an employee of DOSIsoft SA (Cachan, France). No other potential conflict of interest relevant to this article was reported.
Footnotes
Published online Mar. 15, 2018.
- © 2018 by the Society of Nuclear Medicine and Molecular Imaging.
REFERENCES
- Received for publication September 27, 2017.
- Accepted for publication December 30, 2017.


