


Abstract
The epidermal growth factor receptor (EGFR) is highly expressed in a significant number of human malignancies, and its expression is associated with tumor aggressiveness and overall treatment resistance. The monoclonal antibody cetuximab is increasingly used in clinical settings as a treatment modality in combination with more conventional therapies, such as radio- and chemotherapy. Currently, little is known about tumor-specific uptake and overall pharmacokinetics. Noninvasive quantification of cetuximab uptake could provide important diagnostic information for patient selection and therapy evaluation. To this end, we have developed and validated a novel probe using cetuximab labeled with the long-lived positron emitter 89Zr for PET imaging. Methods: Tumor cell lines with varying EGFR expression levels were used for in vivo tumor imaging experiments. PET with 89Zr-labeled cetuximab (3.75 ± 0.14 MBq) was performed on tumor-bearing NMRI-nu mice at multiple time points after injection (ranging from 1 to 120 h) and quantified by drawing regions of interest on selected tissues. Uptake was compared by biodistribution γ-counting, and ex vivo EGFR expression levels were quantified using Western blot analysis. Results: Uptake of 89Zr-labeled cetuximab was demonstrated in the EGFR-positive tumors. However, the EGFR levels measured in vivo did not correlate with the relative signal obtained by PET. Tumor-to-blood ratios were significantly higher in the cell lines with intermediate (compared with the high) EGFR expression starting from 24 h after injection. Normal tissue uptake was unaffected by the different tumor types. Ex vivo γ-counting experiments confirmed the observed in vivo PET results. A similar disparity was found between 89Zr-labeled cetuximab tumor uptake and in vivo EGFR expression levels as demonstrated by Western blotting. Conclusion: The 89Zr-labeled cetuximab imaging probe is a promising tool for noninvasive evaluation of cetuximab uptake. Our results demonstrate a disparity between in vivo EGFR expression levels and cetuximab uptake. In a general sense, the results indicate a disparity between antibody uptake and expression levels of a biologic target in a tumor, suggesting that additional pharmacokinetic or pharmacodynamic mechanisms influence tumor delivery of this therapy. These additional mechanisms may explain why receptor expression levels alone are not sufficient to predict patient response.
Over the past few decades, monoclonal antibodies (mAbs) have increasingly been used as targeting agents in oncology and are currently the subject of many important clinical trials (1,2). One key biologic target for these mAbs is the epidermal growth factor receptor (EGFR), a member of the ErbB family. EGFR has been shown to play an essential role in the upregulation of tumor cell proliferation, differentiation, and survival (3,4). Activation of EGFR occurs when a ligand (e.g., epidermal growth factor or transforming growth factor alpha) binds to the extracellular ligand-binding domain, resulting in EGFR dimerization, internalization of the ligand–receptor complex, and activation of the downstream signaling pathway. High EGFR expression is associated with tumor aggressiveness and overall treatment resistance and is common in a significant number of human malignancies (5,6). As a result, EGFR targeting has been explored as a possible antitumor strategy, where the extracellular ligand-binding domain or the intracellular domain of the receptor is targeted with mAbs or small-molecule EGFR tyrosine kinase inhibitors, respectively (7,8). Both these therapies disrupt the EGFR signaling pathway, resulting in inhibited cell cycle progression, decreased angiogenesis, and reduced metastatic invasion (9).
Cetuximab (Erbitux; ImClone Systems Inc.) is an example of a mAb that blocks the ligand-binding domain of EGFR with high affinity, thereby preventing downstream signaling (9,10). Consequently, cetuximab has evolved as a promising new therapy agent in oncology and is increasingly used in clinical trials, mainly in combination with chemo- or radiotherapy (11,12). The overall pharmacokinetics of cetuximab are slow (elimination rate ranging from 66 to 97 h), partly because of the large size (±152 kDa) of the antibody (13). Despite the extensive use of cetuximab in clinical settings, much is still unknown about the patient-specific pharmacokinetics and pharmacodynamics of its tumor uptake, resulting in a lack of knowledge about the relationship between dosage and therapeutic effect. Also, a disparity between EGFR expression levels and treatment outcome has been reported (14–16), where even tumors negative for EGFR on biopsy responded to cetuximab treatment (17). Furthermore, in patients it has been shown that mAbs that inhibit EGFR are associated in a dose-dependent manner with several dermatologic side effects. In general, cutaneous side effects were most common, and patients experienced a mild to moderate eruption that did not require withdrawal of treatment (18). On the other hand, an adequate cetuximab dose must be used to obtain sustained tumor uptake, since the liver has the capacity to absorb infused antibody up to 40 mg. Higher doses result in liver saturation and consequently in sufficient tumor uptake (19). Therefore, noninvasive monitoring of in vivo cetuximab uptake could significantly increase knowledge of its clinical use as a targeting agent and eventually lead to the selective enrollment of patients and monitoring of uptake before and during treatment.
Using cetuximab itself as an imaging agent has several advantages for visualizing its distribution in normal and tumor tissues. Several groups have therefore investigated cetuximab-based noninvasive imaging probes, the majority with SPECT and PET isotopes (19–25). Some studies were limited by the use of isotopes with relatively short half-lives (99mTc [6 h] and 64Cu [12 h]), which are incompatible with the long biologic half-life of cetuximab in the blood pool and the relatively low immunoreactive fraction of the cetuximab radioimmunoconjugate (22). Another PET isotope often suggested for antibody imaging is 124I, because its long half-life (100.3 h) allows imaging at later time points to acquire optimal information. However, an important disadvantage of 124I is the rapid degradation of the radioiodinated mAb upon internalization, resulting in rapid clearance of iodine from the target cells and PET images with tumor contrast that is too low and does not reflect actual tumor uptake of the antibody (20). Based on the findings of Verel et al. (26,27), the positron emitter 89Zr has ideal characteristics for use with antibodies (28). 89Zr demonstrates a long physical half-life (78 h) and, upon internalization of the antibody, 89Zr is trapped intracellularly in lysosomes (phenomenon of residualization) (29,30). Moreover, radiolabeling of cetuximab with 89Zr does not influence its binding potential to EGFR, resulting in an immunoreactive fraction of about 95% (28). For these reasons, 89Zr is an ideal radionuclide for the labeling of slow-kinetic intact antibodies with high-quality standards and is successfully used in preclinical (31) and clinical settings (20,32,33).
Here, we report on the development and testing of the imaging probe 89Zr-labeled cetuximab, which was validated preclinically in mice bearing tumors with varying EGFR expression. Using PET we assessed in vivo cetuximab uptake levels and correlated them with in vivo EGFR expression levels as determined by Western blotting.
MATERIALS AND METHODS
Synthesis of 89Zr-Labeled Cetuximab
89Zr was produced by a (p,n) reaction on natural 89Y as described by Verel et al. (27). 89Zr labeling of the mAb cetuximab was achieved as previously reported (28). Briefly, desferrioxamine B was succinylated (N-sucDf), temporarily filled with iron (Fe3+), and coupled to cetuximab using a tetrafluorophenol-N-sucDf ester. The premodified mAb was purified on a PD10 column after removal of Fe3+ by transchelation to ethylenediaminetetraacetic acid. Approximately 1 N-sucDf moiety was coupled per cetuximab, assessed by using 59Fe. Next, N-sucDf-cetuximab was labeled with 89Zr in N-(2-hydroxyethyl)piperazine-N′-(2-ethanesulfonic acid) buffer at pH 7.0 and again purified on a PD10 column to remove unbound 89Zr. The high-performance liquid chromatography–isolated fractions demonstrated a radiochemical purity on the order of 98%. Specific activity was typically in the range of 78 MBq/mg.
Animal and Tumor Model
Exponentially growing human epidermoid (A-431 [CRL-1555; ATCC]), breast (T-47D [HTB-133; ATCC]), glioblastoma (U-373 MG [HTB-17; ATCC]), and colorectal (HT-29 [HTB-38; ATCC]) carcinoma cells were cultivated in the appropriate medium supplemented with 10% fetal bovine serum and incubated in a humidified 5% CO2 chamber at 37°C. Adult NMRI-nu (nu/nu) female mice (28–32 g) were inoculated subcutaneously in the lateral flanks with 3 × 10⁶ cells resuspended in 100 μL of growth medium. Tumors were measured using a Vernier caliper in 3 orthogonal tumor diameters (A, B, and C), each corrected for the thickness of the skin, and tumor volumes were calculated on the basis of the formula A × B × C × π/6. Once tumor volumes reached an average of 400 mm3, the animals were injected with 89Zr-cetuximab (3.75 ± 0.14 MBq) via the lateral tail vein. All procedures were performed according to the guidelines of the National Institutes of Health (34). All animal experiments were in agreement with national guidelines, approved by the Animal Ethics Committee of the KU Leuven University, Belgium. Animals were given food and water ad libitum for the duration of the experiments. Isoflurane inhalation anesthesia (2% isoflurane in 100% O2 at a flow rate of 1.5 L/min) was used during all animal experiments.
PET and Analysis
PET was performed on a Focus 220 microPET scanner (Concorde Microsystems Inc.) with an axial field of view of 7.6 cm and a resolution of approximately 1.4 mm. For each animal, a custom-built alginate mold was made to obtain reproducible positioning in the opening of the camera between the imaging time points. Whole-body scanning was performed with 95 axial slices each of 0.796 mm in a single field of view, yielding radioactivity concentration measurements in voxels of 0.633 by 0.633 by 0.796 mm. After injection of 3.75 ± 0.14 MBq of 89Zr-cetuximab (average dose of 100 μg) into the lateral tail vein, a 25-min emission scan was obtained (5 frames each of 5 min) for each animal at 1, 4, 24, 48, 72, and 96 h after injection, with correction for random counts, dead time, and decay. For the HT-29 and U-373 MG tumor-bearing animals, an additional scan at 120 h after injection was also available. Each emission scan was preceded by a 10-min transmission scan using external rods of 57Co for subsequent attenuation correction. Three-dimensional list-mode data were acquired using an energy window of 350–750 keV and a coincidence timing window of 6 ns. The data were then stored in sinogram format and reconstructed iteratively in a 128 × 128 × 95 matrix using attenuation-weighted 2-dimensional ordered-subsets expectation maximization (Fourier rebinning, 16 subsets, 10 iterations, and 5 expectation maximization iterations). The images were visualized with ASIPro VM software (version 6.3.3.0; Concorde Microsystems Inc.) and analyzed using MATLAB (version 7.3, The MathWorks, Inc.). For each dataset, 3-dimensional regions of interest (ROIs) were manually drawn over the blood (heart outflow area), lungs, liver, kidneys, muscle, and tumors. Mean and maximum activity data (in Bq/mL) of the voxels within the ROIs were obtained. All data were corrected for 89Zr decay toward injection and the percentage injected dose (%ID) and are therefore expressed as %ID/mL. Tumor-to-blood uptake ratios were calculated by dividing the activity data within the tumor ROI by the activity value within the blood ROI drawn on the outflow area of the heart.
Immunoblotting
Minced tumor pieces and cell pellets obtained from a 6-cm culture dish were extracted in radioimmunoprecipitation assay lysis buffer (150 mM NaCl, 1% NP-40, 0.5% sodium deoxycholate, 0.1% sodium dodecylsulfate, 50 mM Tris-HCl [pH 7.5], 1× protease inhibitor cocktail) for 30 min on ice, and protein concentrations were determined by a Bradford assay (Bio-Rad). Proteins were separated on a 10% sodium dodecylsulfate–polyacrylamide gel and blotted onto a nitrocellulose membrane (Amersham Corp.) by electrotransfer. The membrane was blocked with 5% blotting-grade nonfat dry milk (Bio-Rad). Blots were probed with antibodies directed against EGFR (Santa Cruz Biotechnology) or β-actin (Sigma). Bound antibodies were visualized using horseradish peroxidase–linked secondary antibodies (antirabbit [Cell Signaling Technologies] or antimouse [Sigma]) and electrochemoluminescence (Amersham Corp.).
Biodistribution
After the last PET acquisitions, the animals were sacrificed under anesthesia and dissected. Blood, tumors, skin, sternum, heart, thymus, salivary glands, thyroid, trachea, lung, esophagus, liver, gallbladder, stomach, pancreas, spleen, ileum, colon, bladder, kidney, muscle, thigh bone, brown fat, eyes, ears, cerebrum, cerebellum, medulla oblongata, fat, and tail were washed, flushed with saline, and weighed, and the amount of radioactivity in each tissue was assessed in a γ-well counter (1480 Wallac Wizard 3" automatic γ-counter; PerkinElmer, Inc.). The tumors were halved, with one half used for quantification of 89Zr-cetuximab uptake and the other rapidly frozen for protein isolation. Disintegrations for each sample were collected over 1 min using an energy window between 48 and 1,354 keV. To correct for decay, injection standards were counted simultaneously. Radioactivity uptake was calculated as the %ID per gram of tissue.
Statistics
All statistical analyses were performed with SPSS 12.0.1 for Windows (SPSS Inc.). Graphs were drawn using Origin 6.0 (Microcal Software Inc.). Correlations among the groups were assessed using a nonparametric independent-samples test (Kruskal–Wallis test). Further, to determine the statistical significance of differences between 2 independent groups of variables, a nonparametric Mann–Whitney U test for small groups was used. For all tests, a probability value of less than 0.05 was considered significant.
RESULTS
In Vivo Uptake of 89Zr-Cetuximab
To evaluate the potential of 89Zr-cetuximab as an imaging agent, we injected 4 cell lines with variable levels of EGFR expression into NMRI-nu mice to form xenografts. A-431 was selected for high EGFR expression, U-373 MG and HT29 for intermediate expression, and T-47D for low expression, as previously described (16). The in vivo binding of 89Zr-cetuximab was assessed by performing PET at 72 h after injection of 100 μg of 89Zr-cetuximab in tumor-bearing mice (Fig. 1). A clear accumulation of 89Zr-cetuximab was found in the EGFR-positive tumors (U-373 MG, HT-29, and A-431), compared with the low-expression tumors (T-47D). Remarkably, a higher 89Zr-cetuximab uptake was demonstrated in the intermediate-expression U-373 MG and HT-29 tumors than in the high-expression A-431 tumor. The uptake in the low-expression tumor T-47D was comparable with that in the surrounding tissues. A clear accumulation was seen in normal tissues such as the liver, because of the hepatobiliary clearance of the antibody. Notable uptake was also found in the kidney.
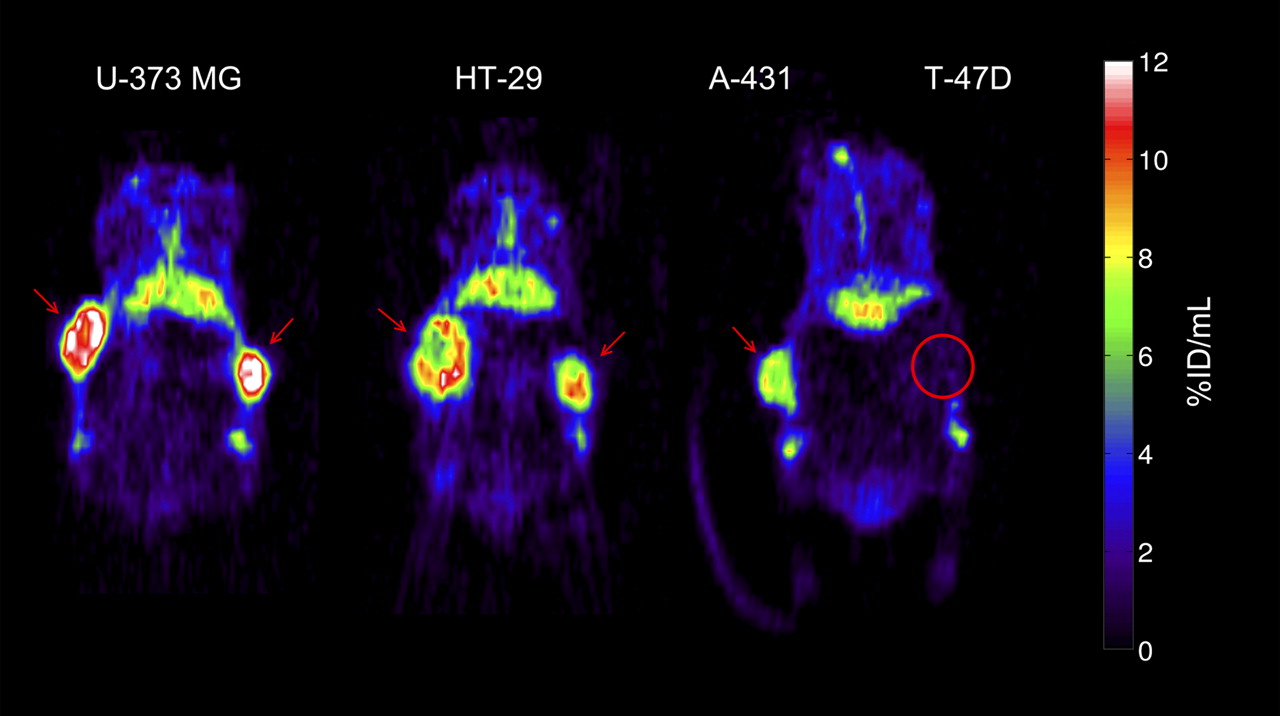
Representative small-animal PET images 72 h after injection of 89Zr-cetuximab. Mouse bearing U-373 MG (left) or HT-29 (center) tumors in both flanks. Mouse (right) bearing A-431 and T-47D (circled) tumor in right and left flanks, respectively. Red arrows indicate tumors. Images at mid-plane cross-section through tumor are shown. Images are corrected for injected dose and decay, represented as %ID/mL. High uptake is found in EGFR-expressing tumors (HT-29, U-373 MG, A-431), whereas uptake of low-expression tumor (T-47D) is comparable with overall uptake in surrounding normal tissue. 89Zr-cetuximab uptake was also found in catabolic organs: in liver and kidneys (below tumors).
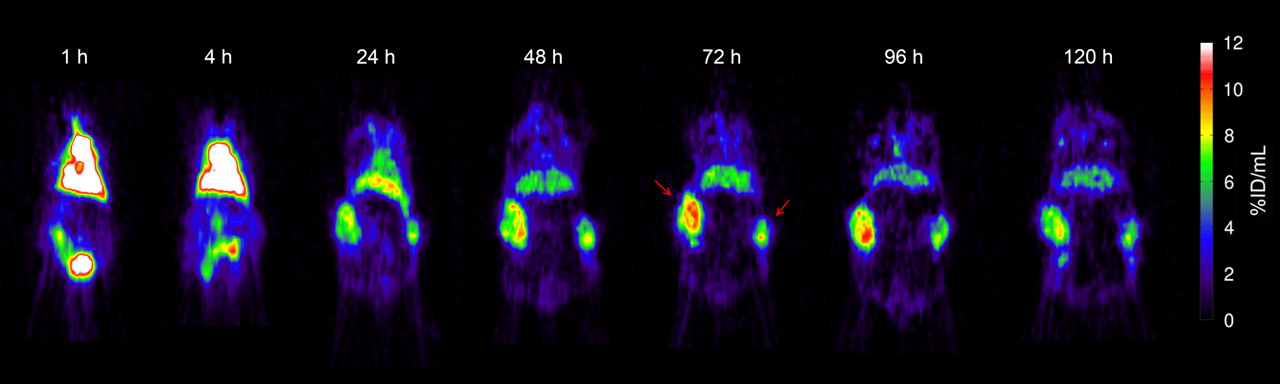
Imaging was performed at several time points after injection to assess the time–activity relationship of 89Zr-cetuximab uptake in the tumor. Figure 2 shows a representative time series of PET images of an HT-29 tumor-bearing mouse. From 24 h after injection, a clear localization of the tumors was seen above background uptake. The 89Zr-cetuximab uptake accumulated with time, and the highest tumor uptake was reached around 72–96 h after injection. Furthermore, uptake of 89Zr-cetuximab was heterogeneously distributed within the tumor. Uptake in the outflow area of the heart decreased with time. Uptake in the liver also decreased, but more gradually than in the heart.

Time series of representative small-animal PET images at indicated time points after injection of 89Zr-cetuximab into HT-29 tumor-bearing mouse. Red arrows indicate tumors. Uptake levels plateaued from 72 h after injection onward. To allow comparison between different time points, images are shown at mid-plane cross-section through tumor. Images are corrected for injected dose and decay and represented as %ID/mL.
Quantification of 89Zr-Cetuximab Uptake
To quantify the uptake of 89Zr-cetuximab in the different tumor types, we manually drew 3-dimensional ROIs over the heart (outflow area), lungs, liver, kidneys, muscle, and tumors. Figure 3A shows the 89Zr-cetuximab uptake in the different tumors at all investigated time points. Accumulation in the intermediate-expression tumors (U-373 MG and HT-29) was significantly higher at all time points than in the tumors with high (A-431) or low (T-47D) EGFR expression. Starting from 48 h after injection, the uptake levels differed significantly between all tumor types (i.e., U-373 MG > HT-29 > A-431 > T-47D). Uptake in U-373 MG and HT-29 rose significantly until 48 and 24 h after injection, respectively, and plateaued at about 9 %ID/mL and 7 %ID/mL, respectively. For both tumor types, a 120 h post injection time point was available, but tracer accumulation did not differ significantly from the 96 h post injection time point. A similar uptake pattern was found for the A-431 tumors, although stable accumulation around 4 %ID/mL was seen from 24 h after injection onward. The low-expression T-47D tumors showed no significant increase of 89Zr-cetuximab uptake with time (∼1 %ID/mL).

Quantification of 89Zr-cetuximab uptake from 1 to 120 h after injection. (A) Mean tumor uptake data for U-373 MG (n = 4), HT-29 (n = 4), A-431 (n = 6), and T-47D (n = 5) are shown and data are expressed as mean ± SD. For U-373 MG and HT-29 tumors, images were also available at 120 h after injection. All data were corrected for decay and injected dose of 89Zr and are expressed as %ID/mL. (B) Mean blood uptake as measured in outflow area of heart. Data are represented as mean ± SD for at least 2 independent mice. For comparison reasons, non-tumor-bearing mouse was included in analysis.
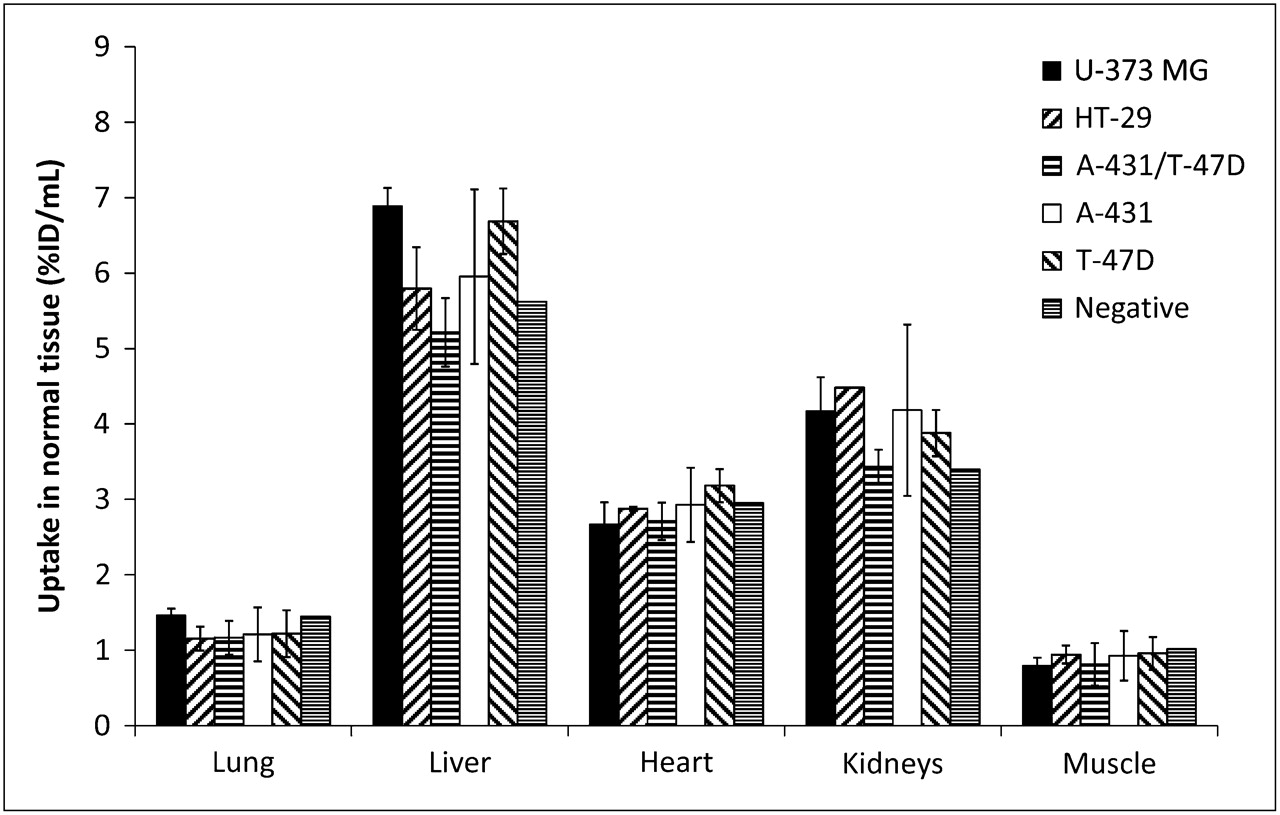
Blood activity was measured using an ROI drawn on the outflow area of the heart. 89Zr-cetuximab uptake in the blood showed a clearance pattern as depicted in Figure 3B, starting from about 18 %ID/mL (at 1 h after injection) to 3 %ID/mL (72–120 h after injection). This uptake was not influenced by the different tumor types expressing varying EGFR levels. We also investigated whether 89Zr-cetuximab uptake in normal tissues was dependent on tumor type; to this end, we quantified the uptake of 89Zr-cetuximab in several normal-tissue regions using the 96 h post injection PET images (Fig. 4), since stable tumor uptake was found at that time point. Uptake in normal tissues was relatively low, compared with uptake in tumor. Of the investigated tissues, liver and kidney uptake was highest, since those are the antibody clearance organs (especially the liver). Small, but not significant, pharmacokinetic differences in normal-tissue uptake between animals bearing different tumor types were found, indicating that normal tissue uptake was not affected by differences in tumor uptake, and vice versa.

Normal-tissue quantification of 89Zr-cetuximab uptake at 96 h after injection from animals bearing U-373 MG (n = 2), HT-29 (n = 2), A-431/T-47D (n = 3), A-431 (n = 3), T-47D (n = 2), and negative (n = 1) tumor types. Data for tumor-bearing mice are represented as mean uptake ± SD. All data were corrected for decay and injected dose of 89Zr and are expressed as %ID/mL.
Tumor-to-Blood Ratios
To assess the imaging potential of 89Zr-cetuximab, we evaluated the tumor-to-blood activity ratios of the tracer. As shown in Figure 3, an increasing tumor uptake and a decreasing heart uptake were found, resulting in growing tumor-to-blood ratios with time for the EGFR-positive tumors (Fig. 5). The mean tumor–to–mean blood (mean T/B) ratios are shown in Figure 5A. At more than 24 h after injection, all mean T/B ratios were significantly different between all investigated tumor types (i.e., U-373 MG > HT-29 > A-431 > T-47D). The intermediate-expression tumors (U-373 MG and HT-29) showed a significantly higher mean T/B ratio than did the other tumors, reaching a plateau at 2 (HT-29) to 3 (U-373 MG) from 72 h after injection on. In addition, the 120 h post injection time point showed no increase in mean T/B ratio for those tumor types. The mean T/B ratios for the A-431 tumors increased until 48 h after injection and plateaued at 1.5. At no point did the mean T/B ratio of the T-47D tumors exceed unity.

Tumor-to-blood ratios of 89Zr-cetuximab uptake from 1 to 120 h after injection. Ratios represent mean (A) or maximum (B) tumor uptake divided by mean heart uptake. Data for U-373 MG (n = 4), HT-29 (n = 4), A-431 (n = 6), and T-47D (n = 5) are expressed as mean ± SD.
Because tumors are known to be heterogeneous and the levels of heterogeneity between tumor types can differ, the mean and maximum uptake (i.e., the image voxel with the highest uptake) can vary considerably between different tumor types. Therefore, the ratio of maximum tumor uptake to mean blood uptake (max T/B) was also quantified (Fig. 5B). However, the pattern of 89Zr-cetuximab uptake was similar to the mean T/B ratios, although the max T/B ratios were higher for the EGFR-positive tumors. The max T/B ratio of the T-47D tumors also never exceeded unity. Differences in tumor growth during the experiment between the tumors with varying EGFR expression could influence the mean T/B and max T/B ratios. However, the growth rate of the different tumor types during the experiment was comparable, indicating that the T/B ratios were largely independent of tumor growth. The volumes at the end of the experiment relative to day 0 were 127% ± 33% for U-373 MG, 141% ± 22% for A-431, 142% ± 17% for HT-29, and 132% ± 24% for T-47D.
γ-Counting Validation
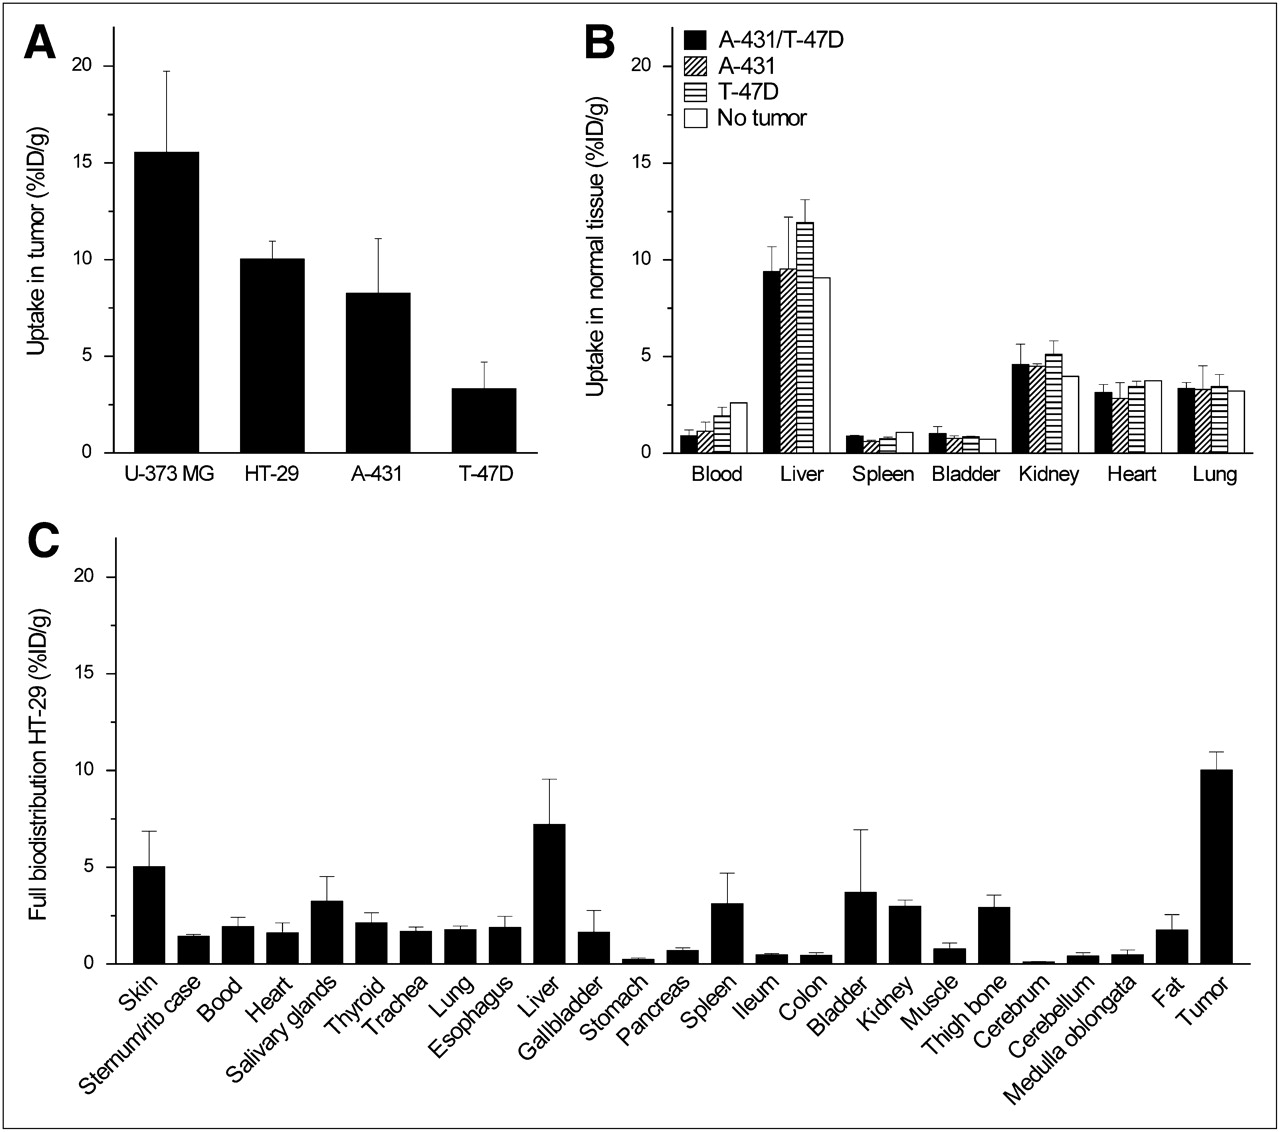
To validate the PET images and pharmacokinetics of 89Zr-cetuximab uptake, we performed γ-counting on ex vivo normal and tumor tissue. U-373 MG tumors had the highest average uptake, followed by HT-29 and A-431. The lowest uptake was found in the T-47D tumors (Fig. 6A). Uptake in several selected normal tissues was found for A-431, T-47D, A-431/T-47D mixed, and non-tumor-bearing mice (Fig. 6B). No significant differences were found in normal tissue uptake between the mice bearing different tumor types. The uptake patterns, assessed using γ-counting, were similar to the uptake seen on the PET images. A full biodistribution was performed on the HT-29 tumor-bearing mice (Fig. 6C). Uptake in all selected normal tissues was clearly lower than in HT-29 tumor. The highest uptake (i.e., >3 %ID/g) was found in the skin, salivary glands, liver, spleen, and bladder; other normal tissues, including stomach, pancreas, ileum, colon, muscles, cerebrum, cerebellum, and medulla oblongata, showed low uptake (<1 %ID/g).

γ-Counting experiment and biodistribution of ex vivo selected tissues. (A) Uptake of 89Zr-cetuximab by U-373 MG (n = 7) and HT-29 (n = 9) tumors at 120 h after injection and by A-431 (n = 7) and T-47D (n = 6) tumors at 96 h after injection is shown. (B) Selected normal-tissue analysis of A-431 T-47D (n = 3), A-431 (n = 3), T-47D (n = 2), and non–tumor-bearing (n = 1) mice. (C) Full biodistribution of HT-29 tumor–bearing mice (n = 6). All data represent mean ± SD, are decay-corrected to 96 h after injection, and are expressed as %ID/g.
Quantification of In Vivo EGFR Expression
Several microenvironmental parameters can influence in vivo EGFR expression, resulting in a difference between the in vivo and the in vitro tissue culture EGFR expression. We therefore assessed both the in vivo and the in vitro EGFR expression using Western blotting. Figure 7A depicts representative Western blots of the different tumors in the upper panel, and in vitro samples are shown in the lower panel. Densitometric quantification of the in vivo Western blots is shown in Figure 7B. The in vivo and in vitro EGFR expressions were comparable, showing the A-431 tumors as high, U-373 MG and HT-29 as intermediate, and T-47D as low. A-431 has significantly higher in vivo EGFR expression than do the other tumor types (U373-MG, P = 0.0002; HT-29, P = 0.0040; T-47D, P = 0.0002). No significant differences were found between the U-373 MG and HT-29 tumor types (P = 0.0902), whereas the T-47D was significantly lower than the other tumor types (U373-MG, P = 0.0024; HT-29, P = 0.0015; A-431, P = 0.002).

(A) Representative Western blots for in vivo and in vitro EGFR expression with actin as control. (B) Densitometric quantification of in vivo EGFR expression of U-373 MG (n = 16), HT-29 (n = 12), A-431 (n = 9), and T-47D (n = 7). Data are expressed as mean ± SD.
DISCUSSION
Little is known about patient-specific tumor uptake and the relationship between dosage and efficacy of the mAb cetuximab, for which a disparity between EGFR expression levels and cetuximab treatment efficiency has often been reported (14,15,17). To increase knowledge of the clinical use of cetuximab as a targeting agent, it is necessary to be able to monitor in vivo cetuximab uptake noninvasively. To address this need, we developed a cetuximab-based probe for PET. Here, we report the in vivo validation of the 89Zr-labeled cetuximab imaging probe. The positron emitter 89Zr was chosen given its ideal characteristics for use with antibodies (27,28). Like 68Ga and 64Cu, 89Zr demonstrates residualization, meaning that these radionuclides become trapped in lysosomes when the antibody internalizes and degrades (27–29). Furthermore, 89Zr has a much longer physical half-life (78 h) than other residualizing radionuclides. Antibodies show generally slow pharmacokinetics and need several days to plateau in the target organ. Therefore, 89Zr is the better-suited radionuclide for combination with intact antibodies (such as cetuximab). To assess the pharmacokinetics of cetuximab noninvasively and increase current knowledge in clinical practice, using cetuximab itself as an imaging probe is the obvious solution.
To assess the pharmacokinetics of 89Zr-cetuximab, we performed PET at several time points after injection and found a gradual increase in uptake in the high- and intermediate-expression tumors (Figs. 2 and 3A). The corresponding blood uptake decreased with time (Figs. 2 and 3B), resulting in high tumor-to-blood ratios (Fig. 5) at the plateau phase of cetuximab uptake (72–96 h after injection). On the other hand, normal tissue uptake at similar time points was significantly lower (Fig. 4). Therefore, the tumor-to-blood ratios (max T/B of 3–5) are sufficient for imaging purposes. Our PET results were confirmed by ex vivo biodistribution studies assessed with γ-counting. Again, uptake in the intermediate- and high-expression tumors was significantly higher than that in the surrounding normal tissues (Fig. 6). Although the γ-counting data (in %ID/g) demonstrated a trend similar to the quantified small-animal PET data (in %ID/mL), the absolute values of the γ-counting were higher. This difference can be explained by the partial-volume effects of the small-animal PET scanner.
To be able to predict which patients might benefit from cetuximab treatment, one must assess in vivo EGFR expression levels. Therefore, we investigated whether in vivo cetuximab uptake is associated with EGFR expression levels. Other investigators reported the use of 64Cu-DOTA-cetuximab for PET, showing prominent uptake in EGFR-expressing tumors but low accumulation in EGFR-negative tumors (22,24). A linear correlation between the %ID/g values (measured by 64Cu-labeled cetuximab PET) and EGFR expression levels (assessed with Western blotting) was found. However, because of the limiting half-life of the isotope 64Cu, imaging was possible only until 48 h after injection. Also, the immunoreactive fraction of 64Cu-labeled cetuximab was significantly lower (∼63% (22)) than that of 89Zr-labeled cetuximab (∼95% (28)). Another study, with the murine counterpart of cetuximab (mC225) labeled with 111In, reported a correlation between mAb uptake and EGFR expression (25). However, the aim of that study was not to evaluate this correlation, and the authors themselves stated that the observed results should be compared cautiously because of large differences in injected mAb concentration and image time points. Another explanation for these contradictory results can be the differences in tumor volume. Previous studies of de Bree et al. (35) and others showed that tumor volume largely determines antibody uptake, most likely related to blood supply, interstitial pressure, and transport distance from the interstitium. To mimic a clinical situation more closely we used larger tumors (≈400 mm3) that displayed a relatively lower uptake of 89Zr-cetuximab, compared with other studies with smaller tumors (22,25). However, as shown in Figure 5B, the maximum uptake voxel in the tumors is much higher (≈20 %ID/g) and comparable with the uptake in the other studies.
Our results demonstrated a large disparity between uptake of the antibody and in vivo EGFR expression. Quantification of the PET images indicated that uptake in the intermediate-expression cell lines (U-373 MG and HT-29) was approximately 2 times higher than uptake in the high-expression cells (A-431) (Fig. 3). However, Western blot quantification on ex vivo tumor material using anti-EGFR mAbs confirmed that EGFR expression was higher in the A-431 tumors than in the U-373 MG and HT-29 tumors (Fig. 7). We confirmed tumor EGFR expression by comparison with in vitro EGFR expression in cells and found similar results, indicating that EGFR expression levels did not change in the tumor. We considered the possibility that differences in in vivo tumor growth could have affected tumor uptake of the various xenograft lines; however, growth was comparable between the various xenograft lines.
Tumors originating from different cell lines have (besides EGFR expression) other physiologic effects, such as inadequate vasculature, differences in capillary permeability perfusion, and differences in necrosis. All these factors can play an important role in in vivo drug delivery (36,37). Also, cancer cells can bypass the dependency of EGFR for cell growth and survival by altering EGFR levels through promoting EGFR ubiquitination and degradation, resulting in overall cetuximab resistance (37). Therefore, it should be noted that if cetuximab is not able to reach the complete tumor, no therapeutic effect can be expected in these regions. However, if cetuximab is able to reach the complete tumor, a therapeutic effect may not necessarily occur given the redundancy in the EGFR pathway.
Taken together, the relationship between EGFR expression levels, cetuximab binding and, ultimately, clinical outcome is complex. In vitro there is a strong relationship between cetuximab binding and EGFR expression levels (16). Also, high levels of EGFR expression correlate with poor clinical outcomes (5). However, the treatment efficacy of cetuximab does not correlate with EGFR expression (14,15,17). Our results, revealing additional mechanisms influencing tumor delivery of cetuximab, show that cetuximab uptake is not only dependent on EGFR expression levels. These mechanisms may partially reveal why expression alone may not be sufficient to explain therapy effects. Possible explanations for the mismatch may include inadequate vasculature and perfusion, resulting in a heterogeneous and limited cetuximab uptake, even on treatment at a high mAb dose. A future quantification of the results, assessing differences in vasculature, perfusion, hypoxia, and proliferation, could explain why the “reachability” in the xenografts is disparate.
The chelate labeling of 89Zr with cetuximab is stable: indeed, it can be produced under good-manufacturing-practice settings, making it an ideal candidate for a fast translation to the clinic (27). In future clinical trials, 89Zr-labeled cetuximab may be used to noninvasively examine uptake of cetuximab into the tumor, thus allowing selection of patients who can potentially benefit from cetuximab treatment. Sequential imaging during treatment can also reveal microenvironmental changes influencing cetuximab perfusion and uptake. On the basis of these images, treatment can be monitored and dosage adjusted, making individualized treatment of cetuximab a possibility.
CONCLUSION
This study has demonstrated that cetuximab uptake in tumors can be assessed by PET using 89Zr-labeled cetuximab. This probe can thus potentially be used to evaluate the biologic and pharmacokinetic clinical effects of EGFR inhibitors, both cetuximab and others. A disparity was found between cetuximab uptake and in vivo EGFR expression; the imaging therefore represents cetuximab uptake instead of a quantification of EGFR expression levels. More generally, the results reveal additional mechanisms that influence antibody uptake in tumors besides the expression levels of a biologic target in a tumor alone.
Acknowledgments
We thank Nicole Bitsch for technical assistance with the animal experiments. We acknowledge financial support from the Dutch Cancer Society (KWF Kankerbestrijding grant UM2008-4210).
Footnotes
-
↵* Contributed equally to this work.
-
COPYRIGHT © 2009 by the Society of Nuclear Medicine, Inc.
References
- Received for publication May 16, 2008.
- Accepted for publication October 21, 2008.


Jump to section
Related Articles
Cited By...
- Epidermal Growth Factor Receptor-Targeted Fluorescence Molecular Imaging for Postoperative Lymph Node Assessment in Patients with Oral Cancer
- 89Zr-Chloride Can Be Used for Immuno-PET Radiochemistry Without Loss of Antigen Reactivity In Vivo
- Affibody-Based PET Imaging to Guide EGFR-Targeted Cancer Therapy in Head and Neck Squamous Cell Cancer Models
- Radiolabeling, Characteristics and NanoSPECT/CT Imaging of 188Re-cetuximab in NCI-H292 Human Lung Cancer Xenografts
- 64Cu-Labeled Repebody Molecules for Imaging of Epidermal Growth Factor Receptor-Expressing Tumors
- Preclinical Efficacy of an Antibody-Drug Conjugate Targeting Mesothelin Correlates with Quantitative 89Zr-ImmunoPET
- Targeting the Human Epidermal Growth Factor Receptors with Immuno-PET: Imaging Biomarkers from Bench to Bedside
- Immuno-PET Imaging and Radioimmunotherapy of 64Cu-/177Lu-Labeled Anti-EGFR Antibody in Esophageal Squamous Cell Carcinoma Model
- Imaging-Based Treatment Adaptation in Radiation Oncology
- PET Imaging in Head and Neck Cancer Patients to Monitor Treatment Response: A Future Role for EGFR-Targeted Imaging
- Antibody Positron Emission Tomography Imaging in Anticancer Drug Development
- Quantitative In Vivo Immunohistochemistry of Epidermal Growth Factor Receptor Using a Receptor Concentration Imaging Approach
- Evaluation of Near Infrared Fluorescent Labeling of Monoclonal Antibodies as a Tool for Tissue Distribution
- Three-Dimensional Histologic Validation of High-Resolution SPECT of Antibody Distributions Within Xenografts
- Imaging of Epidermal Growth Factor Receptor Expression in Head and Neck Cancer with SPECT/CT and 111In-Labeled Cetuximab-F(ab')2
- Interrogating Tumor Metabolism and Tumor Microenvironments Using Molecular Positron Emission Tomography Imaging. Theranostic Approaches to Improve Therapeutics
- Inactivation of HNSCC Cells by 90Y-Labeled Cetuximab Strictly Depends on the Number of Induced DNA Double-Strand Breaks
- Personalized Nanomedicine
- PET and MRI of Metastatic Peritoneal and Pulmonary Colorectal Cancer in Mice with Human Epidermal Growth Factor Receptor 1-Targeted 89Zr-Labeled Panitumumab
- Evaluation of the Anti-HER2 C6.5 Diabody as a PET Radiotracer to Monitor HER2 status and Predict Response to Trastuzumab Treatment
- Epidermal Growth Factor Receptor-Targeted Radioimmunotherapy of Human Head and Neck Cancer Xenografts Using 90Y-Labeled Fully Human Antibody Panitumumab
- 89Zr-DFO-J591 for ImmunoPET of Prostate-Specific Membrane Antigen Expression In Vivo
- Cerenkov Luminescence Imaging of Medical Isotopes
- Preparation, Biological Evaluation, and Pharmacokinetics of the Human Anti-HER1 Monoclonal Antibody Panitumumab Labeled with 86Y for Quantitative PET of Carcinoma
- Radiation Dosimetry of 89Zr-Labeled Chimeric Monoclonal Antibody U36 as Used for Immuno-PET in Head and Neck Cancer Patients
- Aiming for a Direct Hit: Combining Molecular Imaging with Targeted Cancer Therapy