


Abstract
Longitudinal imaging of intratumoral distributions of antibodies in vivo in mouse cancer models is of great importance for developing cancer therapies. In this study, multipinhole SPECT with sub–half-millimeter resolution was tested for exploring intratumoral distributions of radiolabeled antibodies directed toward the epidermal growth factor receptor (EGFr) and compared with full 3-dimensional target expression assessed by immunohistochemistry. Methods: 111In-labeled zalutumumab, a human monoclonal human EGFr-targeting antibody, was administered at a nonsaturating dose to 3 mice with xenografted A431 tumors exhibiting high EGFr expression. Total-body and focused in vivo tumor SPECT was performed at 0 and 48 h after injection and compared both visually and quantitatively with full 3-dimensional immunohistochemical staining for EGFr target expression. Results: SPECT at 48 h after injection showed that activity was predominantly concentrated in the tumor (10.5% ± 1.3% of the total-body activity; average concentration, 30.1% ± 4.6% of the injected dose per cubic centimeter). 111In-labeled EGFr-targeting antibodies were distributed heterogeneously throughout the tumor. Some hot spots were observed near the tumor rim. Immunohistochemistry indicated that the antibody distributions obtained by SPECT were morphologically similar to those obtained for ex vivo EGFr target expression. Regions showing low SPECT activity were necrotic or virtually negative for EGFr target expression. A good correlation (r = 0.86, P < 0.0001) was found between the percentage of regions showing low activity on SPECT and the percentage of necrotic tissue on immunohistochemistry. Conclusion: Multipinhole SPECT enables high-resolution visualization and quantification of the heterogeneity of 111In-zalutumumab concentrations in vivo.
The development of molecular imaging opens up exciting opportunities for advancing the detection, diagnosis, and treatment of cancer (1). In recent years, there has been considerable interest in the development and imaging of monoclonal antibody therapies (2,3). A significant amount of research is aimed at achieving targeted anticancer drug delivery by conjugating monoclonal antibodies to highly toxic agents (4,5).
Zalutumumab (6) is a human IgG1 monoclonal antibody, specific for the human epidermal growth factor receptor (EGFr), that has been developed for cancer treatment. EGFr is overexpressed in a variety of cancers and is associated with a more aggressive malignant phenotype and poor prognosis (7). Zalutumumab has 2 mechanisms of action that result in killing of EGFr-positive tumor cells. Aside from the blockade of ligand binding, there is also induction of antibody-dependent cell-mediated cytotoxicity, which is typical for IgG1 monoclonal antibodies (8). The efficacy of zalutumumab on binding to EGFr has been shown both in vitro and in vivo (9), but limited information is available on tumor penetration.
PET has been successfully applied to image the typically heterogeneous intratumoral distribution in human solid tumors (10). Although the spatial resolution of PET has recently been advanced into the submillimeter range, which allows similar imaging studies in mice (11), small-animal SPECT provides even higher (less than half-millimeter) spatial resolution, which can be achieved by exploiting focused multipinhole SPECT designs (12). In addition, most SPECT labels have a longer half-life and SPECT uses sets of tracers different from (and often complementary to) those available for PET. As a result, for many applications small-animal SPECT is chosen as the preferred method to image intratumoral immunoconjugate distributions in small xenografts in mice. Various studies have demonstrated that small-animal SPECT results in highly quantitative images (13–15).
Many SPECT studies on the relationship between radiolabeled antibody uptake and target receptor expression in a mouse xenograft model assume that these constructs are proportionally related (16,17). However, experiments aimed at validating this assumption against histology have been limited to comparisons involving 2-dimensional (2D) autoradiography (16,18) or comparisons with only a single histology slice (18–21). To our knowledge, no work has yet reported a slice-by-slice comparison of antibody uptake by xenografts in entire SPECT volumes against 3-dimensional (3D) histology.
The imaging capabilities of small-animal SPECT have been improved dramatically over the last few years (22). The aim of this study was to do an in-depth validation of the use of SPECT with the highest available resolution (less than half-millimeter) for 3D imaging of heterogeneous tumor uptake of 111In-labeled zalutumumab by comparing it with the ex vivo EGFr expression distribution as obtained by full 3D immunohistochemistry. To provide such a thorough 3D comparison, stacks of histology sections were constructed using dedicated protocols.
MATERIALS AND METHODS
Antibody Generation and Labeling with 111In
A human monoclonal antibody targeting human EGFr (zalutumumab, monoclonal antibody 2F8; Genmab) was generated as described previously (23). For labeling of zalutumumab with 111In, the antibody was conjugated with p-benzyl isothiocyanate-1,4,7,10-tetraazacyclododecane-1,4,7,10-tetraacetic acid (p-SCN-Bz-DOTA), as described previously (24). In short, a buffer exchange of the antibody to 0.1 M NaHCO3 (pH 9) was performed. Antibody (6 mg) was incubated with 0.2 mg of DOTA, and the premodified antibody was purified using gel filtration. The antibody–DOTA complex (3 mg) was labeled with 750 MBq of 111In (30 min at 45°C). After labeling, the mixture was incubated for 5 min with ethylenediamine tetraacetic acid, 0.05 mol/L, and the 111In-p-SCN-Bz-DOTA-zalutumumab was purified using gel filtration. For quality control, instant thin-layer chromatography and cell binding assays were performed as described previously (24). Instant thin-layer chromatography analyses revealed a radiochemical purity of 99.9% for the labeled antibody. The immunoreactive fraction was 88%.
Mouse Xenograft Tumor Model
All animal procedures were approved by the Utrecht University animal ethics committee and were performed in accordance with international guidelines on handling laboratory animals. A well-characterized subcutaneous xenograft tumor model was used (25). Briefly, 8- to 12-wk-old female severe combined immunodeficiency mice (C.B-17/IcrPrkdc-scid/CRL, n = 3) were purchased from Charles River Laboratories and housed in the Central Laboratory Animal Facility in a sterile filter-top cage with water and food provided ad libitum. Throughout the experiment, the mice were checked at least twice a week for signs of discomfort. A431 cells (an EGFr-overexpressing human epidermoid cancer cell line) were obtained from the Deutsche Sammlung von Mikroorganismen und Zellkulturen (cell line number, ACC 91). The cells were cultured in RPMI 1640 medium (BioWhittaker) supplemented with heat-inactivated fetal calf serum (10%; Wisend), penicillin (50 IU/mL), and streptomycin (50 μg/mL). Cells were detached by using trypsin–ethylenediamine tetraacetic acid in phosphate-buffered saline, harvested in the log phase (confluence, ∼70%), and tested for EGFr expression and potential mycoplasm contamination before the experiment. Five million tumor cells were inoculated subcutaneously into the right flanks of each of the 3 mice after removal of hair, using a 29-gauge needle. The tumors were measured by Vernier calipers, and volumes were estimated as 0.52 × length × width2 (in mm3) (26). On the day of the first SPECT imaging session, the estimated tumor volumes were 300 mm3, 290 mm3, and 330 mm3, and the associated mice had body weights of 22 g, 22 g, and 24 g, respectively.
Ultra-High-Resolution SPECT
SPECT was performed with the U-SPECT-II system (MILabs). This device uses stationary detectors with exchangeable collimators for different-sized animals or for specific organs (12). In this study, targeted SPECT acquisitions were performed (27) using a mouse collimator with 75 pinholes (diameter, 0.6 mm).
Imaging Protocols
Nineteen days after tumor cell inoculation, the mice were anesthetized using isoflurane (1%–2% in air) and a nontherapeutic effective 5 mg/kg dose of 111In-labeled zalutumumab (29.6 ± 1.6 MBq) was injected into the tail vein. Immediately after injection, a 45-min in vivo total-body SPECT/CT scan was obtained while anesthesia was maintained. Body temperature, heart rate, and breathing frequency were monitored continuously and kept at normal physiologic values. At 48 h after injection, anesthesia was reinitiated and a 45-min in vivo focused SPECT scan of the tumor was obtained, followed by a second 45-min total-body SPECT/CT scan. Subsequently, the mice were euthanized by anesthetic overdose. Immediately after each last scan, the entire mouse carcass was snap-frozen by immersion in −80°C isopentane. To avoid tissue repositioning and deformation, the carcasses were immersed while still situated on the animal bed. The activity in the mouse carcasses was measured using a dose calibrator, and the carcasses were stored in a −80°C freezer until further use. The total-body and focused tumor SPECT images were reconstructed using pixel-based ordered-subset expectation maximization with 6 iterations and 16 subsets (28), on 0.375-mm (total-body) and 0.1875-mm (focused tumor) isotropic 3D voxel grids. To increase image contrast, scatter correction was applied similarly to a triple-energy-window–based correction described earlier (14). Briefly, 2 photopeak energy windows (150–185 and 220–270 keV) corresponding to the 2 photopeaks of 111In were selected, as well as 3 background energy windows (133–150, 189–218, and 275–292 keV). The CT scans were reconstructed using cone-beam filtered backprojection (Feldkamp algorithm) on an 83-μm voxel grid. The focused tumor SPECT images were corrected for nonuniform attenuation by a method described earlier (14), using CT images.
Full-Tumor Tissue Sectioning
After the radioactivity had sufficiently decayed, the tumors were removed from the carcass, including a small margin of surrounding tissue. A cryostat (Microm HM560; Thermo Fisher Scientific) was used to obtain 10-μm-thick transaxial tissue sections from the resulting tissue block. Sections were obtained at approximately 0.375-mm intervals. At the beginning of each interval, a digital photograph of the tissue block face was acquired to capture the shape of the tissue before any deformations resulting from the sectioning and subsequent immunohistochemical staining. The camera (EOS 550D with EF 100 mm f/2.8 macro lens [Canon] and a Teleplus PRO 300 DG [Kenko]) was mounted onto a tripod standing on the floor close to the cryostat. Severely deformed sections were discarded and replaced by an adjacent section. Furthermore, some additional adjacent sections were obtained at each location for additional stainings. All eventually used sections were at a maximum physical distance of 40 μm from the start of the interval at which the corresponding photograph was taken. The morphologic changes over this short distance were negligible.
Immunohistochemistry
The tissue sections (10 μm) were fixed in acetone (10 min, at room temperature), and endogenous peroxidase was blocked by citrate/phosphate buffer (pH 5.8). Aspecific binding to Fc receptors was blocked with human normal serum. Tissue sections were immunostained for EGFr target expression by ex vivo preincubation with zalutumumab (1 μg/mL, 1 h, room temperature). Ex vivo and in vivo administered zalutumumab was detected with polyclonal rabbit-antihuman IgG (κ) (DAKO) at a concentration of 1 μg/mL (30 min, room temperature). The rabbit antihuman antibodies were subsequently detected with a horseradish peroxidase conjugated goat antirabbit IgG dextran-polymer (Gt-anti-RbIgG-Powervision-horseradish peroxidase; Immunologic). Mouse macrophages were immunostained with rat-antimouse macrophage monoclonal antibody (clone F4/80) at 10 μg/mL (1 h, room temperature), and subsequent incubations were performed with rabbit-antirat-IgG and Gt-anti-RbIgG-Powervision-horseradish peroxidase (Immunologic). The presence of horseradish peroxidase was visualized by adding 3,3′-diaminobenzidine (Sigma-Aldrich) development solution, resulting in brown staining, or by adding amino-ethyl-carbazole development solution, resulting in red staining. Sections were counterstained with hematoxylin (blue nuclear staining), and a coverslip in glycerogel was applied. All immunostained tissue sections were scanned using the Ariol SL-50 system (Leica Microsystems) at low magnification (×4) and at high magnification (×20) for detailed analysis, using the software module “GenSight visual only.”
Construction of 3D Histology Stack
For each tumor, a 3D stack of stained histologic sections was created by first stacking the block-face photographs and then registering each histologic section to its corresponding image in the stack. The stacked block-face images were first aligned by registering each 2D image to its adjacent image using StackReg (29) (version March 2, 2005/TurboReg, version June 19, 2008) allowing only rigid in-plane transformations and in-plane isotropic scaling. In the resulting stack, 4 markers that were fixed with respect to the tissue mounting table were aligned within a maximum deviation of 1 pixel (size, 0.043–0.050 mm isotropic; mean ± SD, 0.046 ± 0.004 mm). All further processing of the block-face photographs as well as the digitized histology images was performed on the intensities in the blue color channel, which showed the largest contrast between various tumor structures for both image types. Each of the digitized stained histology images was registered to its corresponding photograph in the 3D block-face stack by means of Elastix (30) (version 4.5) using an iterative gradient-descent algorithm. An affine transformation model was used for the registration, since the main deformation encountered in the sections was a compression of the tissue along the cutting direction and severely torn or folded sections were discarded during the sectioning. The registration was performed by first manually defining a set of corresponding landmark points at the boundaries of clearly distinguishable structures within the tumor, such as shown in Figures 1A and 1B, and then performing an automatic registration with the similarity measure set to a weighted combination of the Euclidian distance between these points (weight, 0.25) and mutual information between the original images (weight, 0.75). Mutual information was calculated only over the image pixels that contained xenograft tissue, as defined by tumor masks that were manually delineated for each 2D block-face image (Fig. 1C). The resulting registered stained histology images (an example registration is displayed in Fig. 1D) were each assigned a thickness of 0.375 mm and stacked to create the 3D EGFr-stained histology image volumes. Some histology images at the edges of the tissue block were discarded because of a lack of corresponding structures for registration. As a result, the number of usable histology sections was slightly lower than the number of SPECT slices encompassing the tumor (24, 29, and 23 usable consecutive sections versus 28, 30, and 27 slices, respectively).
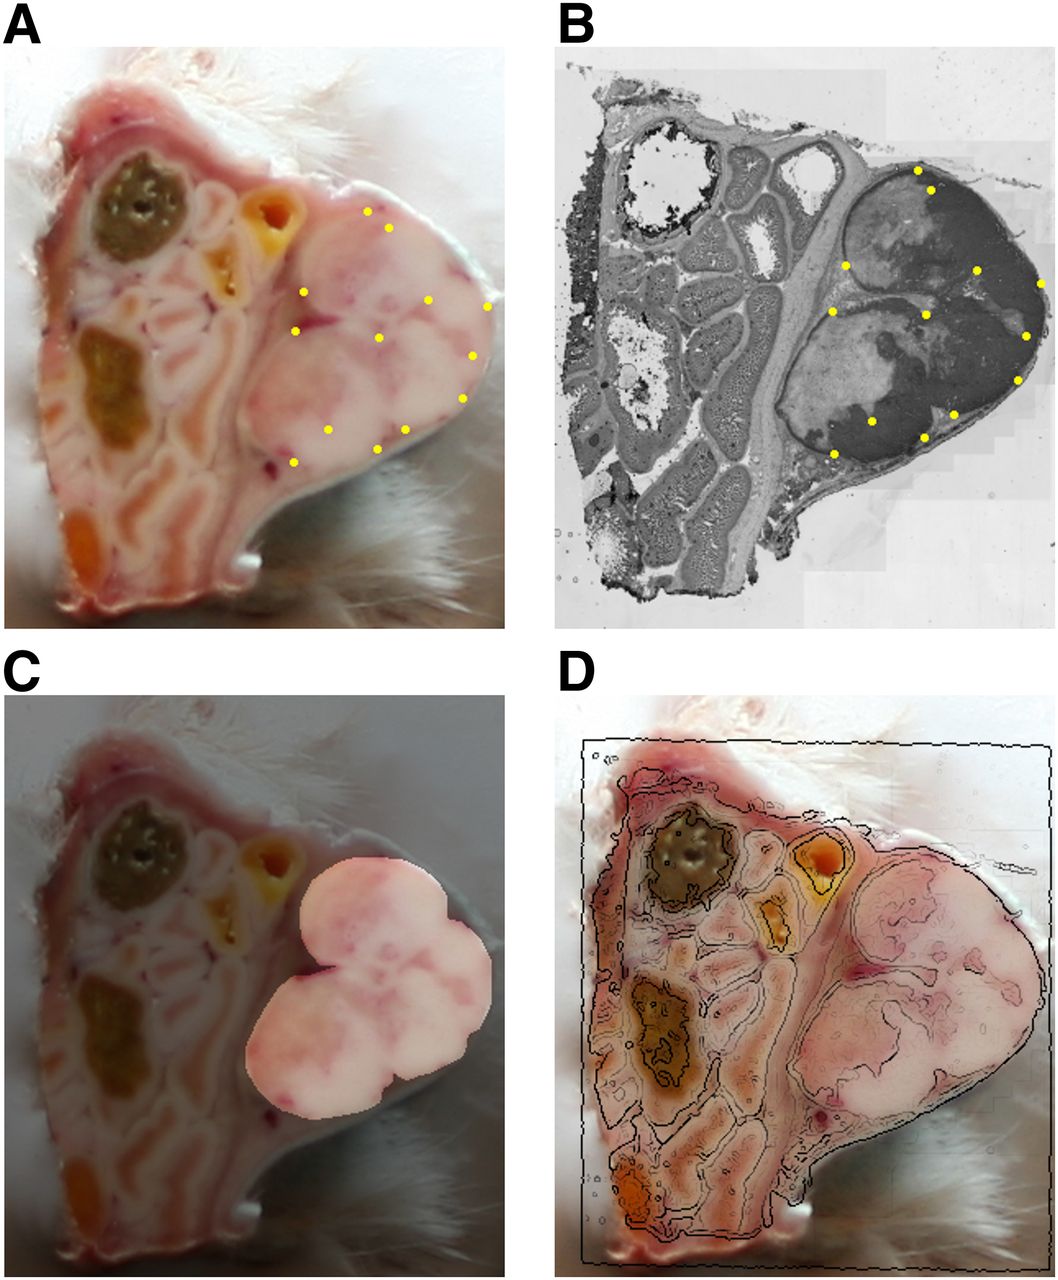
Example in-plane 2D registration of EGFr-stained histology image to corresponding tissue block photograph. (A) Block-face image with yellow dots denoting manually selected landmarks. (B) Blue color channel extracted from original RGB color histology image, with yellow dots denoting points corresponding to landmarks in A and EGFr target expression in dark gray. (C) Tumor mask used during registration and calculation of percentage necrosis. (D) Edges of registered histology image (detected using Canny edge detector) overlaid onto block-face photograph.
Registering SPECT to Histology
The in vivo SPECT image was registered directly to the stained histology stack, without any reference to the block-face photographs used to create the stack. First, the SPECT image was resampled to the voxel grid of the histology stack using trilinear interpolation. Then, the tumor tissue masks that were defined on the 2D block-face images (Fig. 1C) were used to set all nontumor voxels in the histology stack to zero. Finally, the SPECT image was registered to the resulting masked volume by maximizing mutual information by applying Elastix (30), using an iterative gradient-descent algorithm and allowing only rigid 3D transformations.
Image Visualization and Analysis
The total-body and focused SPECT volumes were smoothed using 3D isotropic gaussian postfilters with full widths at half maximum of, respectively, 1.0 and 0.4 mm. To determine the percentage injected dose (%ID) taken up by the tumor and the total body, corresponding 3D regions of interest were drawn manually and their reconstructed voxel intensity sums were related to dose calibrator measurements. Maximum-intensity projections of the total-body SPECT/CT volumes were generated using PMOD (PMOD Technologies). The consecutive histology sections were fused with 0.375-mm-thick slices from the registered focused SPECT volume and compared visually.
To further characterize the agreement between the SPECT and immunohistochemistry image content, we compared slice by slice the percentage of low-activity pixels on SPECT with the percentage of necrotic tissue on immunohistochemistry. The percentage of necrotic tissue was measured by manually segmenting the necrotic regions in the registered full-color EGFr images and dividing the total necrotic area by the area of the corresponding tumor mask (Fig. 1C). To avoid mismatches due to misregistration of the relatively small slices at the beginning and end of each stack, all slices having 0% necrosis were excluded. Low-activity pixels in the SPECT slices were classified by thresholding the reconstructed activity. The resulting low-activity areas divided by the tumor mask areas were then compared with the corresponding fractions of necrotic tissue by calculating the Pearson correlation coefficient for the set of all slices from the 3 mice together. To quantify and visualize the best agreement between SPECT and immunohistochemistry that could be found by thresholding alone, this procedure was repeated for a range of threshold values. Each threshold was absolute and applied to the entire set of all slices from all 3 mice, resulting in 1 correlation coefficient for each threshold. The threshold resulting in the highest correlation coefficient was analyzed for robustness to variation of the threshold. Subsequently, a scatterplot was generated from the data with the highest coefficient, and least squares linear regression was performed.
RESULTS
Total-Body Images
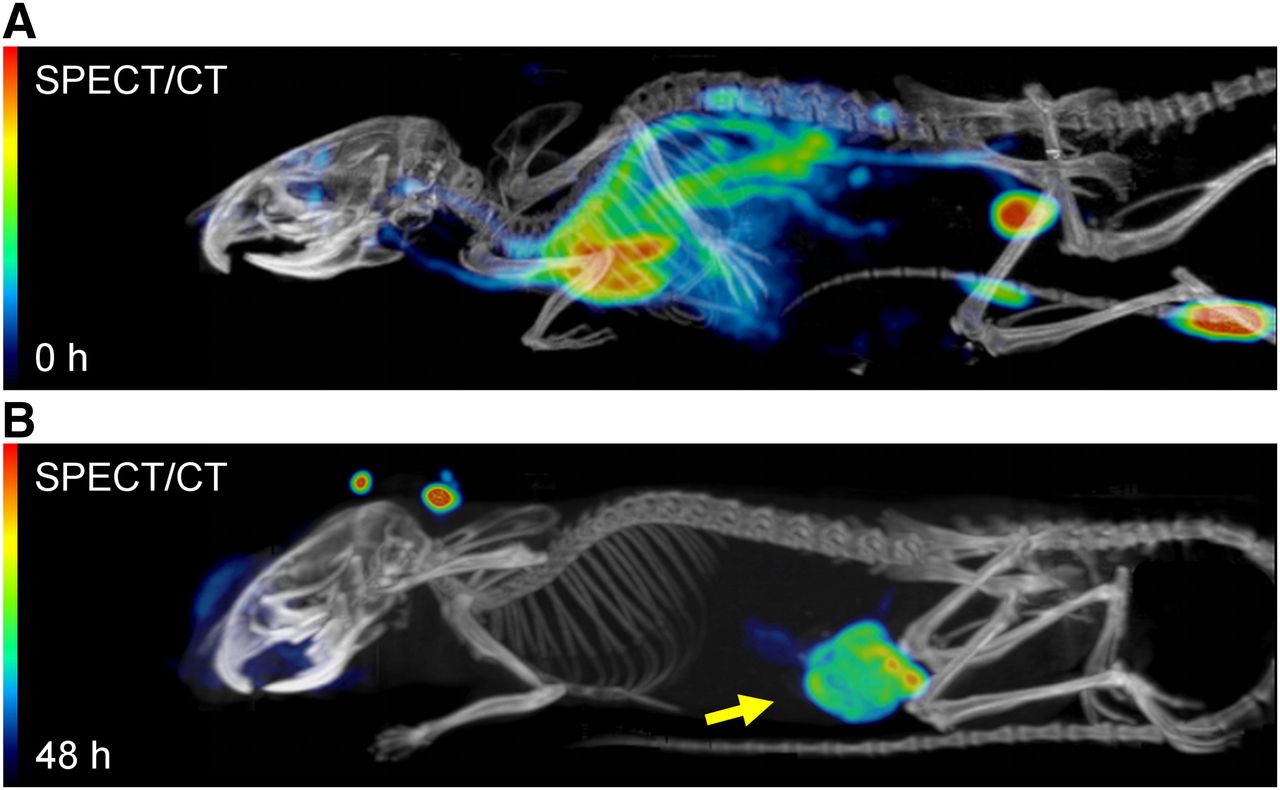
Figure 2 compares the total-body SPECT/CT image obtained from 1 of the 3 mice within 1 h after administration of 111In-labeled zalutumumab (t = 0 h) with the corresponding total-body image obtained 48 h later (t = 48 h). At t = 0 h, the activity was present mainly in the blood vessels, the heart, the bladder, and the injection site. This finding was also observed in the other 2 mice. At t = 48 h, apart from some accumulation in the snout and ears (not encountered in the other 2 mice), the activity was mainly in the tumor. These 2 images demonstrate the anticipated process of specific on-target (EGFr) binding over time.

Total-body fused SPECT/CT maximum-intensity projections showing biodistribution of 111In-labeled zalutumumab directly after injection (A) and 2 d after injection (B). Arrow points to A431 xenograft.
Region-of-interest analysis revealed that at t = 48 h the tumor contained 9.0%–11.4% (mean, 10.5% ± 1.3%) of the total-body activity. Using dose calibrator measurements of the mouse carcasses, we determined that the corresponding absolute activities were 1.40–1.72 MBq (mean, 1.59 ± 0.17 MBq). Correcting for radioactive decay, this is equivalent to 2.35–2.94 MBq (mean, 2.71 ± 0.32 MBq) at the time of injection, constituting 8.2–10.0 %ID (mean, 9.2 ± 0.9 %ID), or 24.8–33.3 %ID/cm3 (mean, 30.1 ± 4.6 %ID/cm3). The mouse shown in Figure 2 corresponds to the tumor shown in Figure 3C.

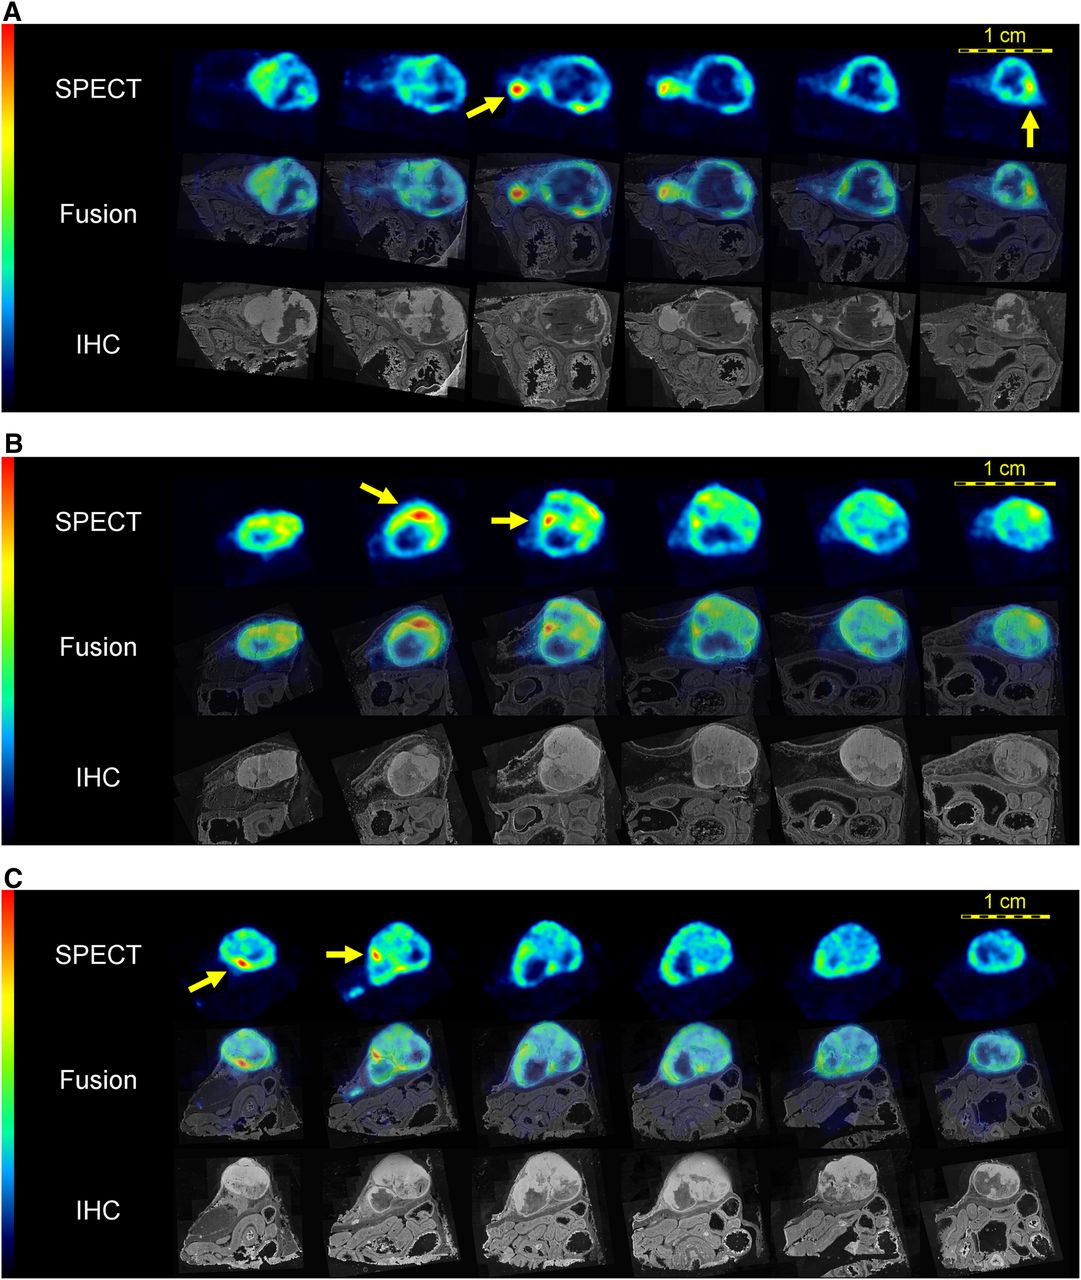
High-resolution in vivo SPECT slices of 111In distribution in A431 xenograft compared with cross-sections through registered 3D immunohistochemistry (IHC) stack. Top rows: equidistant consecutive SPECT slices. Middle rows: SPECT images fused with registered immunohistochemistry slices stained for EGFr expression. Bottom rows: nonfused immunohistochemistry slices. Arrows point to hot spots that seem to be located at outer rim of or outside EGFr regions. Panels A, B, and C show results from mice 1, 2, and 3, respectively.
Focused Tumor SPECT and Histology Images
For each of the 3 mice, a set of equidistant SPECT tumor slices at t = 48 h is displayed in Figure 3, together with corresponding images from the registered histology stacks. The high resolution of the SPECT images enables small substructures within the tumor to be distinguished. Activity was distributed heterogeneously throughout the tumor, exhibiting substantial internal regions containing almost no tracer and some small hot spots with relatively high concentrations. Supplemental Figures 1–3, containing similar sets of consecutive slices from all 3 tumors resliced in 3 orthogonal directions, allow further assessment of the correspondence in 3 dimensions (supplemental materials are available at http://jnm.snmjournals.org).
When the SPECT volume is compared with the EGFr-stained histology volume, many spatially corresponding morphologic details can be identified. In general, most regions of low uptake in the SPECT slices were histologically characterized as necrotic tissue. Interestingly, the coregistration with the histology stack reveals that some spots exhibiting a relatively high 111In concentration on SPECT, such as the ones pointed out by the arrows in Figure 3, are located at the outer rim of the tumor or even outside the highly EGFr-expressing tumor region.
In Figure 4, the correspondence between the percentage of intratumoral low-activity pixels on SPECT and the percentage of necrotic tissue on immunohistochemistry is quantified (estimated concentration corresponding to the applied SPECT threshold, 4.5 MBq/cm3). The scatterplot shows that a high and significant correlation coefficient (r = 0.86, P < 0.0001) could be achieved between regions of low 111In uptake on SPECT and EGFr-negative areas on immunohistochemistry. This coefficient was stable with regard to the chosen threshold: within a margin of 20% (e.g., when raising or lowering the threshold value by 10%) the lowest resulting r was 0.85, and within 30% the lowest r was 0.83. The regression line has a positive slope of 0.645 and a y-intercept close to the origin. When the point clouds of the individual mice are compared, it appears that the points have roughly the same shape as the point cloud from all mice combined—an observation that builds confidence in the reproducibility of these findings.
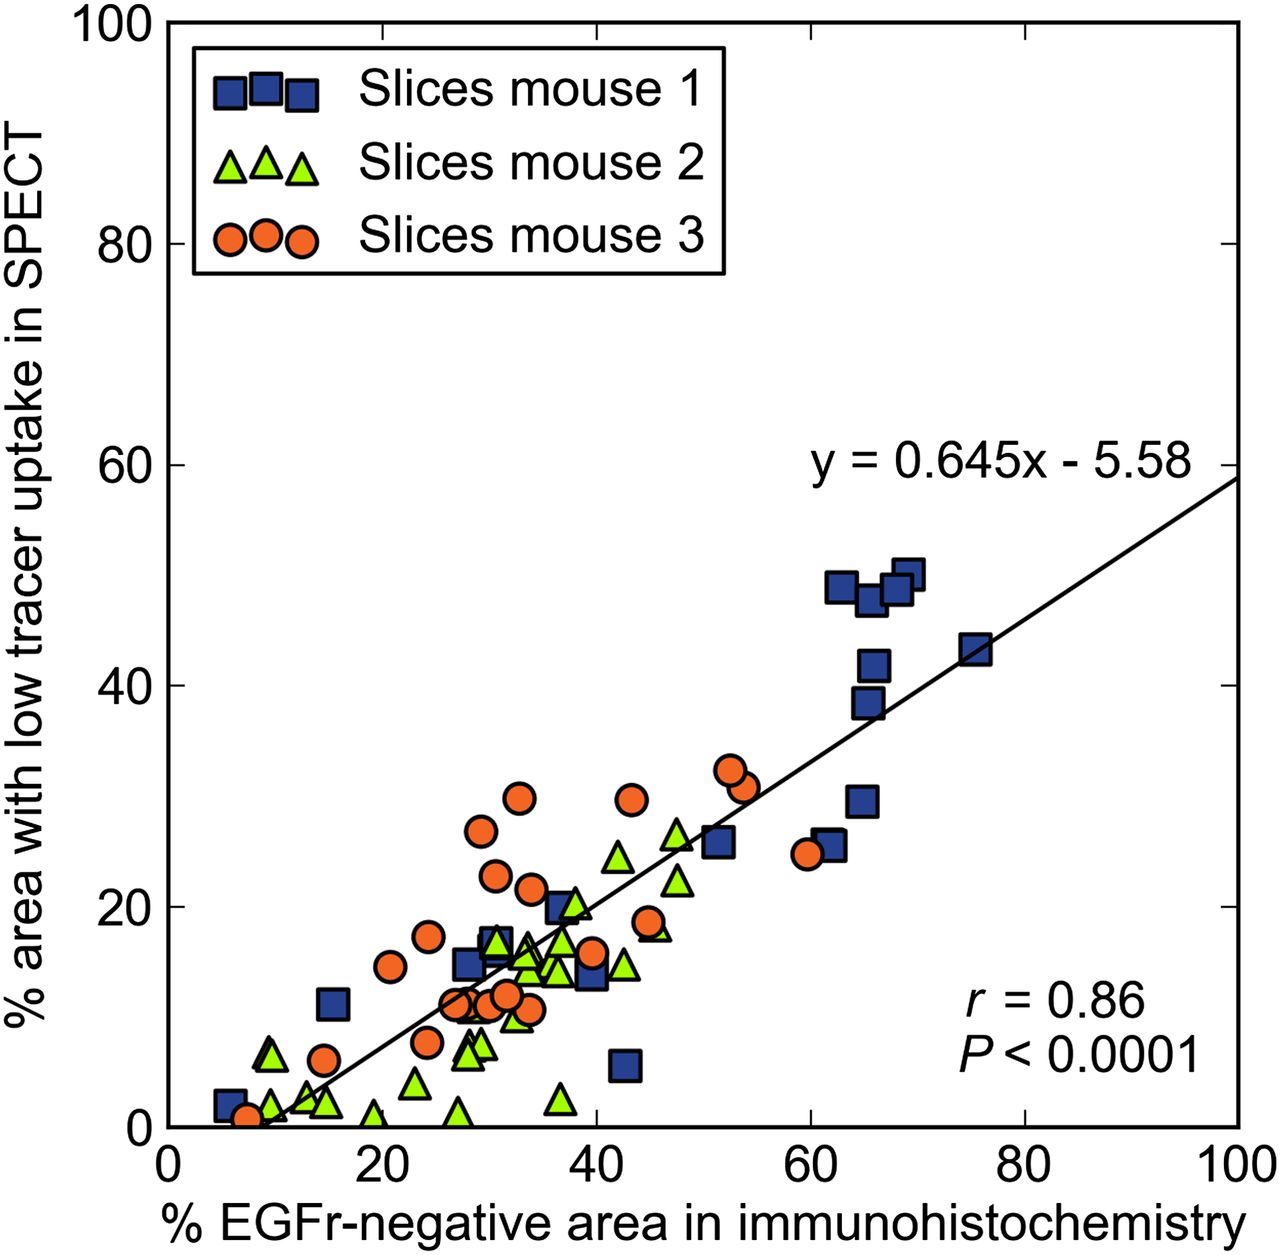
Scatterplot relating EGFr-negative (necrotic) tissue to regions with low SPECT uptake, both quantified as percentage of total slice area.
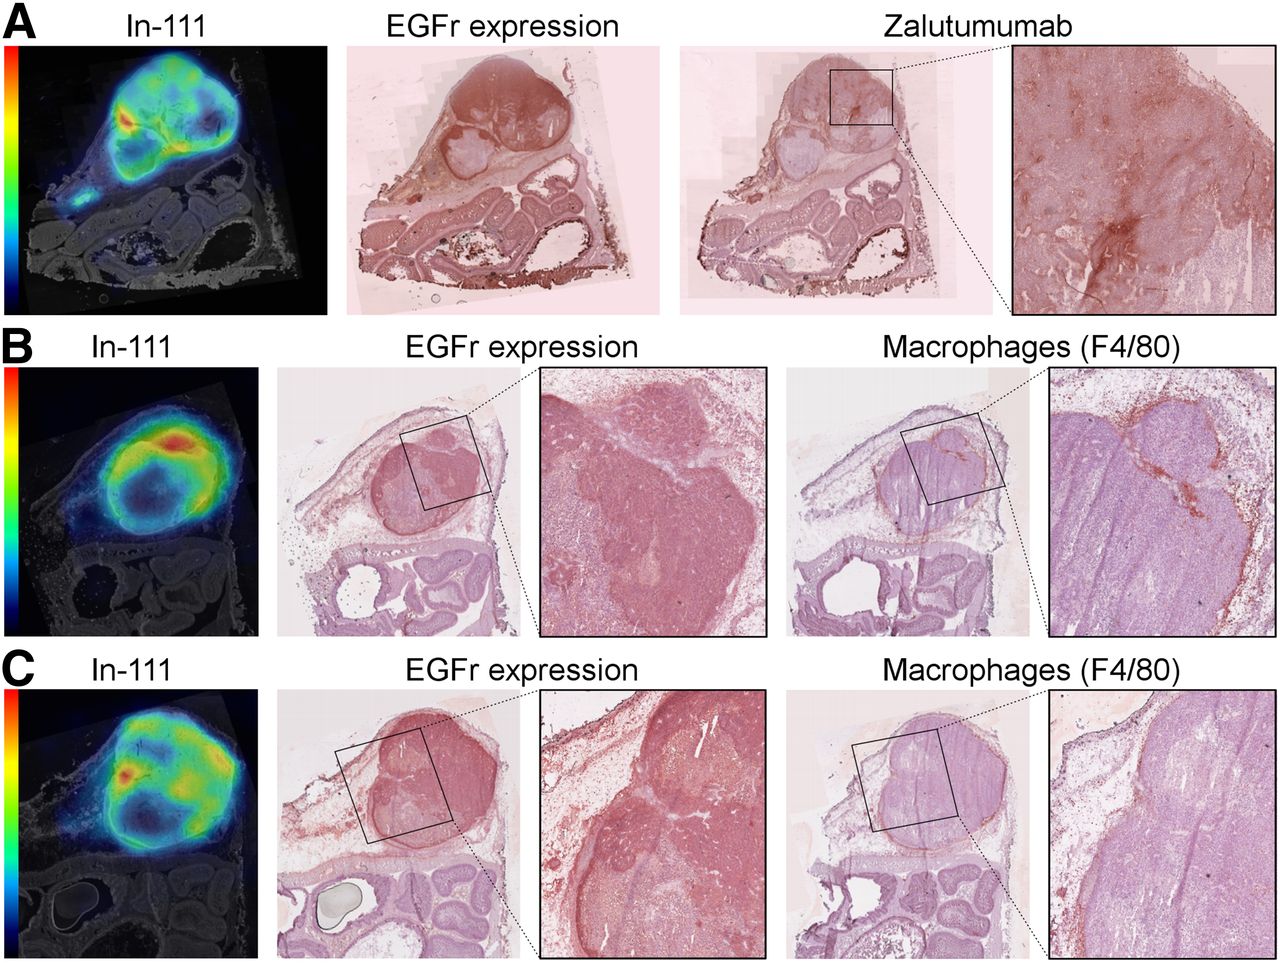
The potential anatomic substrate for the hot spots was further identified by additional immunostaining of adjacent registered sections. Figure 5A shows an immunohistochemistry staining for in vivo–administered zalutumumab. The intratumoral zalutumumab distribution is patchier than the EGFr distribution and also different from the 111In distribution. Both stainings were negative in the necrotic regions and at the site of the hot spot. Examples of immunohistochemistry macrophage stainings are depicted in Figures 5B and 5C. In general, macrophages were located exclusively at the outer rim of the tumor. In the section shown in Figure 5B, we observed many macrophages at the site of the hot spot, suggesting that 111In accumulation may have occurred in these cells. However, this finding was not observed for all hot spots. Figure 5C shows a case in which macrophages were also found at the outer rim of the tumor, but without obvious colocalization with the hot spot.

Expression and distribution of radiolabel (111In), EGFr, antibody (zalutumumab), and macrophages (F4/80). (A) SPECT slice from mouse 3 compared with 2 registered adjacent sections stained for EGFr expression (ex vivo incubation with zalutumumab) and presence of in vivo administered zalutumumab. Arrows point to 111In hot spot in region with neither EGFr uptake nor zalutumumab expression. Magnification shows heterogeneous distribution of zalutumumab. (B) Similar example from mouse 2 in which 111In hot spot was found to coincide with EGFr-positive tumor tissue and macrophages. (C) Similar example from mouse 2, where arrow points to hot spot in EGFr-positive tumor area that does not express macrophages.
DISCUSSION
The results from this study show that within 48 h, 111In-labeled zalutumumab accumulated in a mouse A431 xenograft to such an extent that its in vivo intratumoral distribution could be noninvasively imaged at a high resolution using SPECT. The SPECT images reflect heterogeneous antibody uptake inside the tumor, a finding that was also encountered in studies using 2D autoradiography (31). By 3D coregistration of the focused SPECT tumor image with an entire stack of histologic sections, we found that the reconstructed radioactive tracer distribution showed many morphologic similarities to the EGFr target distribution and that the fraction of EGFr-negative area correlated well with the fraction of area with low 111In uptake. To our knowledge, this is the first time such analyses have successfully been performed at the level of individual SPECT tumor slices.
Tumor regions with virtual absence of EGFr expression were largely necrotic, as could be inferred from impaired cellular integrity observed in hematoxylin-eosin staining. This finding suggests that the low SPECT tracer content in certain parts is not due to poor antibody penetration into the tumor but to the lack of viable EGFr target-expressing tumor cells to which the antibody could bind.
Good correlation coefficients were already found between EGFr-negative and SPECT-negative (low-uptake) areas in different slices by applying only simple thresholding. However, the method needs to be developed further to achieve reliable absolute quantitation of the necrotic area. For example, Figure 4 suggests that even for threshold values around the optimum with respect to correlation, simple thresholding of the SPECT volume may still underestimate the necrotic area by as much as 40%. This underestimation appears to be systematic and most likely results from partial-volume effects due to the limited spatial resolution of the SPECT images. To improve the predictive value of SPECT for EGFr-negative tumor tissue, more advanced segmentation methods may be developed in the future, and newly developed SPECT systems with improved resolution, such as the recently launched U-SPECT+ (32), may further reduce partial-volume effects. Nevertheless, the full 3D analysis of the 3 tumors in this study demonstrates that correspondence of low SPECT activity with necrosis can be reproduced over multiple entire tumor volumes with a simple algorithm. Although Figure 3 displays the full series of equidistant slices only in the transaxial direction, good correspondence was found also for cross-sections in the other 2 orthogonal directions (Supplemental Figs. 1–3).
The applied method of coregistration maps many SPECT patterns onto morphologically similar EGFr patterns, but some 111In hot spots are mapped onto low–EGFr-expressing regions. It is unlikely that this discrepancy reflects registration error or resolution effects, for several reasons. First, the small hot spots in the SPECT images (arrows in Fig. 3) seem to be consistently mapped to morphologic indentations in the EGFr region borders. Second, injected zalutumumab (as determined by immunohistochemistry) was detected only in high–EGFr-expressing regions (Fig. 5A), whereas the 111In distribution completely covered all regions of EGFr expression. The disagreement between the SPECT and injected zalutumumab tissue distributions likely reflects separation of the 111In label from the zalutumumab and a difference in routing on internalization into tumor cells after target binding. Internalized zalutumumab (IgG) will be slowly degraded (9), preventing immunohistochemistry detection at 48 h after injection, whereas 111In is expected to accumulate in the tumor cells since it is known to be a residualizing label (33,34). Because we observed dense populations of macrophages in particular at the rim of the tumor, outside the EGFr area, it could be that some SPECT hot spots resulted from phagocytosed dead tumor cells containing residualized 111In. This possibility could explain the 111In accumulation outside the EGFr-expressing tumor mass shown by some of our data (Fig. 5). However, the fact that not all hot spots coincided with macrophage presence (Fig. 5C) indicates that other mechanisms also may contribute to the final arrangement of the 111In at the time of the SPECT scan.
To investigate such mechanisms, future studies may also require the construction of a registered 3D stack of immunohistochemistry slices. Although the procedure described in this paper resulted in good registration between SPECT (111In) and immunohistochemistry (EGFr target), the method is labor-intensive and depends on the presence of shared morphologic details between the optical photographs, the stained immunohistochemistry tissue sections, and the SPECT image. In addition, the application of only an affine transformation model requires the tissue to be fixated by careful snap-freezing, since chemical fixatives typically introduce substantial and not easily restored heterogeneous deformation of the tissue (35). Furthermore, our method of snap-freezing the entire animal had the practical disadvantage that the tumor could not be separately weighed and measured in a dose calibrator. More research is needed to devise a fully automatic method, which should not only be able to restore tissue processing deformations but also be robust to staining artifacts.
Radionuclide techniques have been successfully applied to discriminate between tumors with different levels of EGFr expression in vivo (16,17,36–38), but some studies report discrepancies between EGFr expression and antibody binding (37,39). Hoeben et al. (16) suggest a possible explanation by presenting evidence from 2D autoradiography showing that high–EGFr-expressing tumors may exhibit subcompartments with low EGFr expression. In this study, we replicated and validated these results in vivo and in 3 dimensions. An additional advantage of SPECT is that the heterogeneity of target receptor distributions and the process of IgG internalization can be monitored in the same animal over time, under non–target-saturating conditions. This 4-dimensional imaging capability may provide new insights into the encountered disparity between EGFr expression and antibody uptake in mouse tumors.
CONCLUSION
This study showed that sub–half-millimeter multipinhole SPECT noninvasively acquires high-resolution 3D in vivo images that allow clear visualization of the heterogeneous distribution of radioactive labeled antibodies in subcompartments of small tumors in mice. The reconstructed SPECT tracer distributions are morphologically similar to those of EGFr expression. However, some apparent differences between the distributions of tracer and EGFr accentuate the fact that the SPECT images show 111In distribution, including both intact labeled antibody and free 111In accumulated after antibody internalization and degradation. By taking into account the heterogeneity of distribution, ultra-high-resolution SPECT permits a better estimation of antibody accumulation and target saturation in vital tumor parts. This ability may prove to be valuable in antibody dose optimization or in assessing the efficacy of antibody constructs. In summary, the focused multipinhole setup with high pinhole magnification provides researchers with a powerful tool to further optimize future anticancer medication.
DISCLOSURE
The costs of publication of this article were defrayed in part by the payment of page charges. Therefore, and solely to indicate this fact, this article is hereby marked “advertisement” in accordance with 18 USC section 1734. No potential conflict of interest relevant to this article was reported.
Acknowledgments
We thank Natalie ter Hoeve (UMC Utrecht) and Mark Begieneman (VUmc) for their help with tissue sectioning.
Footnotes
Published online Mar. 31, 2014.
- © 2014 by the Society of Nuclear Medicine and Molecular Imaging, Inc.
REFERENCES
- Received for publication May 1, 2013.
- Accepted for publication January 27, 2014.


Jump to section
Related Articles
Cited By...
- No citing articles found.