


Abstract
Glomerular filtration rate (GFR) can accurately be determined using 51Cr-ethylenediaminetetraacetic acid (EDTA) plasma clearance counting but is time-consuming and requires technical skills and equipment not always available in imaging departments. 68Ga-EDTA can be readily available using an onsite generator, and PET/CT enables both imaging of renal function and accurate camera-based quantitation of clearance of activity from blood and its appearance in the urine. This study aimed to assess agreement between 68Ga-EDTA GFR (68Ga-GFR) and 51Cr-EDTA GFR (51Cr-GFR), using serial plasma sampling and PET imaging. Methods: 68Ga-EDTA and 51Cr-EDTA were injected concurrently in 31 patients. Dynamic PET/CT encompassing the kidneys was acquired for 10 min followed by 3 sequential 3-min multibed step acquisitions from kidneys to bladder. PET quantification was performed using renal activity at 1–2 min (PETinitial), renal excretion at 2–10 min (PETearly), and, subsequently, urinary excretion into the collecting system and bladder (PETlate). Plasma sampling at 2, 3, and 4 h was performed, with 68Ga followed by 51Cr counting after positron decay. The level of agreement for GFR determination was calculated using a Bland–Altman plot and Pearson correlation coefficient (PCC). Results: 51Cr-GFR ranged from 10 to 220 mL/min (mean, 85 mL/min). There was good agreement between 68Ga-GFR and 51Cr-GFR using serial plasma sampling, with a Bland–Altman bias of −14 ± 20 mL/min and a PCC of 0.94 (95% confidence interval, 0.88–0.97). Of the 3 methods used for camera-based quantification, the strongest correlation was for plasma sampling–derived GFR with PETlate (PCC of 0.90; 95% confidence interval, 0.80–0.95). Conclusion: 68Ga-GFR agreed well with 51Cr-GFR for estimation of GFR using serial plasma counting. PET dynamic imaging provides a method to estimate GFR without plasma sampling, with the additional advantage of enabling renal imaging in a single study. Additional validation in a larger cohort is warranted to further assess utility.
The determination of renal function as measured by glomerular filtration rate (GFR), expressed as the volume of fluid filtered by the renal glomeruli per minute, is utilized for a wide range of clinical decision making. The gold standard method for determining GFR is inulin clearance, but this is expensive, time-consuming, highly dependent on collection accuracy, and not commonly available. 51Cr-ethylenediaminetetraacetic acid (EDTA) blood clearance counting is the most commonly implemented method for accurate estimation of GFR. Disadvantages include a requirement for multiple plasma samples, a significant number of manual laboratory processes, and a well counter, which is not available in many imaging facilities. It is also not possible to image 51Cr-EDTA, negating use for determining split or regional renal function or possible causes of renal impairment.
One method of estimating renal function is the Cockroft and Gault formula, which is based on serum creatinine, weight, and age. Although useful for identifying patients with renal impairment, it is too inaccurate across the full range of GFR for purposes such as determining chemotherapy dosing (1–3). More recently, the Modification of Diet in Renal Disease (MDRD) (4) and the CKD-EPI (Chronic Kidney Disease Epidemiology Collaboration) (5) formulae have been shown to provide more accurate estimations. Radiolabeled 99mTc-diethylenetriaminepentaacetic acid (DTPA), a small organic molecule that is excreted solely by the glomerulus, can also be used for estimation of GFR. This is commonly performed by imaging on a γ camera but is prone to several sources of error, including attenuation of the activity by soft tissue, inaccuracy of using a geometric mean when renal geometry is asymmetric, extracellular localization of DTPA, and a variable degree of protein binding of DTPA.
PET/CT offers accurate camera-based quantification, superior to current γ camera technology (6). Although quantitative SPECT/CT is becoming more widely available, the long acquisition time renders this technology of limited utility for dynamic imaging. The 3-dimensional dynamic capability of PET/CT offers a key benefit over SPECT/CT for applications such as GFR estimation. EDTA can be labeled with 68Ga, a positron-emitting isotope, which can be imaged as first described in 1960 (7,8). In that era, authors described 68Ga-EDTA as having a “low radiation hazard to patient, ease of preparation, constant availability and low cost making this an excellent tracer for clinical imaging” (9). More recently, 55Co-EDTA has been described in an animal study, but this technique has not been translated to human use and is limited by the requirement for a cyclotron (10). Our group demonstrated the excellent imaging characteristics of 68Ga-EDTA as part of a high-throughout dynamic small-animal imaging study (11).
Although 68Ga EDTA imaging has been performed using standalone PET (12), there are no data on the utility of PET/CT imaging for GFR estimation. This study aimed to compare the agreement of GFR estimated from 68Ga-EDTA dynamic PET/CT and plasma sampling to 51Cr-EDTA plasma sampling. As an exploratory endpoint, we also assessed the utility of PET/CT in determining split renal function.
MATERIALS AND METHODS
Patients
This prospective study aimed to recruit a total of 30 patients scheduled to undergo a GFR estimation study with 51Cr-EDTA plasma sampling. The study schema (Fig. 1) was approved by the institutional clinical governance and ethics committee (trial 12613000845730 in the Australian New Zealand Clinical Trials Registry). The study included patients older than 18 y and excluded patients who were pregnant or breast-feeding. The patients were instructed to eat and drink normally before the study.

Study schema.
Radiotracer Production and PET/CT Imaging
68Ga was eluted from a 68Ge/68Ga generator (IDB Holland BV) and purified using a method previously described (13). This eluate was transferred to a SepPak alumina N column (Waters Corp.), washed with 10 mL of distilled water, and eluted with 10 mL of a solution of 0.05 M EDTA in 0.1 M sodium acetate, pH 6. Radiochemical purity was determined with thin-layer chromatography silica gel plates developed in a solvent system of ammonium acetate (1 M):methanol (50:50).
A peripheral intravenous line was inserted in each arm and blood taken to measure serum creatinine. One cannula was utilized for dose administration and the second for taking blood samples. The patient was positioned on the PET/CT camera (Biograph 64 with TrueV; Siemens Medical Systems) with arms raised. The extended axial field of view of 21.6 cm available on this scanner enables simultaneous imaging of both kidneys and inclusion of the cardiac blood pool in approximately half the patients. A scout scan and a low-dose CT scan encompassing the diaphragm to the base of the pelvis were obtained and used to locate the kidneys for the PET acquisition. A median of 56 MBq of 68Ga-EDTA (range, 46–95 MBq) and 2–4 MBq of 51Cr-EDTA were injected intravenously, followed by a 20-mL flush with normal saline. PET imaging over the kidneys was performed for 10 min (dynamic 3-dimensional list mode) and reframed into 20 × 30 s frames. Subsequently, images were acquired from the kidneys to the bladder (3 bed steps, 1 min per bed step) and repeated 3 times in short succession (Supplemental Video 1, showing dynamic acquisition of 68Ga-EDTA PET/CT for estimation of glomerular filtration rate, is available at http://jnm.snmjournals.org). The low-dose CT scan was used for attenuation correction.
GFR Estimation by Plasma Sampling
Injected dose was calculated by assaying the pre- and postinjection syringe in a dose calibrator. Blood samples were taken at 2, 3, and 4 h after injection. Blood was centrifuged at 2,000 rpm for 10–15 min to separate plasma. Two milliliters of plasma were obtained using a pipette. 68Ga counting was performed within 6 h after injection (Biodex 950 well counter; Biodex Medical Systems). 51Cr counting was performed between 8 and 72 h after injection (Wallac Wizard 1470 gamma counter; PerkinElmer). All counts were decay-corrected. 51Cr-EDTA GFR (51Cr-GFR) was calculated with 3 plasma samples using the slope-intercept method as detailed in the British Nuclear Medicine Society guidelines (14). The results were not corrected for body surface area, and Brochner-Mortensen correction was not applied.
GFR Estimation by PET/CT Imaging
For each kidney, a region of interest (ROI) within an isocontour of SUV greater than 4 was calculated to determine activity in the whole of the kidney including cortex and renal pelvis (ROIkidney) (MARVn software, version 2.35; Peter MacCallum Cancer Centre). A second ROI within an isocontour of SUV greater than 12–20 was determined to delineate excreted urine (ROIurine), with operator discretion permitted within this range to adapt the SUV to optimally delineate the structures. These ROIs were calculated for each kidney in each frame, and time–activity curves were produced, with the percentage of the injected dose (%ID) calculated and plotted against time (Fig. 2).
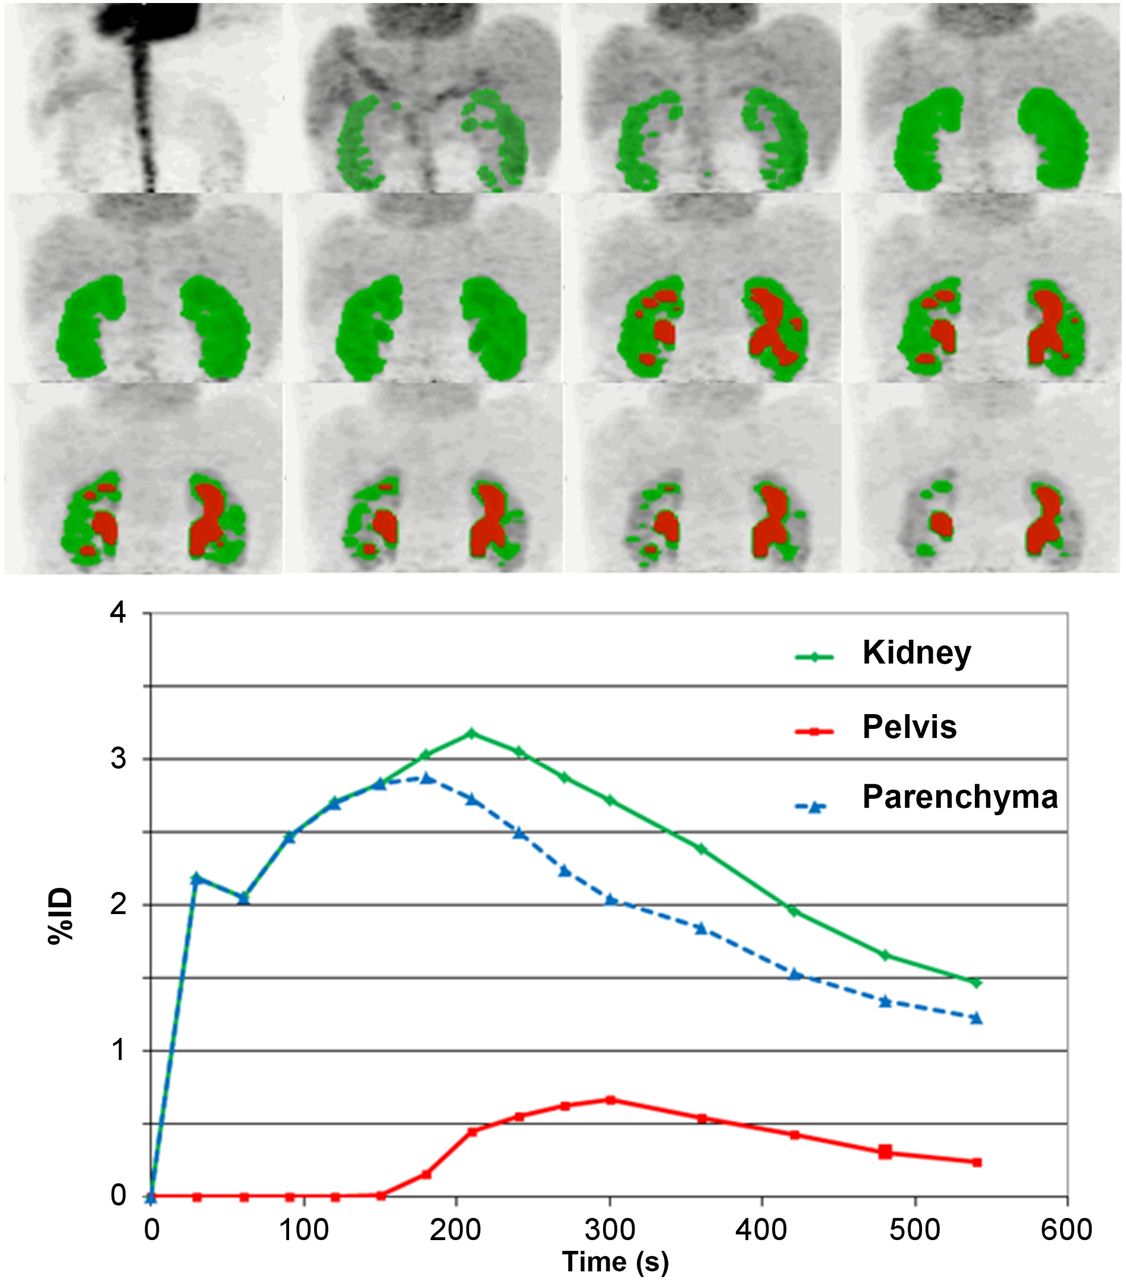
Dynamic PET/CT acquisition between 0 and 10 min showing maximum-intensity projection overlaid with renal activity (green) and excreted activity (red) defined by SUV of >4 and >15, respectively. Time–activity curves were generated.
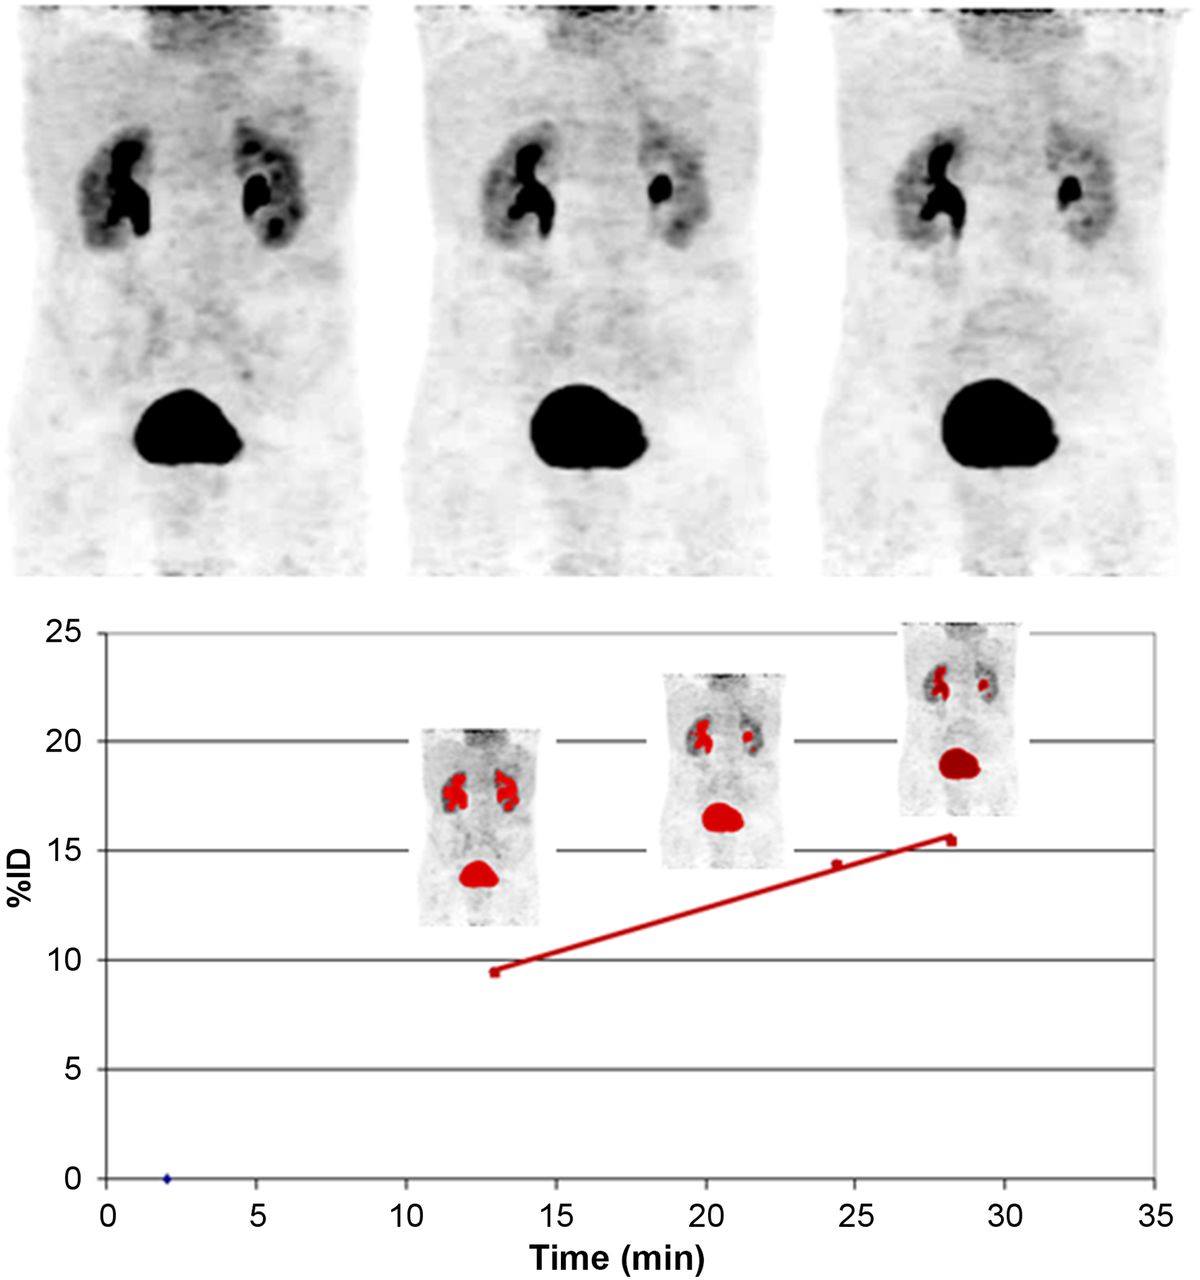
Three methods were used to analyze clearance of 68Ga-EDTA. The first method was renal activity at 1–2 min (PETinitial). The second method was the rate of renal excretion at 2–10 min (PETearly), defined by subtracting ROIurine from whole-kidney activity with the result representing parenchymal activity, expressed as %ID. The slope of an initial linear increase phase of the %ID for each kidney ROIurine was used to represent accumulated excreted urinary activity, usually 3–5 min after administration. Finally, in the third method, the rate of excretion into bladder, ureters, and kidneys during imaging acquired at a later time was calculated (PETlate). %ID accumulated excreted urinary activity during the 3 later time-point images encompassing the kidneys, ureter, and bladder was determined and plotted against time (Fig. 3). %ID at 20 min using the line of best fit of the 3 time points defined PETlate.

Three bed-step sequential acquisitions at later time points encompassing kidneys and bladder. Excreted activity is defined by ROI with SUV > 15 (red).
GFR Estimation by Serum Creatinine and Split Function Calculation
Estimated GFR was calculated using serum creatinine taken just before 68Ga/51Cr-EDTA administration, using the MDRD (4) and the CKD-EPI (5) formulae. Body surface area normalization was removed by multiplying the estimated GFR by calculated body surface area/1.73.
A subset of patients also underwent 99mTc-dimercaptosuccinic acid (DMSA) planar imaging and SPECT/CT performed on a Symbia TruePoint 6 hybrid device (Siemens Medical Solutions). For planar imaging, split function was determined using a manually drawn ROI around each kidney and the geometric mean; for SPECT/CT, a 3-dimensional automated contour with a threshold of 20% of maximum counts was used. For PET/CT, %ID using the first and second methods above was used to determine split function.
Statistics
A Bland–Altman plot (15) was used to determine the level of agreement between 68Ga-EDTA and 51Cr-EDTA plasma sampling, between both of these and estimated GFR, and between split function derived from DMSA SPECT/CT and that derived from planar imaging and PET/CT. The Pearson correlation coefficient (PCC) was also used to correlate these measures in addition to 68Ga-EDTA PET–based image measures of GFR with 68Ga-EDTA. Analysis was performed with Prism, version 6 (GraphPad Software Inc.).
RESULTS
Thirty-one GFR studies were performed in 25 patients. In one episode, imaging failed to include the entire bladder, resulting in inability to perform camera-based GFR estimation. Thus, comparative 68Ga-EDTA and 51Cr-EDTA plasma sampling results were available for 31 patients, whereas PET/CT-based GFR estimation was available for 30 patients. Patient age ranged from 47 to 91 y (median, 75 y). 51Cr-EDTA plasma GFR ranged from 10 to 220 mL/min (mean, 85 ± 48 mL/min). Renal impairment was severe in 2 patients, moderate in 8, and mild in 8, using a 51Cr-GFR of less than 30, 60, and 90 mL/min, respectively, as cut-offs. Thirteen patients had normal renal function. Seventeen studies were performed in patients with neuroendocrine tumors being planned or followed for peptide receptor radionuclide therapy and 14 in patients with renal cell carcinomas being evaluated for surgery or stereotactic radiotherapy to the kidney. The latter group also underwent split renal function estimation before treatment. Four patients had 2 studies and 1 patient had 3 studies to assess effects of intervening therapy, either peptide receptor radionuclide therapy for the neuroendocrine tumor patients or stereotactic radiotherapy for the renal cell carcinoma patients. In these patients, the time between studies ranged from 27 to 338 d (median, 55 d).
Plasma Sampling
There was a near-perfect exponential fit of the 3 plasma samples, with r2 values of 0.98 and 0.99 for 51Cr-GFR and 68Ga-GFR, respectively. There was a strong correlation between 68Ga-GFR and 51Cr-GFR plasma sampling, with a PCC of 0.94 (95% confidence interval [CI], 0.88–0.97) (Fig. 4A). There was good agreement between 68Ga-GFR and 51Cr-GFR plasma sampling, with a Bland–Altman bias for 68Ga-EDTA of −14 ± 20 (Fig. 4B). In patients with a GFR over 150 mL, however, there was significant underestimation of 68Ga-GFR compared with 51Cr-GFR. The high PCC indicates a proportional bias increasing with GFR.

68Ga-GFR vs. 51Cr-GFR by plasma sampling. (A) Correlation of 68Ga-GFR and 51Cr-GFR with PCC. (B) Bland–Altman plot illustrating agreement of 68Ga-GFR with 51Cr-GFR, mean bias (dashed line), 95% CI (dotted line).
Camera-Based Measurement
The strongest correlation was between PETlate and 68Ga-GFR, with a PCC of 0.90 (95% CI, 0.80–0.95) (Fig. 5). For PETearly and PETinitial, the correlation was weaker, with a PCC of 0.81 (95% CI, 0.62–0.90, P = 0.1) and 0.77 (95% CI, 0.56–0.89, P = 0.02), respectively. In one patient, imaging was delayed, enabling calculation of PETlate but not PETearly or PETinitial. Using PETlate, GFR can be derived with the following formula: The correlation between camera-based measurement and 51Cr-GFR was also determined, demonstrating a PCC of 0.88 (95% CI, 0.76–0.94), 0.76 (0.54–0.88), and 0.72 (0.49–0.86) for PETlate, PETearly, and PETinitial, respectively.

Correlation of PET imaging–derived GFR and 68Ga-EDTA by plasma sampling.
Agreement with Estimated GFR
There was good agreement between 68Ga-EDTA and 51Cr-EDTA GFR derived from plasma sampling and estimated GFR, with a Bland–Altman bias of 7 ± 24 and 4 ± 30 for 51Cr-GFR agreement with MDRD-estimated GFR and CKD-EPI, respectively, compared with −6 ± 14 and 18 ± 20 for 68Ga-GFR.
Split Function
In 11 studies, DMSA planar imaging and SPECT/CT were also performed for evaluation of split renal function before stereotactic radiotherapy for known renal cell carcinomas. There was good agreement between planar imaging and SPECT/CT, with a Bland–Altman bias for left-to-right split function of −1% ± 5 (95% CI, −9%–12%), but in 2 patients DMSA planar imaging differed by more than 10%. Both had severe renal dysfunction, with overlying hepatic activity contributing counts to the right kidney on planar imaging. The Bland–Altman bias for agreement between 68Ga-EDTA PET/CT and DMSA SPECT/CT was 3% ± 7 (95% CI, −11%–17%). In 5 patients there was more than a 10% difference between PET/CT and SPECT/CT.
DISCUSSION
51Cr-EDTA has been considered the radionuclide agent of choice for measuring GFR because its clearance is similar to that of inulin, with the first published use in humans being in 1967 (16,17). A single-sample technique can be used (18), although use of 2 or 3 blood samples increases accuracy and is recommended for patients with significant renal dysfunction (19,20). 51Cr-EDTA is not available in many countries, and the need for simplification has led some to adopt γ-camera GFR estimation with 99mTc-DTPA planar imaging, which is prone to error (21). In particular, calculation of renal activity for imaging-based approaches requires calculation of an estimate of renal depth to correct for tissue attenuation but has limited accuracy. PET/CT offers numerous advantages, including rapid and accurate 3-dimensional quantitative capability. 68Ga is increasingly available because of its use for somatostatin-receptor imaging (22) and is becoming more widely available through on-site generators, which have a shelf life of up to 9–12 mo. 68Ga-EDTA preparation is straightforward and potentially provides a cost-effective alternative to plasma sampling.
In this study, there was good but not perfect agreement between 68Ga- and 51Cr-EDTA GFR calculated using plasma sampling, despite injection of both radiotracers simultaneously and use of the same samples for positron and γ counting. In particular, in patients with a 51Cr-EDTA GFR of more than 150 mL/min, the 68Ga-GFR was significantly lower. Within the high reference range, however, agreement is less important because management is unlikely to be altered. The reason for this discordance is unclear but may be due to differences in plasma binding, tubular secretion, or dissociation in vivo. A recent study confirmed high labeling efficacy and low red blood cell or protein binding of 68Ga-EDTA (23).
Studies have demonstrated that 51Cr-EDTA systemically overestimates GFR by approximately 10% using the single-exponential method, and this overestimation is more marked at high GFRs (24,25). A post hoc analysis after Brochner-Mortensen correction (26) of the 51Cr-GFR demonstrated stronger agreement and correlation with 68Ga-GFR, with a Bland–Altman bias of −1.3 (SD, 11; 95% CI, −23 to 20) and a PCC of 0.95. Our current study showed that both 68Ga-GFR and 51Cr-GFR agreed well with GFR estimated by MDRD or CKD-EPI.
Although plasma clearance provides a reliable estimate of renal clearance, measuring urine clearance is more direct and therefore less subject to nonrenal variations or the limitations posed by low activity in blood at late time-points. PET provides the ability to noninvasively quantify regional activity in MBq/mL with near-perfect agreement with known concentrations of activities in phantom experiments (27). The accurate and dynamic ability of PET to quantify activity in 3 dimensions makes it ideal for applications such as GFR estimation. Current camera-based quantification of GFR relies largely on using early renal cortical uptake as described by Gates (28). In this study, we have found that measurement of activity that has actually filtered into the collecting system can readily be quantified, providing a more direct means of estimating GFR. In this study, this was limited by estimating GFR at an early time point when the radiopharmaceutical is more subject to nonrenal variations. Nevertheless, our results show good agreement with plasma-based sampling at 2–4 h, particularly in patients with impaired GFR.
In our facility, a tertiary cancer center, common clinical indications for measuring GFR include dose adjustment for kidney-excreted chemotherapy agents such as carboplatin (1), determination of overall and split renal function before abdominal radiotherapy (29), and monitoring of renal function during radionuclide therapy if the agent is excreted by the kidneys (30). Many patients undergo both a 51Cr-EDTA and a 99mTc-DTPA or 99mTc-DMSA study to determine split renal function. This study also demonstrated the potential of 68Ga-EDTA PET/CT to assess both overall and differential or regional renal function, although further research is needed to validate this possibility. 68Ga-EDTA PET/CT also has the potential to replace 99mTc-DTPA renography, including for evaluation of renal tract obstruction given its 3-dimensional dynamic capability, although MAG-3 remains the agent of choice as it is predominantly secreted (31). The short half-life of 68Ga also makes it ideal for renography before and after angiotensin-converting enzyme inhibition to assess for hemodynamically significant renal artery stenosis (32).
This study was limited by a relatively small cohort of patients who were elderly and had concomitant malignancy. The field of view of a PET camera does not enable the kidneys, ureters, and bladder to be encompassed in a single field of view. Because urine excretion and transit occur, some of the activity passing from kidneys to bladder during the 3-min imaging time might therefore have been double-counted; the resultant error was considered small and minimized as the same methodology was used at all 3 delayed time-points. The study was strengthened by including patients with a broad range of GFR, including normal, mild, moderate, and severe renal dysfunction. Further optimization, including both image acquisition and processing technique, may improve results. The effective radiation dose from the 68Ga-EDTA study is approximately 1.2 mSv from the PET component (33) and 0.25 mSv from ultra low dose CT used for attenuation correction.
CONCLUSION
Assessment of GFR with 68Ga-EDTA is feasible, with good agreement between plasma sampling and conventional 51Cr-EDTA. Camera-based GFR estimation correlates strongly with the plasma sampling technique, enabling noninvasive and rapid GFR estimation. The ability to image EDTA with PET/CT also provides additional information and may improve diagnostic algorithms in a range of renal diseases. Additional validation in a larger cohort is warranted to further assess utility.
Acknowledgments
Preliminary data from this study were presented orally at the 2013 annual meeting of the Society of Nuclear Medicine and Molecular Imaging, Vancouver, BC, Canada. Final data were presented orally at the 2014 annual meeting of the World Federation in Nuclear Medicine and Biology, Cancun, Mexico
Footnotes
Published online Feb. 12, 2015.
- © 2015 by the Society of Nuclear Medicine and Molecular Imaging, Inc.
REFERENCES
- Received for publication August 31, 2014.
- Accepted for publication December 26, 2014.


Jump to section
Related Articles
Cited By...
- Functional Renal Imaging with 2-Deoxy-2-18F-Fluorosorbitol PET in Rat Models of Renal Disorders
- Initial Preclinical Evaluation of 18F-Fluorodeoxysorbitol PET as a Novel Functional Renal Imaging Agent
- A PET Tracer for Renal Organic Cation Transporters, 11C-Metformin: Radiosynthesis and Preclinical Proof-of-Concept Studies