


Abstract
In PET studies of patients with Alzheimer disease (AD), prominent hypometabolism can occur in brain regions without major amyloid load. These hypometabolism-only (HO) areas may not be explained easily as a consequence of local amyloid toxicity. The aim of this longitudinal multimodal imaging study was the investigation of locoregional and remote relationships between metabolism in HO areas and longitudinal amyloid increase in functionally connected brain areas, with a particular focus on intrinsic functional connectivity as a relevant linking mechanism between pathology and dysfunction. Methods: Fifteen AD patients underwent longitudinal examinations with 11C-Pittsburgh compound B (11C-PiB) and 18F-FDG PET (mean follow-up period, 2 y). The peak HO region was identified by the subtraction of equally thresholded statistical T maps (hypometabolism minus amyloid burden), resulting from voxel-based statistical parametric mapping group comparisons between the AD patients and 15 healthy controls. Then functionally connected and nonconnected brain networks were identified by means of seed-based intrinsic functional connectivity analysis of the resting-state functional MRI data of healthy controls. Finally, network-based, region-of-interest–based, and voxel-based correlations were calculated between longitudinal changes of normalized 11C-PiB binding and 18F-FDG metabolism. Results: Positive voxel-based and region-of-interest–based correlations were demonstrated between longitudinal 11C-PiB increases in the HO-connected network, encompassing bilateral temporoparietal and frontal brain regions, and metabolic changes in the peak HO region as well as locoregionally within several AD-typical brain regions. Conclusion: Our results indicate that in AD amyloid accumulation in remote but functionally connected brain regions may significantly contribute to longitudinally evolving hypometabolism in brain regions not strongly affected by local amyloid pathology, supporting the amyloid- and network-degeneration hypothesis.
Alzheimer disease (AD) is a progressive neurodegenerative disorder (1). Current hypotheses about the pathogenesis assume that the aggregation of β-amyloid peptides plays an important role and represents an early event of this disease by leading to synaptic dysfunction and synaptic loss, finally causing neuronal cell death and cognitive decline (2,3). The understanding of causal relations and chronologic sequences of amyloid deposition and neuronal dysfunction in the development of AD is important for the classification of disease severity and for the evaluation of new treatment approaches. The current study aims at such sequences of patterns of both amyloid plaque deposition and neural dysfunction, with particular focus on intrinsic functional connectivity as a relevant linking mechanism between pathology and dysfunction.
With noninvasive PET biomarkers, such as Pittsburgh compound B (11C-PiB) and 18F-FDG, AD-related pathologies, namely fibrillary amyloid burden and hypometabolism, as well as their longitudinal alterations and associations can be investigated in vivo. Compared with healthy subjects, AD patients show specific patterns of reduced 18F-FDG metabolism, as a measure for neuronal dysfunction (4), and increased amyloid deposition (5–7), which are highly overlapping especially in the posterior cingulate cortex (PCC) and parietal and temporal cortical areas (8).
Beyond these commonalities, also discrepancies between the patterns of amyloid-pathology and hypometabolism can be identified in patients with AD and mild cognitive impairment (MCI), for example, brain regions harboring amyloid burden but normal metabolism and hypometabolic areas without major amyloid deposition (8–10). The absence of hypometabolism in brain areas showing amyloid deposition might be explained by the temporal delay to which hypometabolism follows amyloid deposition. Indeed, a recently published longitudinal study in mildly affected AD patients demonstrated that the pattern of hypometabolism roughly followed the baseline pattern of amyloid deposition during an observation period of 2 y (10). However, the development of hypometabolism in AD is most probably more a mixture of phenomena and cannot completely be explained by local amyloid toxicity. Different pathologic processes, such as tau pathology or oxidative stress, may also contribute to the development of neuronal dysfunction (11,12). In the context of a linking mechanism between AD pathologies and neuronal dysfunction, intrinsic functional connectivity has been proposed (13), which is measureable by means of resting-state functional MRI (rs-fMRI). With this method, correlations between spontaneous low-frequency activity fluctuations in the blood-oxygen-level-dependent (BOLD) signal can be measured to identify synchronously active brain regions. This synchronicity indicates a functional interaction and neuronal communication between these regions (14), which is also related to structural connectivity (15).
By combining rs-fMRI with PET, relations between distribution patterns and quantitative interrelations of AD pathologies within the structure of intrinsic connectivity networks (ICNs) can be investigated. Indeed, a strong regional overlap between the typical patterns of PET-assessed amyloid deposition and hypometabolism and the patterns of ICNs has already been demonstrated in AD patients. These overlaps were found especially for the default mode network (13,16), one of the most prominent and consistent ICNs associated with the processing of internally focused tasks (17), as well as also for other frontoparietal ICNs (18). Importantly, it also has been demonstrated that AD and MCI patients show disruptions of functional and structural connectivity within ICNs (19,20) and that even elderly nondemented 11C-PiB–positive subjects show associations between hypometabolism, 11C-PiB-uptake, and connectivity disruption (21,22).
We hypothesized that hypometabolism in brain regions not strongly affected by local amyloid deposition may be related to longitudinal increases in amyloid deposition in remote but functionally connected brain areas. We assume that an increase of toxic amyloid may contribute to local synaptic dysfunction, leading to reduced neuronal activity and disruption of connectivity. Reduced neuronal activity and disruption of connectivity may lead to a progressively diminished communication within connected brain areas, measurable as hypometabolism there in the absence of prominent local amyloid deposition. The longitudinal measurement of amyloid deposition and hypometabolism was obtained by baseline and follow-up (FU) 18F-FDG and 11C-PIB PET imaging during a 2-y time period in a sample of mildly affected AD patients. For measurement of ICNs, rs-fMRI data from elderly healthy controls were obtained at a single time point.
MATERIALS AND METHODS
Participants
Similar to a recently published study (23), 15 right-handed patients with an initial diagnosis of mild probable AD, recruited from the outpatient unit for cognitive disorders (Department of Psychiatry and Psychotherapy, Technische Universität München), underwent baseline and FU examinations with 18F-FDG PET, 11C-PIB PET, and structural T1-weighted MR imaging with a mean FU period of 27.8 ± 3.57 mo. Patients received assessment of apolipoprotein E (APOE) genotype and a standard battery of neuropsychologic tests twice, including the Mini-Mental State Examination (MMSE) (24) and the Clinical Dementia Rating (CDR) scale (25). Fifteen right-handed, cognitively normal (HC1) subjects, recruited by advertisement, served as the control group and underwent the identical testing and imaging procedures once.
For the analysis of physiologic rs-ICNs, we used and analyzed the dataset of a preexisting population of 17 right-handed cognitively normal elderly (HC2) subjects, who underwent an examination with rs-fMRI and structural MR imaging once (Table 1). Before attending, all participants provided written informed consent regarding the scientific evaluation of their data, which was approved by the ethics committee of Technische Universität München and the German radiation protection authority.
Subjects’ Characteristics
Imaging Procedures
PET Data Acquisition and Analysis
Each AD patient underwent baseline and FU 18F-FDG and 11C-PiB PET imaging, whereas HC1 subjects were examined once. PET and MR data were acquired and processed using the same tracer-specific protocols and preprocessing steps as published previously (5,10). The methodology of scanner details, PET data evaluation, normalization, statistical group comparisons, and correction for potential influence of regional cortical atrophy are described in the supplemental data (supplemental materials are available at http://jnm.snmjournals.org). For the identification of brain regions showing significant hypometabolism without local amyloid deposition in AD patients relative to HC1 subjects, the resulting T maps from the statistical parametric mapping 5 (SPM5) group comparisons of 18F-FDG and 11C-PiB PET data at FU were overlaid and subtracted using MRIcron (www.sph.sc.edu/comd/rorden/mricron/). We describe the identical method in more detail in a recently published study (23). The identified hypometabolism-only (HO) area was used as a seed region for the calculation of an intrinsic functional connectivity network (HO-ICN) in HC2 subjects. To ensure that hypometabolism in the HO area occurred still without colocalization of amyloid deposits in AD patients, we used the FU PET T maps for identification.
To quantify longitudinal annual amyloid changes over the observation period, 11C-PiB annual rate of change (ARC) images were created for every AD patient in analogy to a procedure previously described by Villain et al. (26), using the formula FU 11C-PiB scan minus baseline 11C-PiB scan divided by FU duration in years.
These ARC images are supposed to represent differences of amyloid accumulation over time and were used for further analyses. A detailed description is given in the supplemental data.
rs-fMRI Data Acquisition and Analysis
For analysis of intrinsic functional connectivity in HC2 subjects, MR imaging was performed using the same protocols as published previously (23). Scanner details, acquisition parameters, preprocessing, and analytic steps are described in the supplemental data. To identify the ICN of the HO seed in HC2 subjects, group analyses were performed using the same statistical thresholds as for PET analyses.
Cross-Modality Analyses
For evaluation of regional and quantitative associations between metabolism and amyloid deposition over time in AD patients, ROI-based and voxelwise correlations between 18F-FDG and 11C-PiB annual changes were calculated. To assess baseline and FU 18F-FDG uptake in specific brain regions in AD patients quantitatively, standardized uptake value ratios (SUVRs) were calculated using the vermis as a reference region. In the same manner as for 11C-PiB, annual changes in 18F-FDG uptake in every patient were calculated using the formula FU 18F-FDG SUVR minus baseline 18F-FDG SUVR divided by FU duration in years.
To ensure comparability between the different PET imaging techniques, the coregistered and spatially normalized 18F-FDG images were processed in the same way as the 11C-PiB ARC images. Longitudinal 11C-PiB uptake values for specific brain regions were extracted from the 11C-PiB ARC images. Correlations were calculated between annual changes in 18F-FDG uptake in the HO area and changes in 11C-PiB uptake in the HO-ICN as well as locoregionally within AD-typical brain areas.
Whole-Brain Voxelwise Regression and Correlations Between HO Area and HO-ICN
For the assessment of quantitative interrelations, region-of-interest–based Pearson correlation coefficients were calculated between longitudinal SUVR changes in 18F-FDG metabolism in the HO area and in 11C-PiB uptake within the HO-ICN in AD patients (significance level of P < 0.05 [2-tailed]). To avoid autocorrelation, an area with a 20-mm radius around the HO seed was subtracted from the templates. To examine interrelations between local metabolism in the HO area and longitudinal amyloid increases over time within the whole brain, voxelwise correlations across AD patients were calculated between mean FU 18F-FDG SUVR in the HO seed, regarded as a covariate, and longitudinal 11C-PiB changes (ARC images) using the multiple-regression-analysis design in SPM5. By this additional analysis, the ROI-based regional correlations between metabolism in the HO seed and longitudinal 11C-PiB changes should be verified using an independent methodology looking for correlations in the whole brain. For these confirmatory analyses, we allowed SPM T maps to be displayed with a liberal threshold of P less than 0.05 uncorrected and a minimum spatial extent of 20 contiguous voxels. The resulting correlation map was overlapped with the HO CN to identify intrinsically connected brain regions in which amyloid changes show strong associations with metabolism in the HO seed.
To countercheck our hypothesis, we calculated ROI-based correlations between longitudinal changes in metabolism in the HO seed and changes in 11C-PiB uptake within a composite ROI, consisting of bihemispheric neocortical brain areas outside the HO-ICN and within the cerebellar vermis, a brain region typically showing none of the investigated pathologies in sporadic AD. This ROI was created with MRIcron by subtracting the HO-ICN ROI from an anatomic automatic labeling–based whole-brain template (WFU_pickatlas) (27).
Correlations Within AD-Typical Brain Areas
ROI-based correlations between longitudinal SUVR changes in metabolism and in 11C-PiB uptake were calculated locoregionally within brain areas typically affected by AD pathologies. For this purpose, the PCC, precuneus, and whole HO-ICN, including several AD-typical brain regions, were selected. An overview of the study design is illustrated in Figure 1.
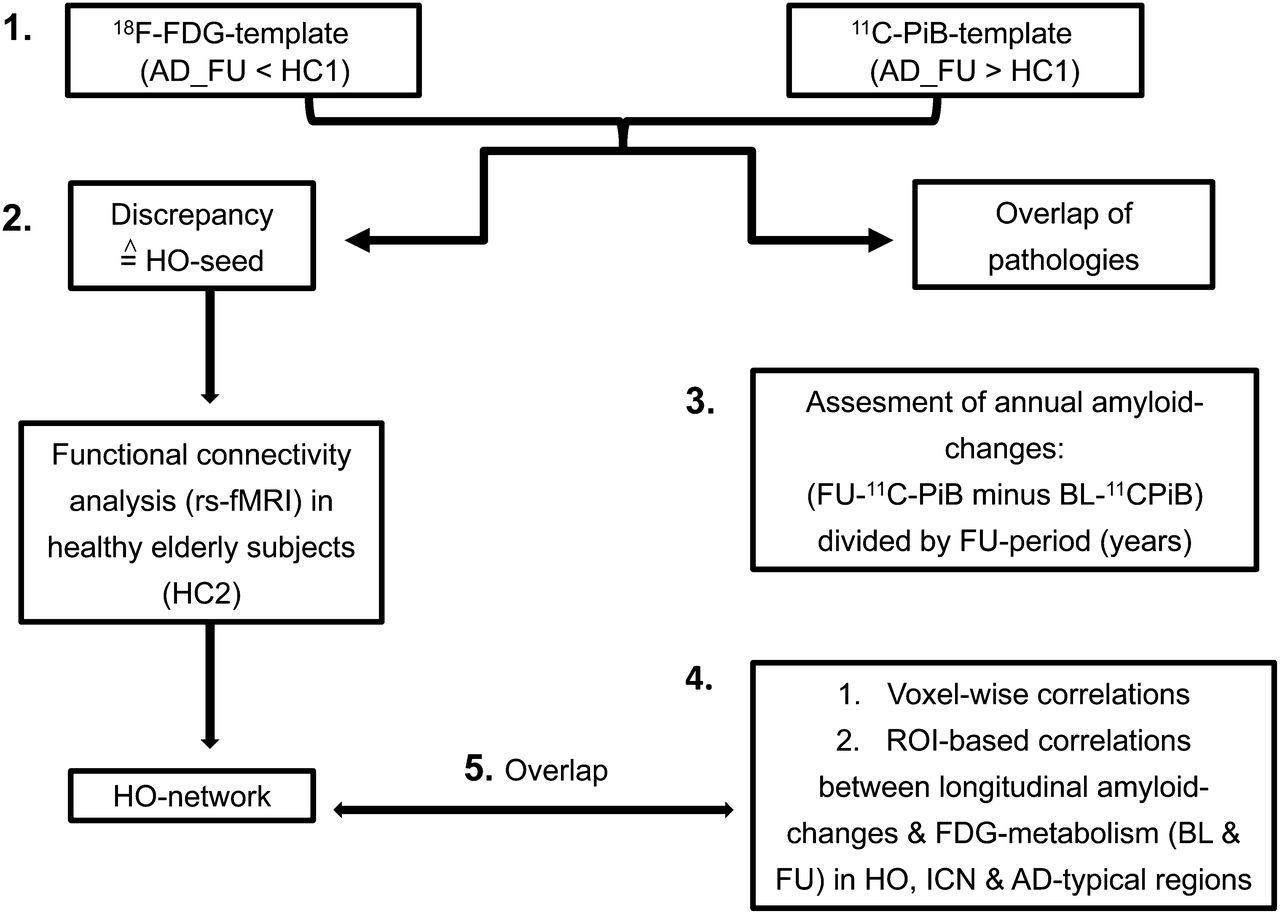
1. First, FU patterns of 18F-FDG hypometabolism and 11C-PiB uptake of AD patients (compared with HC1) were matched and subtracted to identify regional overlap and discrepancies. 2. Region showing distinct hypometabolism without amyloid pathology (HO area) was used as seed region for ROI-based functional connectivity analysis in rs-fMRI dataset of HC2. 3. For assessment of annual changes of amyloid accumulation, 11C-PiB difference images were created using formula FU PiB minus baseline PiB divided by FU duration in years. 4. ROI-based and voxelwise correlations were calculated between longitudinal amyloid changes and 18F-FDG metabolism in HO area, HO-ICN, and in AD-typical brain areas. 5. To identify intrinsically connected brain regions in which longitudinal amyloid changes show strong associations with metabolism in HO seed, resulting correlation map was overlapped with HO-ICN.
RESULTS
In AD patients, mean baseline and FU MMSE scores were significantly lower and CDR scores significantly higher than in HC1 and HC2 subjects (P < 0.001). Longitudinal comparison of MMSE scores in AD patients revealed a significant decrease (P = 0.001). There were no significant differences regarding age, sex distribution, and APOE genotype between AD patients and HC1 or HC2 subjects (Table 1).
11C-PiB, 18F-FDG PET, and Functional Connectivity Analyses
Consistent with the initial clinical diagnosis of mild probable AD, already at baseline all single patients showed typical patterns of hypometabolism and amyloid deposition, whereas HC1 subjects showed normal cerebral 18F-FDG–assessed metabolism and no prominent 11C-PiB binding. The voxel-based group comparisons revealed typical patterns of hypometabolism and 11C-PiB uptake in AD patients (baseline and FU), with a distinct, regional spread for hypometabolism and a minor spread for amyloid deposition when baseline and FU were compared (Supplemental Fig. 1).
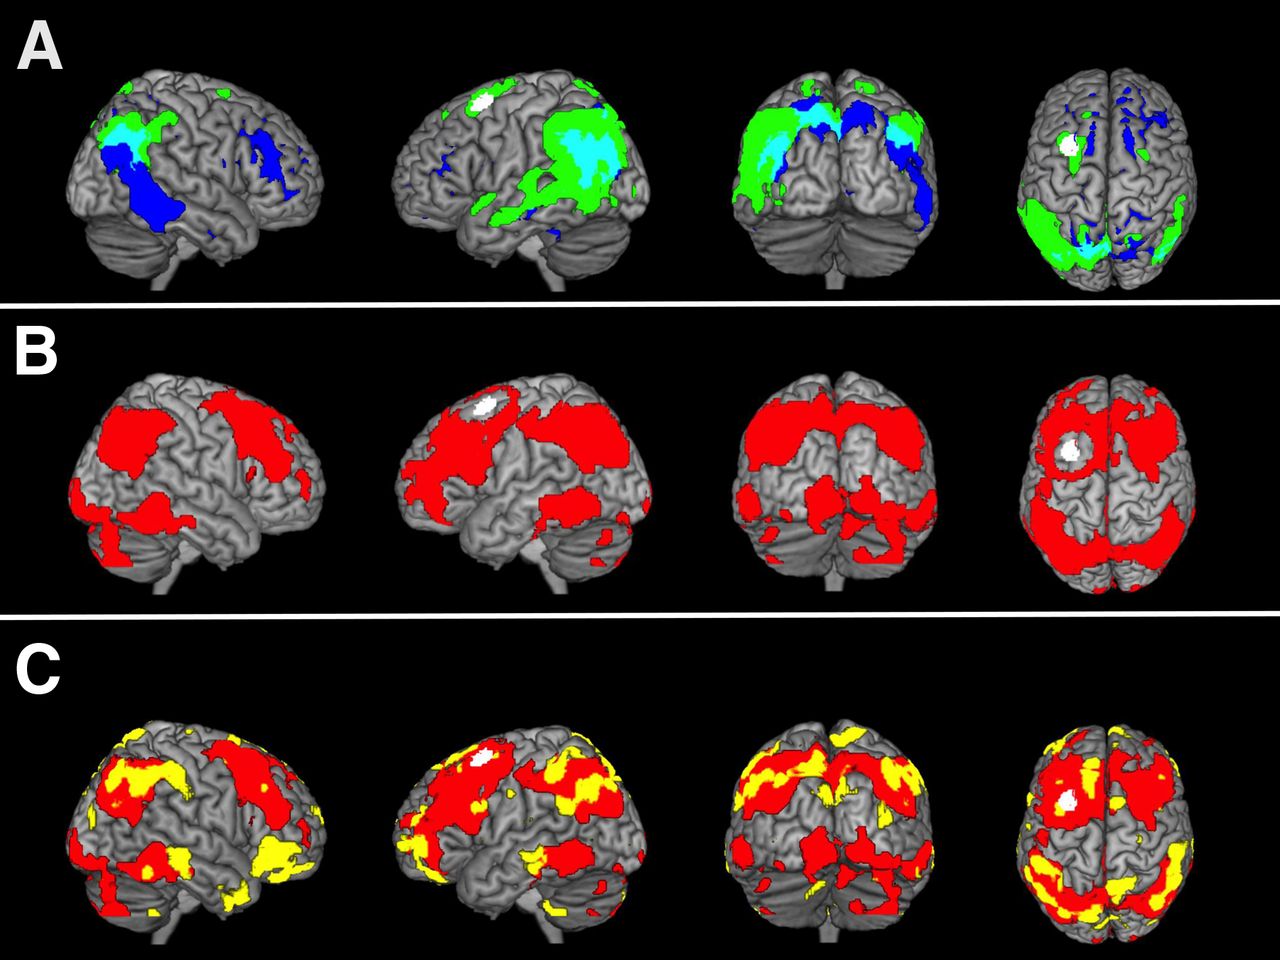
The most conspicuous HO area in our AD group was located in the left middle frontal gyrus (MNI [Montreal Neurologic Institute] coordinates: −30 12 62) (Fig. 2) (23). This HO area was transferred in the the rs-fMRI dataset of HC2 subjects. Brain regions in which the BOLD signal time courses showed significant positive correlations with the BOLD signal of the HO seed (HO-ICN) were located in the precuneus and frontal, parietal, and temporal cortices of both hemispheres. Less significant correlations were found in occipital, cerebellar, and thalamic areas (Fig. 2).

(A) Overlap (cyan) and discrepancy (=HO seed; white) between FU amyloid deposition (blue) and FU hypometabolism (green) in 15 AD patients, compared with 15 healthy control subjects (HC1). P < 0.01, FDR-corrected. (B) ICN (red) based on HO seed; measured in rs-fMRI dataset of 17 control subjects (HC2). Significance threshold P < 0.01, false-discovery rate (FDR)–corrected. (C) Overlap of voxel-based correlation map (AD patients) between metabolism in HO and annual accumulation of amyloid in whole brain (yellow) and HO-ICN (HC2; red). Significance thresholds P < 0.05, uncorrected (correlation-map), and P < 0.01, FDR-corrected (HO-ICN). Results are displayed on standard MR imaging template.
Cross-Modality Analyses
The non-hypothesis-driven voxelwise correlation analysis between FU hypometabolism in the HO seed (FU 18F-FDG SUVRs) and longitudinal 11C-PiB increase over time in the whole brain revealed a correlation map, which comprised particularly bihemispheric frontal and parietotemporal brain areas. This correlation map showed a high overlap with the HO-ICN, especially in remote but connected brain areas (e.g., bilateral temporoparietal cortex; Fig. 2). Quantitative ROI-based correlation analyses revealed a significant positive correlation between annual SUVR changes of 18F-FDG PET–assessed metabolism in the HO area and 11C-PiB changes within the remote ICN (r = 0.537, P = 0.039) (Fig. 3). This correlation could be found neither between HO seed and brain areas outside the HO-ICN (r = 0.470, P = 0.077) nor between HO seed and cerebellar vermis (r = 0.229, P = 0.412) (Supplemental Fig. 2). Significant positive correlations between annual SUVR changes of metabolism and 11C-PiB changes were consistently found also locoregionally within the preselected AD-typical brain regions PCC (r = 0.677, P = 0.006), precuneus (r = 0.691, P = 0.004), and HO-ICN (r = 0.634, P = 0.011) (Fig. 3; Supplemental Fig. 3).
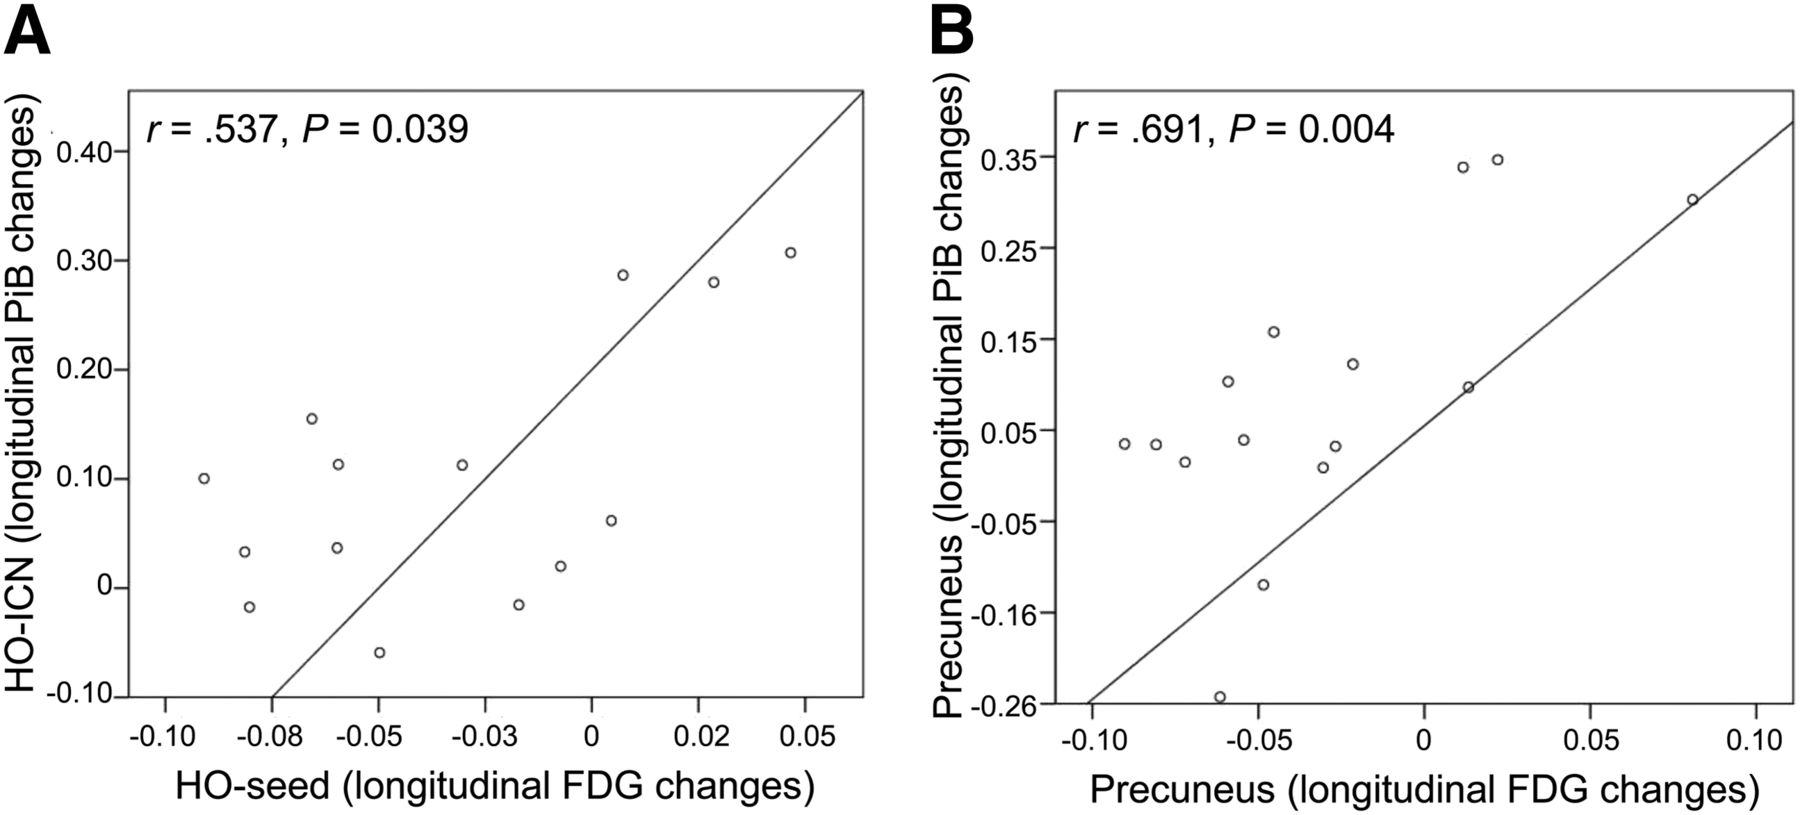
Correlations between longitudinal SUVR changes of metabolism in HO seed and of amyloid uptake in HO-ICN (A), respectively, locoregionally within precuneus (B).
Furthermore, we were able to significantly link a quantitative measure of hypometabolism (annual SUVR changes) in the HO area to a measure of cognitive decline (baseline and FU MMSE score): baseline: r = 0.662, P = 0.007, and FU: r = 0.695, P = 0.004.
DISCUSSION
In the present PET study, we investigated sequential associations between longitudinal changes of 18F-FDG metabolism and 11C-PiB deposition: on the one hand between remote but functionally connected brain regions and on the other hand locoregionally within specific brain regions, known to be vulnerable for AD pathologies. We hypothesized that hypometabolism in brain regions unaffected by local amyloid deposition may be caused by longitudinal increases in amyloid deposition in severely amyloid-affected remote but functionally connected brain areas. For measurement of longitudinal changes in AD pathologies and identification of unaffected, physiologic ICNs, multimodal imaging methods were applied in AD patients and healthy controls.
We demonstrated a correlation between longitudinal changes in metabolism in a brain region unaffected by fibrillary amyloid and changes in amyloid deposition in functionally connected, strongly amyloid-positive brain regions, indicating a point-to-cause relationship of these 2 pathologies. In contrast, such correlations were not found between longitudinal metabolic changes in this HO area and changes in amyloid deposition within nonconnected brain regions or a presumably AD pathology–free brain region, the cerebellar vermis.
Our secondary findings from the PET analyses are consistent with previously published AD studies: AD patients showed, relative to HC1, typical patterns of amyloid deposition and hypometabolism (5–7) at baseline and FU, confirming the selection of a representative AD patient sample. Furthermore, a distinct regional spread of hypometabolism and a minor spread of amyloid deposition, comparing baseline and FU, were found for AD patients (28). After superimposing these FU patterns, a pronounced overlap in posterior brain areas and a nonoverlap, particularly in frontal brain regions, was found (8–10). The most conspicuous hypometabolic brain region without local 11C-PiB uptake (HO area) was identified in the left middle frontal gyrus and used for further analyses (23). The functionally connected HO-ICN, calculated in HC2, included the PCC, precuneus, and frontal and parietotemporal areas, which are brain regions with known vulnerability for AD pathologies. The HO-ICN highly overlapped with the calculated correlation map, resulting from our voxelwise whole-brain correlation analysis between metabolism in the HO seed and longitudinal 11C-PiB increases, in bihemispheric parietotemporal brain areas. This result supports the view of a point-to-cause relationship between longitudinal increase of toxic amyloid in remote regions and disturbed neuronal activity in a functionally connected region, measured as hypometabolism. The overlapping brain regions and further regions of the HO-ICN are part of the prominent default mode network and represent so-called cortical hub regions, which are highly interconnected brain regions playing an important role in interregional neuronal communication (13,21,29). The hyperactivity of such hub regions during a lifetime could facilitate the later development of AD pathologies in exactly these brain regions (16,17). Indeed, high activity seems to be related to increased local amyloid production and accumulation, which may have a direct synaptotoxic effect (30,31).
Besides the reported anatomic associations, we also investigated quantitative interrelations between longitudinal SUVR changes in amyloid deposition and in hypometabolism in predefined ROIs in AD patients, namely between HO area and HO-ICN, between HO area and nonconnected areas and the cerebellar vermis as well as locoregionally within brain areas typically affected by AD pathologies. A significant positive correlation was found between longitudinal changes in metabolism in the HO area and longitudinal changes in amyloid deposition within HO-ICN, which could not be found in the investigated control conditions. These results support the view of a point-to-cause relation between increasing amyloid toxicity in a network including AD-typical brain regions and longitudinal metabolic changes in a remote but functionally connected brain region, spared by significant local amyloid deposition and therefore potentially spared by local amyloid toxicity. Furthermore, we found significant positive correlations between clinical measures of cognitive decline and quantitative changes of metabolism in the HO area. Locoregionally within the HO-ICN, PCC, and precuneus, even stronger correlations between longitudinal changes in metabolism and in amyloid deposition could be demonstrated in the same direction, fitting into the current literature. In AD patients, we already found negative correlations between baseline amyloid deposition and longitudinal metabolic changes as well as positive correlations between baseline metabolism and longitudinal amyloid changes in several AD-typical brain areas (32), whereas Cohen et al. demonstrated negative correlations between metabolism and amyloid deposition for AD but positive for MCI patients (33). These findings in MCI patients on a locoregional level and our findings in mildly affected AD patients on a remote and locoregional level point to an amyloid-mediated compensatory mechanism in preclinical and early clinical stages of AD, for which a potential transient phase of relative upregulation of metabolism (in relation to normalized 18F-FDG SUVRs in AD patients but not to 18F-FDG SUVRs in healthy subjects) might be followed by neuronal breakdown, finally measurable as hypometabolism.
The development, appearance, and interrelations of different AD pathologies within ICNs are in agreement with the recently postulated network degeneration hypothesis (34) indicating that neurodegenerative diseases spread along and affect specific ICNs. This phenomenon has already been suggested for different dementia syndromes (34) and specific clinical AD phenotypes (35). To our best knowledge, the current study is the first one demonstrating longitudinal associations between changes in 2 AD-related pathologies within ICNs. In general, the number of studies dealing with longitudinal relationships between different AD pathologies is limited. A recently published study in hereditary AD investigated the estimated regional dispersion of amyloid deposition, hypometabolism, and neuronal atrophy in patients with autosomal-dominant AD (presenilin mutation carriers), which averagely show elevated amyloid deposition approximately 15 y before the beginning of disease, whereas hypometabolism and atrophy appeared approximately 10 and 5 y before onset (36). Benzinger et al. (36) demonstrated that most but not all investigated structures with amyloid deposition develop hypometabolism followed by atrophy. Interestingly, in the amyloid-positive precuneus and PCC a hypermetabolic phase before the occurrence of hypometabolism was estimated, fitting into the above-mentioned concept of amyloid-mediated compensatory mechanisms. However, findings from the latter study resulted from estimated longitudinal changes and might not be directly comparable to our observational, truly longitudinal findings in sporadic AD. Tosun et al. demonstrated that increased amyloid deposition in the precuneus and medial temporal regions was associated with atrophy in medial temporal regions in MCI patients (37). In a similar longitudinal study, Villain et al. showed that atrophy in the hippocampal area in MCI patients may lead to disruption of the structural integrity of white matter cingulum bundle fibers, which itself may cause hypometabolism in the PCC (38). Consequently, besides the deposition of toxic amyloid, there seem to exist additional pathomechanisms leading to neuronal dysfunction; however, the interrelations are complex and need to be further evaluated in a longitudinal fashion in larger cohorts of preclinical AD patients with standardized multimodal PET/MR imaging protocols applied.
There are several limitations to our study. Because of the small sample size, differences from the general population of AD patients may be expected and our findings may not be generalizable. It is important to mention that our results should be considered as exemplary and need to be reproduced in larger samples in future studies.
Because of different methodologic sensitivities, it may be problematic to compare the results acquired from different imaging techniques. The identified HO area may not be completely free of any amyloid deposition and should be considered as an exemplary region with peak HO in the investigated AD group because distinct parts of the frontal cortex are typically reported as amyloid-positive brain regions (5,10). Moreover, with 11C-PiB only fibrillary amyloid deposits can be targeted and the probably more toxic soluble amyloid oligomeres cannot be visualized by any of the currently available amyloid PET imaging agents.
CONCLUSION
Positive quantitative correlations were demonstrated between longitudinal changes of amyloid and hypometabolism in AD patients. These correlations were found between remote brain regions (HO-ICN and HO seed) and locoregionally within AD-typical brain regions. The results of this longitudinal study indicate that in AD amyloid accumulation in remote but functionally connected brain regions may significantly contribute to longitudinally evolving hypometabolism in brain regions not strongly affected by local amyloid pathology, supporting the amyloid- and network-degeneration hypothesis.
DISCLOSURE
The costs of publication of this article were defrayed in part by the payment of page charges. Therefore, and solely to indicate this fact, this article is hereby marked “advertisement” in accordance with 18 USC section 1734. This work was supported in part by the German Research Foundation (DFG) (DR 445/4-1, DR 445/5-2, and FO 886/1-1). Alexander Drzezga is acting as consultant for GE Healthcare, Avid/Lilly & Piramal. Stefan Förster is acting as consultant for GE Healthcare and Piramal. No other potential conflict of interest relevant to this article was reported.
Acknowledgments
We are thankful to the participants of the study and the staff of the Departments of Nuclear Medicine, Psychiatry and Neuroradiology for their help in recruitment and data collection.
Footnotes
Published online Feb. 12, 2015.
- © 2015 by the Society of Nuclear Medicine and Molecular Imaging, Inc.
REFERENCES
- Received for publication October 26, 2014.
- Accepted for publication January 12, 2015.


