


Abstract
Organic cation transporters (OCTs) in the kidney proximal tubule (PT) participate in renal excretion of drugs and endogenous compounds. PT function is commonly impaired in kidney diseases, and consequently quantitative measurement of OCT function may provide an important estimate of kidney function. Metformin is a widely used drug and targets OCT type 2 located in the PT. Thus, we hypothesized that 11C-labeled metformin would be a suitable PET tracer for quantification of renal function. Methods: 11C-metformin was prepared by 11C-methylation of 1-methylbiguanide. In vitro cell uptake of 11C-metformin was studied in LLC-PK1 cells in the presence of increasing doses of unlabeled metformin. In vivo small-animal PET studies in Sprague–Dawley rats were performed at baseline and after treatment with OCT inhibitors to evaluate renal uptake of 11C-metformin. Kidney and liver pharmacokinetics of 11C-metformin was investigated in vivo by dynamic 11C-metformin PET/CT in 6 anesthetized pigs, and renal clearance of 11C-metformin was compared with renal clearance of 51Cr-ethylenediaminetetraacetic acid (EDTA). Formation of 11C metabolites was investigated by analysis of blood and urine samples. Results: The radiochemical yield of 11C-metformin was 15% ± 3% (n = 40, decay-corrected), and up to 1.5 GBq of tracer were produced with a radiochemical purity greater than 95% in less than 30 min. Dose-dependent uptake of 11C-metformin in LLC-PK1 cells was rapid. Rat small-animal PET images showed 11C-metformin uptake in the kidney and liver, the kinetics of which were changed after challenging animals with OCT inhibitors. In pigs, 80% of the injected metformin dose was rapidly present in the kidney, and a high dose of metformin caused a delayed renal uptake and clearance compared with baseline consistent with transporter-mediated competition. Renal clearance of 11C-metformin was approximately 3 times the renal clearance of 51Cr-EDTA. Conclusion: We successfully synthesized an 11C-metformin tracer, and PET studies in rats and pigs showed a rapid kidney uptake from the blood and excretion into the bladder similar to other radiopharmaceuticals developed for γ-camera renography.
- renal function
- organic cation transporter
- positron emission tomography
- glomerular filtration rate
- metformin
Organic cation transporters (OCTs) in the kidney, liver, intestine, brain, and placenta play essential physiologic and pharmacologic roles in the handling of cationic drugs and endogenous organic ions (1). In the kidney, human OCTs and multidrug and toxin extrusion proteins (MATEs) are the major transporters responsible for the secretion of cationic drugs into the urine. Specifically, OCT type 2 (OCT2) mediates the uptake of drugs from the blood at the basolateral membrane of the proximal tubular epithelial cells, and MATE1 and MATE2K secrete drugs from cells into the lumen of proximal tubules (1,2). Creatinine is an important OCT2 substrate, which may explain why medication with cationic drugs can influence tubular secretion of creatinine. Consistent with this, a recent study demonstrated that variants in the gene SLC22A2, encoding OCT2, are associated with phenotypes of net tubular creatinine secretion and end-stage renal failure (3). A downregulation of OCT2 was associated with an experimental acute renal failure in rats (4,5), indicating that OCT2 may play an important role in renal disease. It was recently demonstrated that OCT2 is important for renal metformin transport, and other cationic drugs may competitively inhibit the renal metformin transport (6).
Consequently, a noninvasive method to assess the renal transport of cationic compounds would be of considerable interest given its potential to improve our understanding of normal renal physiology, pathophysiology, and the renal effects or side effects of new drugs. There have been a few attempts to develop a renal cationic tracer for γ-camera studies, however, they have not advanced into the clinic (7). Because some of the currently available common methods for measuring kidney function (such as renography with 99mTc-MAG3) also are based on proximal tubule transport by another transport system (organic anion transporters), there may be an interest in developing an alternative method for measuring kidney function with radiotracers transported by OCTs.
Recently in The Journal of Nuclear Medicine, PET/CT was used in conjunction with 68Ga-ethylenediaminetetraacetic acid (EDTA) to measure the glomerular filtration rate (8), suggesting that PET/CT is a suitable methodology to also study the renal and hepatic handling of cationic drugs, but so far no specific cation tracer has emerged for renal PET studies. The ideal tracer has high affinity and is specific for the OCT2 transporter, has negligible metabolism and plasma protein binding with a high first-pass renal extraction, and is excreted in high concentrations in the urine.
We therefore hypothesized that the diabetes drug metformin, labeled with 11C ([N-methyl-11C] metformin [11C-metformin]), is a suitable PET tracer for quantitative PET/CT studies of renal metformin excretion and hence provides a direct measurement for organic cation transport properties in the proximal tubule. The aim of this study therefore was to examine whether 11C-metformin can be used as a radiotracer for renal PET imaging studies. Here, we present the radiosynthesis of 11C-metformin, in vitro studies in kidney cells, and preclinical PET studies in rats. Exploratory proof-of-concept PET/CT studies in anesthetized pigs included dynamic PET/CT of the kidney and liver and analysis for 11C-metformin in the blood and urine. Competition between 11C-metformin and other compounds for the organic cation transporters was investigated. Additionally, the biodistribution of 11C-metformin was determined.
MATERIALS AND METHODS
Radiochemistry
11C-metformin was prepared by radiosynthesis as illustrated in Figure 1 and described in detail in the supplemental information (supplemental materials are available at http://jnm.snmjournals.org). The radiochemical purity of 11C-metformin was determined by analytic high-performance liquid chromatography (supplemental information).
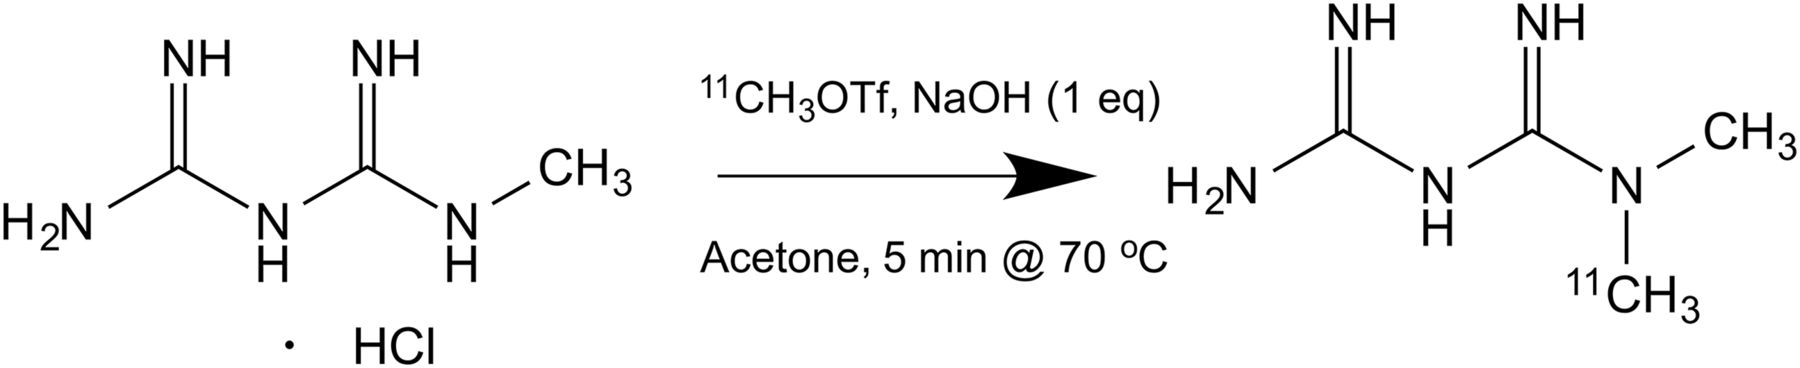
Synthesis scheme for 11C-metformin.
In Vitro and In Vivo Studies
The study comprised a series of in vitro and in vivo studies using rats and pigs. A summary of the pig experiments is shown in Table 1. The supplemental information provides a detailed description.
Summary of Pigs Used
RESULTS
Radiochemistry
The 1-step radiosynthesis provided 0.4–1.5 GBq of 11C-metformin within 30 min with a radiochemical yield of 15% ± 3% (mean ± SD; n = 40, decay-corrected) and a radiochemical purity greater than 95%. In its final formulation (0.1–0.5 μg of metformin per mL in aqueous 100 mM (NH4)2HPO4; pH 5), the tracer showed no alterations in pH or chemical or radiochemical purity for up to 1.5 h after the end of the synthesis.
In Vitro Cell Experiments
LLC-PK1 cells displayed linear time-dependent uptake of 11C-metformin that could be challenged by prior treatment with unlabeled metformin (Fig. 2A). Reincubation of tracer-loaded LLC-PK1 cells in tracer-free medium showed a monoexponential disappearance of 11C-metformin to approximately 60% after 30 min. The clearance rate was estimated as k = 1 h−1.

11C-metformin uptake in OCT1- and OCT2-expressing LLC-PK1 cells (A) at baseline (●) and with increasing concentrations of unlabeled metformin, 2.5 mM (▪) and 10 mM (▲) (all; n = 3). (B) 11C-metformin release kinetics in previously tracer-loaded cells after reincubation in tracer-free medium.
Autoradiography Studies
Figure 3 shows representative images of 11C-metformin uptake in the liver and kidneys from rats 2 min after tracer injection. In the liver, there is a homogeneous distribution of 11C-metformin (Fig. 3A), which is much weaker than 11C-metformin uptake in the kidney (Fig. 3B). In the kidney, the uptake is heterogeneous with a relatively strong uptake in the cortical regions and with an even more intense uptake corresponding to the medullary regions of the kidney.
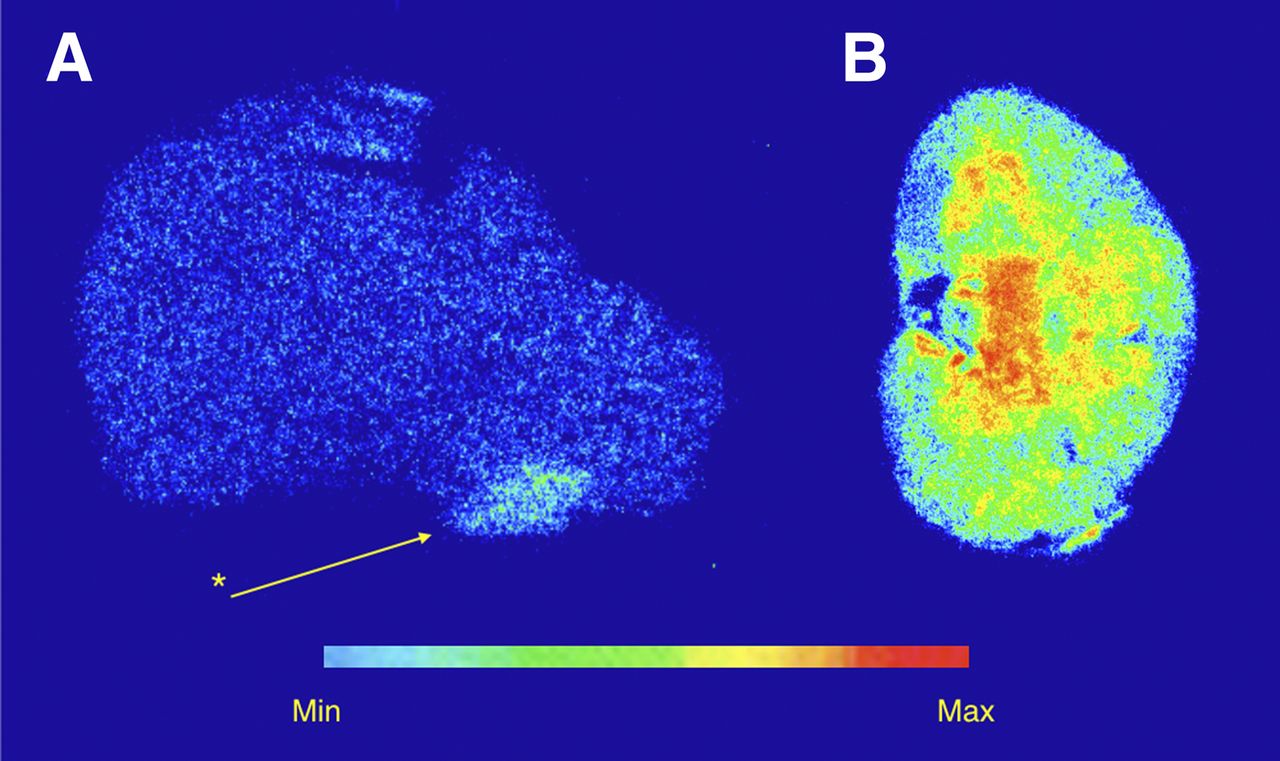
Autoradiography of rat liver (A) and kidney (B) were obtained 2 min after injection of 11C-metformin. There is augmented uptake of 11C-metformin in kidney compared with liver, and kidney distribution of 11C-metformin demonstrates that accumulation is most intensive in renal medulla. *A cutting artifact. Max = maximum; min = minimum.
In Vivo Studies
Small-Animal PET Experiments in Rats
To examine the pharmacokinetic properties of 11C-metformin, rats were scanned after intravenous administration of the tracer. The dynamic PET recordings demonstrated a rapid uptake of 11C-metformin into the kidney and less pronounced into liver tissue (Figs. 4A and 4B). With regard to the renal uptake, it is noteworthy that the renal cortex shows a characteristic 3-phase pattern similar to a classic renogram, with a rapid phase 1 lasting a few seconds corresponding to the arterial input of a bolus passage of 11C-metformin to the kidney and thereby representing the renal blood flow. In phase 2, 11C-metformin accumulates from 0.5 to 2 min in the kidney in proportion with the functional capacity of the renal parenchyma. Excretion from the renal cortex dominates beyond 2 min in phase 3. Characteristically, the liver uptake is markedly lower than the renal uptake.
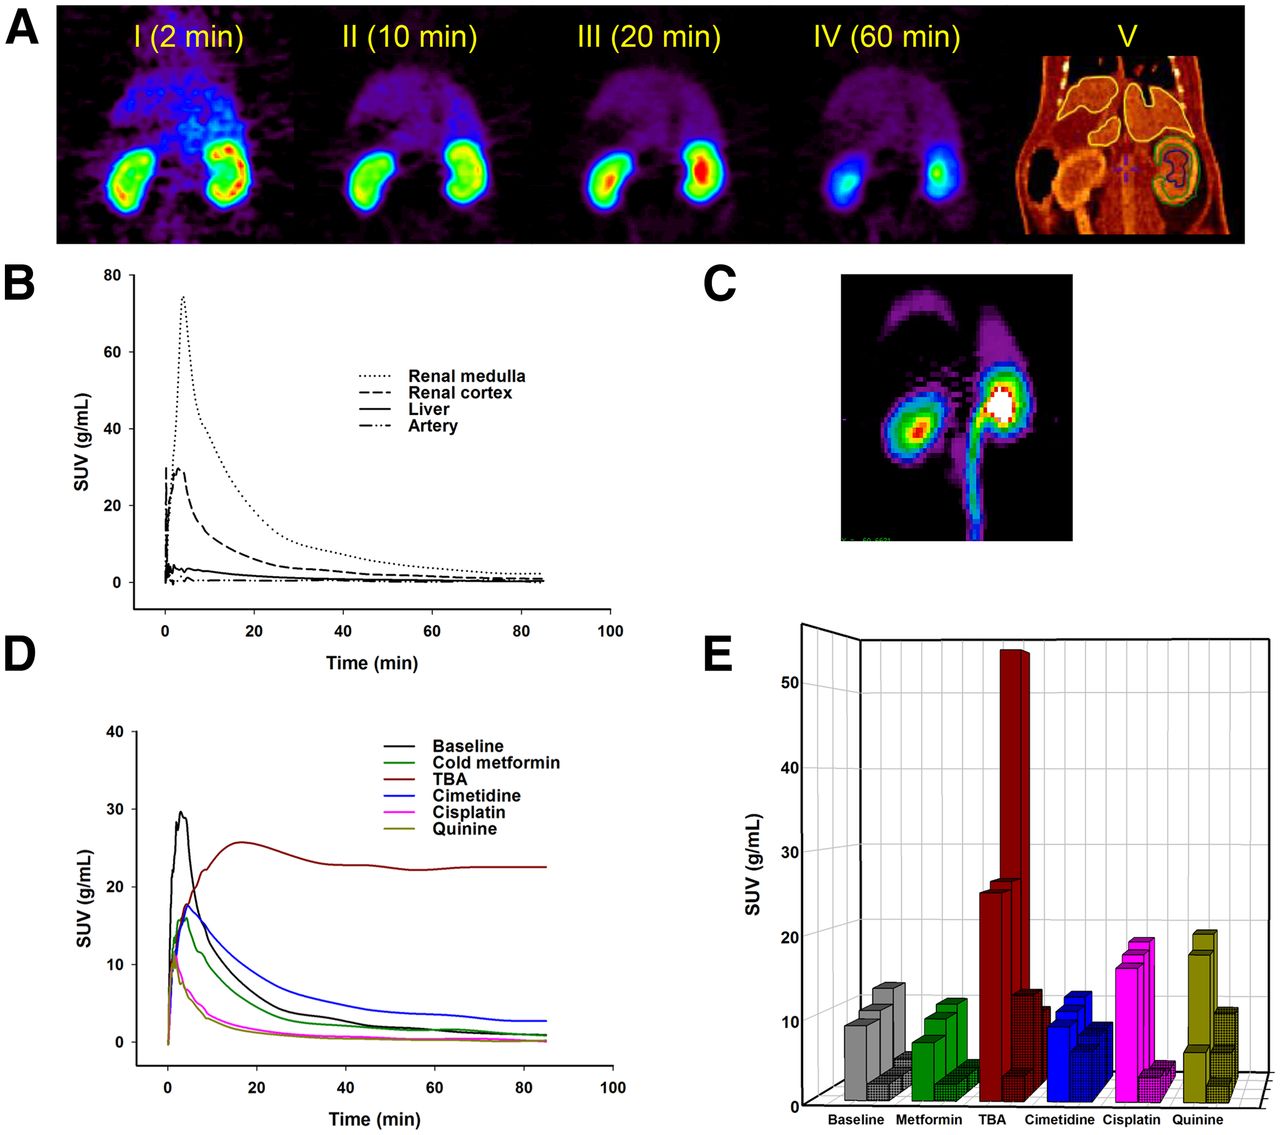
Pharmacokinetics and drug interaction of 11C-metformin studies in rats subjected to PET. (A) Summed parametric images (I–IV) and corresponding CT image (V). (B and C) Representative regional time–activity curves (B) after injection of 11C-metformin show rapid cortical uptake and subsequent accumulation in renal medulla and pelvis, which yields 90-min summed parametric image shown in C. (D and E) Examples of drug-induced changes in renal cortex time–activity curves (D) and corresponding whole kidney (solid color) and liver (shaded color) SUVs in rats examined at baseline and after metformin, TBA, cimetidine, cisplatin, and quinine (all; n = 3) (E).
To examine the drug interaction properties of OCT in the kidney and liver, rats were subjected to PET imaging with 11C-metformin after intravenous administration of cold metformin, tetrabutylammonium hydrogensulphate (TBA), cimetidine, cisplatin, and quinine (Figs. 4D and 4E). These drugs were chosen with diversity in mind, based on their reported affinity for OCTs and MATEs. Metformin and cimetidine reduced the maximum renal cortex uptake of 11C-metformin slightly, whereas the whole kidney SUV was not affected. Cisplatin and quinine had a more pronounced effect on the cortex time–activity curve, along with a markedly higher kidney SUV. TBA administration caused an irreversible retention of 11C-metformin in the renal cortex accompanied by a large increase in kidney SUV. Only TBA and cimetidine caused the liver SUV to increase compared with baseline value.
PET/CT Experiments in Pigs
Similar to what was seen in rats, dynamic PET recordings in pigs demonstrated a rapid uptake of 11C-metformin into the kidney and a less pronounced uptake into liver tissue (Fig. 5). Renal uptake markedly exceeded liver uptake. Coronal slices of summed PET images at various times after tracer injection (Fig. 5, top) show a homogeneous distribution and rapid uptake of 11C-metformin in the renal cortical parenchyma within the first minute. In the succeeding images, the distribution of 11C-metformin is seen to concentrate in the renal medulla, demonstrating excretion of 11C-metformin. Again, the dynamic PET recordings show the characteristic 3-phase pattern similar to a classic renogram, as already observed in rats. Administration of cold metformin had no effect on the plasma profile of 11C-metformin yet resulted in lower renal cortex radioactivity and slower liver washout, compared with baseline. From the pharmacokinetic analysis of 11C-metformin in the renal cortex, we calculated rate constants K1 and k2, along with distribution volumes (Table 2). The plasma-to-urine clearance could be estimated to 382 mL/min at baseline, dropping to 179 mL/min after metformin challenge.

Time–activity curves for renal cortex, liver, and blood at baseline (black) and after pretreatment with cold metformin (red). Top panels show 11C-metformin radioactivity in central coronal plane containing both kidneys at selected times.
Pharmacokinetics of 11C-Metformin Before and After Competition with Unlabeled Metformin
Clearance Studies
To examine the magnitude of metformin clearance compared with the glomerular filtration rate, we measured the urine clearance of 11C-metformin and 51Cr-EDTA in 2 pigs (Table 3). The urine clearance of 11C-metformin was 3.3 times higher than the 51Cr-EDTA urine clearance, with similar baseline 11C-metformin clearance values as estimated from the pharmacokinetic analysis.
Urine Clearance of 11C-Metformin, 51Cr-EDTA, Protein Binding, and Metabolites in Plasma from 2 Pigs
Biodistribution and Dosimetry
The biodistribution of 11C-metformin was examined in a 40-kg female pig at 5 different time points (Fig. 6). The primary sites of radioactivity accumulation were kidney, liver, salivary glands, and urinary bladder wall (small intestines became visible 60 min after injection), whereas the brain was devoid of radioactivity. The biodistribution of 11C-metformin did not change appreciably during the infusion of unlabeled metformin, and accordingly the estimated effective doses for humans, calculated to 6–7 μSv/MBq, were only approximately 25% higher under metformin infusion than at baseline (Supplemental Table 1).
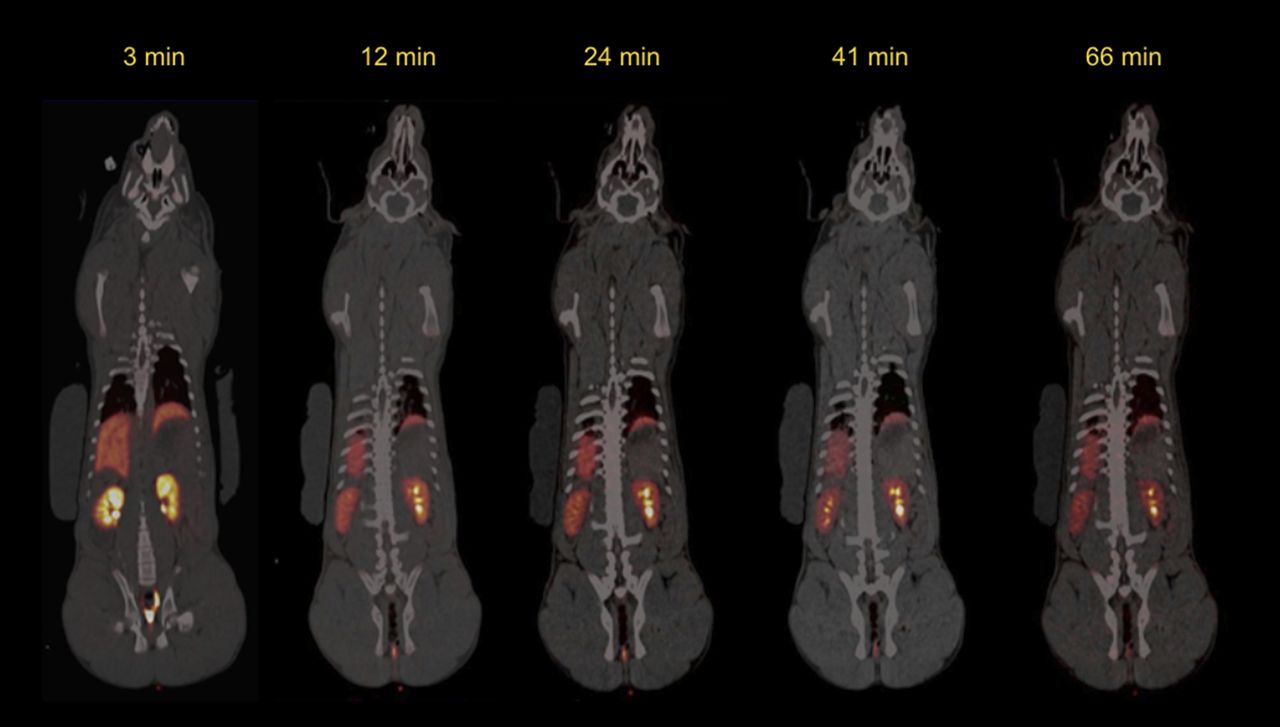
Whole-body pig biodistribution of 11C-metformin.
DISCUSSION
11C-Metformin Has High Affinity for Kidney OCTs
Metformin is a hydrophilic organic cation that is not metabolized in humans and it may thus be a good probe drug for organic cation transport (9,10). To facilitate examination of the properties of metformin as a drug to study renal OCT2 transport, we have developed a novel procedure for radiosynthesis of 11C-metformin. This method gives a higher radiochemical yield in a shorter production time and avoids the use of toxic starting materials when compared with a recently published method (11) and therefore the present 11C-metformin tracer may have potential applications for human examinations. Because more than 98% of the absorbed dose of metformin is eliminated by the kidneys, 11C-metformin may be a radiopharmaceutical that potentially could provide important information of kidney function both at baseline in healthy individuals as well as in patients with kidney disease. The results of the present in vitro study showed that 11C-metformin is rapidly transported into the proximal tubule cells and that this transport can be inhibited dose-dependently by cold metformin. Importantly, 11C-metformin is not retained in the proximal tubule cells. Thirty minutes after reincubation of LLC-PK1 proximal tubule cells previously exposed to 11C-metformin, 40% of the accumulated dose was lost, showing that 11C-metformin is not trapped in the cells. This finding is consistent with previous observations from studies examining the kinetics of cold metformin, which demonstrated that more than 90% of the absorbed dose is eliminated by the kidneys (8,9). Moreover, the autoradiography studies provided evidence that there is a high cortical uptake with rapid concomitant elimination and accumulation of 11C-metformin in the medullary parts, supporting the view that there is a high renal extraction of 11C-metformin. In the present study, renal extraction efficiency was not measured directly. However, in a subset of pigs we measured the renal clearance of 11C-metformin and 51Cr-EDTA by the constant infusion renal clearance technique. The results of these examinations showed that renal 11C-metformin clearance was approximately 3–4 times higher than the renal clearance of 51Cr-EDTA. This finding is in line with the results from previous pharmacology studies measuring the renal clearance of metformin in healthy adult Caucasian volunteers and demonstrating a slightly higher renal metformin clearance than the renal clearance of 11C-metformin found in 40-kg pigs (12,13) and the finding that the renal clearance of metformin is roughly 4 times higher than the effective glomerular filtration rate (13). Furthermore, because of no plasma protein binding and hence free filtration in glomeruli this finding demonstrates that the tubular secretion of metformin during baseline conditions is roughly 75%–80% of the renal metformin clearance. This means that metformin is cleared partially by glomerular filtration (20%) and the remainder by tubular secretion (80%) with no reabsorption. Further, the value of K1 in the present study, which is of a magnitude similar to the plasma flow to the kidneys (14), also suggests a high extraction fraction of metformin. We speculate that 11C-metformin may be used to measure the effective renal plasma flow, as the properties of 11C-metformin matches those of p-aminohippurate, which has been used as a reference compound for estimation of the effective renal plasma flow (15).
In the kidney, OCT2 is responsible for basolateral metformin uptake and transport into the proximal tubular cells (1). Because OCTs are all uniporters that mediate facilitated diffusion of metformin in either direction (16), the luminal extrusion of metformin into the urine is facilitated by the apical located H+/drug antiporters multidrug and toxin extrusion transporters 1 and 2 (17,18), elegantly demonstrated using proton pump inhibitors (19).
In addition to the organic cation system, renal tubule cells also display a comparable system for organic anions (20,21). Active transport of organic anions is an essential renal function, and organic anion transporters in the proximal tubule are responsible for transport of p-aminohippurate and hippuran analogs (22,23). Previous studies have demonstrated drug–drug interaction under conditions in which the renal expression of organic anion transporters is reduced on experimentally induced renal failure (24). This indicates that diagnostic information obtained by, for example, 99mTc-MAG3 may be biased under treatment with certain drugs. Interestingly, in OCT1/2 knockout mice, metformin pharmacokinetics but not pharmacodynamics were changed, challenging the presumption that systemic OCT inhibition will affect the effect of metformin (25). Even so, 11C-metformin might be a potential indicator for evaluation of the drug interaction of new drug candidates against renal transporters in vivo (26).
11C-Metformin: Potential Tracer to Study Kidney Function
At the highest dose of metformin tested, the renal handling of 11C-metformin was changed 20% based on SUV and 25% in peak value in the cortex, whereas the liver SUV remained unchanged yet the peak radioactivity occurred much later. This might be explained by metformin having a larger effect on the tissue uptake process than on the elimination transporter proteins—that is, the capacity of OCT1 (in kidney and liver) or OCT2 (in kidney) for metformin is less than that of MATE1/2K, namely plasma membrane monoamine transporter. Because the renal excretion of compounds is affected by urine production and flow, it is also vital to monitor the hydration status of the animals before and during experiments that focus on elimination of compounds from kidneys to bladder.
Cimetidine (27,28), TBA (29), cisplatin (30,31), and quinine (32) interacted with metformin either through competition or through inhibition of OCTs or MATEs, and other drug classes such as tyrosine kinase inhibitors (33) or β-blockers (34) are potential substrates for OCT2 or MATEs, further stressing the importance of developing noninvasive methods to study these interactions. The present study confirms that there is drug–drug interaction, but whether this occurs via OCT or MATE or both needs to be addressed fully.
Biodistribution of 11C-Metformin
The high organ specificity of 11C-metformin is in agreement with the known distribution of OCTs (1,35), and because the present doses of 50–170 MBq of 11C-metformin to 40-kg pigs gave high-contrast PET images, it is likely that a dose of, for example, 100 MBq will be sufficient for obtaining similar data quality in human studies, with a radiation burden as little as 0.6 mSv. Conventional γ-camera renoscintigraphy with 99mTc-MAG3 gives an effective dose equivalent of 1.5 mSv/370 MBq to an adult with normal kidney function provided the person voids at the conclusion of the study and at 4-h intervals thereafter (36). Thus, 11C-metformin PET gives a 0.6 mSv/100 MBq dose similar to the radiation burden of 99mTc-MAG3, which should favor 11C-metformin PET, taking into account voiding and expected superior image quality. Future studies should concentrate on a thorough comparison of properties of 11C-metformin as a radiotracer for quantitative renal PET studies compared with the performance of renal studies acquired with 99mTc-MAG3, 99mTc-diethylenetriaminepentaacetic acid, and 131I-hippurate.
CONCLUSION
[N-methyl-11C]metformin was prepared by a simple 1-step radiosynthesis. This novel tracer underwent fast renal tubular transport in rat and pig kidneys, resulting in high concentrations of unmetabolized 11C-metformin in the urine. Competitive inhibition with unlabeled metformin and other substrates/inhibitors of OCTs indicated that the renal (and hepatic) transport of 11C-metformin took place via the same transporter proteins. The results of this study therefore indicated that 11C-metformin PET/CT may prove to be useful in humans for characterization and quantification of kidney (and liver) function as well as expression and function of OCTs during normal physiologic conditions and in patients with kidney (or liver) diseases.
DISCLOSURE
The costs of publication of this article were defrayed in part by the payment of page charges. Therefore, and solely to indicate this fact, this article is hereby marked “advertisement” in accordance with 18 USC section 1734. This study was supported by the National Institute of Diabetes and Digestive and Kidney Diseases (R01-DK074419) and the Danish Council for Independent Research (Medical Sciences, 09-073658). No other potential conflict of interest relevant to this article was reported.
Acknowledgments
Preliminary data from this study were presented orally in 2013 at the 20th International Symposium on Radiopharmaceutical Sciences, Jeju, Korea, and in 2014 at the annual meeting of the Society of Nuclear Medicine and Molecular Imaging, St. Louis, Missouri.
Footnotes
Published online Jan. 14, 2016.
- © 2016 by the Society of Nuclear Medicine and Molecular Imaging, Inc.
REFERENCES
- Received for publication November 6, 2015.
- Accepted for publication December 17, 2015.


Jump to section
Related Articles
Cited By...
- Assessment of Metformin-Induced Changes in Cardiac and Hepatic Redox State Using Hyperpolarized[1-13C]Pyruvate
- In Vivo Imaging of Human 11C-Metformin in Peripheral Organs: Dosimetry, Biodistribution, and Kinetic Analyses
- [11C]-Labeled Metformin Distribution in the Liver and Small Intestine Using Dynamic Positron Emission Tomography in Mice Demonstrates Tissue-Specific Transporter Dependency