


Abstract
We aimed to improve the diagnostic accuracy of automatic myocardial perfusion SPECT (MPS) interpretation analysis for the prediction of coronary artery disease (CAD) by integrating several quantitative perfusion and functional variables for noncorrected (NC) data by Support Vector Machine (SVM) algorithm, a computer method for machine learning. Methods: Rest–stress gated 99mTc MPS NC studies (n = 957) from 623 consecutive patients with correlating invasive coronary angiography and 334 with a low likelihood of CAD (<5%) were assessed. Stenosis ≥50% in left main or ≥70% in all other vessels was considered abnormal. Total perfusion deficit (TPD) was computed automatically. In addition, ischemic changes (ISCHs) and ejection fraction changes (EFCs) between stress and rest were derived by quantitative software. The SVM was trained using a group of 125 patients (25 with low-likelihood, 25 with 0-vessel, 25 with 1-vessel, 25 with 2-vessel, and 25 with 3-vessel CAD) with the above quantitative variables and second-order polynomial fitting. The remaining patients (n = 832) were categorized using probability estimates, with CAD defined as a probability estimate ≥ 0.50. The diagnostic accuracy of SVM was also compared with visual segmental scoring by 2 experienced readers. Results: The sensitivity of SVM (84%) was significantly better than ISCH (75%, P < 0.05) and EFC (31%, P < 0.05). The specificity of SVM (88%) was significantly better than TPD (78%, P < 0.05) and EFC (77%, P < 0.05). The diagnostic accuracy of SVM (86%) was significantly better than TPD (81%), ISCH (81%), or EFC (46%) (P < 0.05 for all). The receiver-operating-characteristic (ROC) area under the curve for SVM (0.92) was significantly better than TPD (0.90), ISCH (0.87), and EFC (0.64) (P < 0.001 for all). The diagnostic accuracy of SVM was comparable to the overall accuracy of both visual readers (86% vs. 84%, P = NS). The ROC area under the curve for SVM (0.92) was significantly better than that of both visual readers (0.87 and 0.88, P < 0.03). Conclusion: Computational integration of quantitative perfusion and functional variables using the SVM approach significantly improves the diagnostic accuracy of MPS and can significantly outperform visual assessment based on ROC analysis.
- automated quantification
- coronary artery disease
- myocardial perfusion SPECT
- total perfusion deficit
- support vector machines
- machine learning
Coronary artery disease (CAD) is the leading cause of morbidity and mortality worldwide (1,2). Myocardial perfusion SPECT (MPS) is the most commonly used noninvasive stress imaging modality for the diagnosis of CAD (3). Multiple MPS features including quantitative perfusion and functional variables have been previously used for diagnosis of obstructive CAD (4–8), and they are reported routinely by nuclear cardiology software. However, algorithms for combining and integrating these variables to improve the overall diagnostic accuracy have not been well developed. Currently none of the software tools provides a combined diagnostic score based on multiple quantitative features.
Support Vector Machine (SVM), a kernel-based method (9), is a machine learning algorithm. It has been applied in various fields, including computational biology, because of its high overall accuracy, ability to deal with large datasets, and flexibility in modeling diverse sources of data (10). SVM is a classifier, in which a set of input data with several features is used to assign objects to multiple categories (10). SVM uses the concept of margin maximization (distances between hypersurfaces defined in multidimensional variable space) to discriminate between 2 categories. Margins are computed by various kernel functions, allowing the SVM to classify with nonlinear class boundaries by transforming the input variables via nonlinear mappings. Furthermore, in certain implementations it is also possible to obtain probability estimates for a particular classification (11).
In the current study, we aimed to investigate whether integrating quantitative perfusion and functional MPS variables using an SVM statistical learning algorithm demonstrates an improvement in the diagnostic accuracy of automated analysis in predicting severe stenosis, using invasive coronary angiography as the gold standard. To our knowledge, such an approach has not been previously reported for quantitative MPS. Such a tool may easily be integrated within currently available quantitative nuclear cardiology software programs to provide improved automated diagnostic scores for interpretation of MPS results.
MATERIALS AND METHODS
Patient Population
Consecutive subjects who were referred to the Nuclear Medicine Department of Sacred Heart Medical Center, Eugene, Oregon, from March 1, 2003, to December 31, 2006, for rest and stress electrocardiography-gated MPS, in whom gated information was available for both phases, were selected (12). All patients with a prior history of CAD or significant valve disease were excluded. MPS and coronary angiography had to be performed within 60 days without a significant intervening event. The low likelihood (LLk) studies were obtained from patients who performed an adequate treadmill stress test, did not have correlating coronary angiography available, but had less than a 5% likelihood of CAD using the Diamond and Forrester criteria based on age, sex, symptoms, and electrocardiography response to adequate treadmill stress testing (13). On the basis of these selection criteria, 957 sequential studies were identified to form the study group.
Training and Testing Groups
This population consisted of 2 subgroups of patients: 623 patients with correlative angiography as described above and 334 patients with an LLk of CAD. We chose to split our population into minimal training and larger testing groups to keep the testing population as large as possible. From our internal experience in perfusion quantification with normal databases, a small number of LLk datasets (25–50) were sufficient for the creation of normal databases (14), whereas increasing that number did not significantly change the normal distribution. In this application, we needed to include a representative population with varying degrees of the disease. We chose to include an equal number of cases assigned to normal and abnormal groups to ensure equal contribution from different perfusion or functional abnormalities. The objective was to create a balanced model that would be applicable to normal and abnormal scan results. Therefore, the training group consisted of 125 patients (25 with LLk, 25 with 0-vessel, 25 with 1-vessel, 25 with 2-vessel, and 25 with 3-vessel CAD). The remaining 832 patients were used during the testing phase. The clinical characteristics of the 2 groups are listed in Table 1. The study protocol was approved by the Institutional Review Board.
Baseline Characteristics of Patients
Image Acquisition and Reconstruction Protocols
The details of image acquisition and tomographic reconstruction have been previously described (15). In brief, studies were performed using standard 99mTc-sestamibi rest–stress protocols. All subjects were imaged at 60 min after the administration of 99mTc-sestamibi at rest, followed by stress imaging at 15–45 min after either radiopharmaceutical injection during treadmill testing or adenosine infusion with low-level exercise. Dual-detector scintillation cameras (Vertex; Philips) with low-energy, high-resolution collimators were used to perform MPS.
Ungated and gated tomographic reconstruction was performed using the AutoSPECT (16) and Vantage Pro programs (Philips). Emission images were automatically corrected for nonuniformity, radioactive decay, and motion during acquisition and subjected to 3-point spatial smoothing. Attenuation correction was not used in this study. The alignment of the projection data to the reconstruction matrix was applied to determine the mechanical center of rotation. Butterworth filters were applied to perform MPS with an order of 10 and cutoff of 0.50 for rest MPS and an order of 5 and cutoff of 0.66 for stress MPS. For gated images, time binning was performed both into 8 bins (70%) and into 16 bins (30%).
Automated Analysis
In this proof-of-concept study, we have selected 3 common quantitative features routinely used during the interpretation of MPS (2 perfusion and 1 functional) in order to provide a minimal set of quantitative variables known to be clinically important and conservatively guarding against any potential overfitting with a larger number of features.
Stress Total Perfusion Deficit (TPD)
Stress MPS images were quantified using normal limits and a previously developed simplified approach (6). Perfusion parameters were derived automatically using the concept of total perfusion deficit (TPD) (17). Briefly, an ellipsoidal model and contours derived by the quantitative perfusion SPECT algorithm (18–20) were used to extract polar map samples. An optimal normalization factor was established by an iterative search for the minimal absolute count difference between the counts in the normal part of the myocardium and the corresponding count distribution in the normal database. This scheme avoided normalization based on an arbitrary selection of pixels (maximum or percentile maximum). Subsequently, an abnormality threshold of 3.0 average (mean absolute) deviations was applied, which is approximately equivalent to 2.5 SDs, to estimate the extent of hypoperfusion. This value is similar to the threshold used in other MPS quantification methods (21). The perfusion defect extent was calculated as the percentage of the total surface area of the left ventricle for which test data were below the abnormality threshold.
Ischemic Changes (ISCHs)
After images were registered and normalized, as previously described (5), the stress–rest count difference was derived from the voxels contained within only the stress contour volume, because rest scans were spatially aligned to stress scans. The integrated count differences were then divided by the total rest counts, resulting in a relative count change measure, which we defined as the measure of ischemia (ISCH). This perfusion measurement does not require normal databases and is obtained independently from the TPD measurement. This measure has a character complementary to TPD measurement.
Poststress Ejection Fraction Changes (EFCs)
EFCs have been shown to be helpful in diagnosing CAD (8). However, an exact combination of EFC with perfusion measurements in diagnosing CAD has not been established. Stress and rest left ventricular ejection fraction were automatically calculated using quantitative gated SPECT using gated perfusion images via a volume-based approach as previously described (22). The left ventricular cavity volume was measured as the territory bound by the endocardium and its valve plane for every interval in the cardiac cycle. The end-diastolic and end-systolic volumes were identified using the time–volume curve (22). The differences between stress and rest EF were defined as EFC.
Motion and Thickening Changes (MTC)
The automated regional motion and thickening scores were derived as previously described by our group (23). Regional motion in millimeters was defined as the distance between end-diastolic and end-systolic mid-myocardial surface in the direction normal to the mid-myocardial surface for each polar map location. The thickening at each polar map point in percentage was defined as the increase of myocardial thickness (distance between the endocardial and epicardial surfaces) at the end-systolic phase, compared with the end-diastolic phase, and also in the direction of the mid-myocardial surface normal vector (23). Automated motion and thickening scores were derived with a 17-segment model using normal motion and thickening limits created on the basis of measurements from LLk patients (23). The motion score ranged between 0 and 5: 0, normal; 1, mildly; 2, moderately; 3, severely hypokinetic; 4, akinetic; and 5, dyskinetic. The thickening score ranged between 0 and 3: 0, normal; 1, mildly abnormal; 2, moderately to severely abnormal; and 3, no systolic wall thickening (23). The motion and thickening change scores were calculated separately by subtracting the rest image score from the stress image score.
Visual Analysis
The visual interpretation of MPS images was based on short-axis, horizontal, and vertical long-axis tomograms divided into 17 segments using a quantitative perfusion SPECT interactive 17-segment graph (22). MPS images were scored independently by 2 expert board-certified readers (reader 1 had 30 y and reader 2 had more than 10 y of clinical experience in nuclear cardiology) using a 5-point scoring system (0, normal; 1, mildly decreased; 2, moderately decreased; 3, severely decreased; and 4, absence of segmental uptake). Visual reading was performed with the expert masked to computer-generated myocardial perfusion quantification results or any clinical information, such as patient history. The readers scored both the stress and the rest (17 each) perfusion segments using the 5-point scale. The readers could review stress and rest perfusion data, raw projection data, and gated function data (24). Subsequently, summed stress scores (SSSs) and summed rest scores were calculated by summing the 17-segment stress and rest scores, respectively. In addition, a summed difference score (SDS) was calculated as SSS minus summed rest score. All visual scores were recorded automatically in the batch files and directly converted for the statistical analysis, eliminating manual transfer.
SVM Algorithm
Model Creation
We used an SVM statistical learning algorithm, open-source LIBSVM implementation (11), to combine quantitative perfusion (TPD and ISCH) and functional variables (EFC). In addition, we also combined quantitative perfusion (TPD and ISCH) with functional variables: MTC, absolute stress end-diastolic, and end-systolic volumes. The SVM algorithm has been extensively described in the computer science literature (25,26). Briefly, SVM searches for the optimal division of the feature space (to normal–abnormal) with a hyperplane by maximizing margins (distances) from the plane to support vectors (points closest to the plane). The points positioned clearly outside the hyperplane on 2 sides are discarded by the algorithm when searching for the hyperplane. This method is resistant to overfitting, because only the points close to the hyperplane (decision plane) are considered in the fitting. The distances from the hyperplane are then converted to an estimate of the probability of the outcome category, as described by Chang et al. (11).
In SVM, the training vectors (xi) are mapped into an n-dimensional feature space by the kernel functions. Kernel functions other than linear ones allow nonlinear class boundaries. Mathematically, any kernel function is defined by
Furthermore, for comparison we assessed the diagnostic accuracy of the SVM model using linear kernel function, with d equal to 1 in Equation 2.
Testing
The test-group patients (n = 832) were divided by SVM into 2 categories (CAD and no CAD) in the testing phase. The model defined as described above was validated with the test group. None of the cases used in the model creation was used in the testing phase. The probability estimates returned by SVM were categorized as normal (<0.50) or abnormal (≥0.50). These probability estimates were used to construct receiver-operating-characteristic (ROC) curves.
Definition of Abnormal MPS
Automated Analysis
The SVM threshold was derived automatically during the testing phase. To compare the diagnostic performance of the SVM method to individual features, we used previously established thresholds. A TPD value of ≥3% on a per-patient basis was considered abnormal (12). The ISCH value of ≥3% was considered abnormal on the basis of previously established thresholds (5). An EFC value of ≥5% was considered abnormal based on previously established thresholds (8).
Conventional Coronary Angiography
Conventional coronary angiography was performed according to standard clinical protocols within 60 days of the myocardial perfusion examination. All coronary angiograms were visually interpreted by an experienced cardiologist. Luminal diameter narrowing of ≥50% for the left main coronary artery or ≥70% for the other coronary arteries was considered significant stenosis and was used as the gold standard for the detection of CAD.
Statistical Analysis
Continuous variables were expressed as the mean ± SD, and categoric variables were expressed as percentages. A z test was performed to compare the sensitivity, specificity, and accuracy of the various quantitative variables versus SVM and of SVM versus visual analysis. For all analyses, P values of less than 0.05 were considered statistically significant. ROC curves were analyzed to evaluate the ability of SVM versus various quantitative variables for forecasting ≥70% stenoses of the coronary arteries. In addition, ROC curves were also analyzed to evaluate the ability of SVM classification versus visual scoring for forecasting ≥70% stenoses of the coronary artery. The differences between the ROC areas under the curve (AUCs) were compared using the method of Delong et al. (28).
RESULTS
SVM Versus Quantitative Perfusion and Functional Analysis
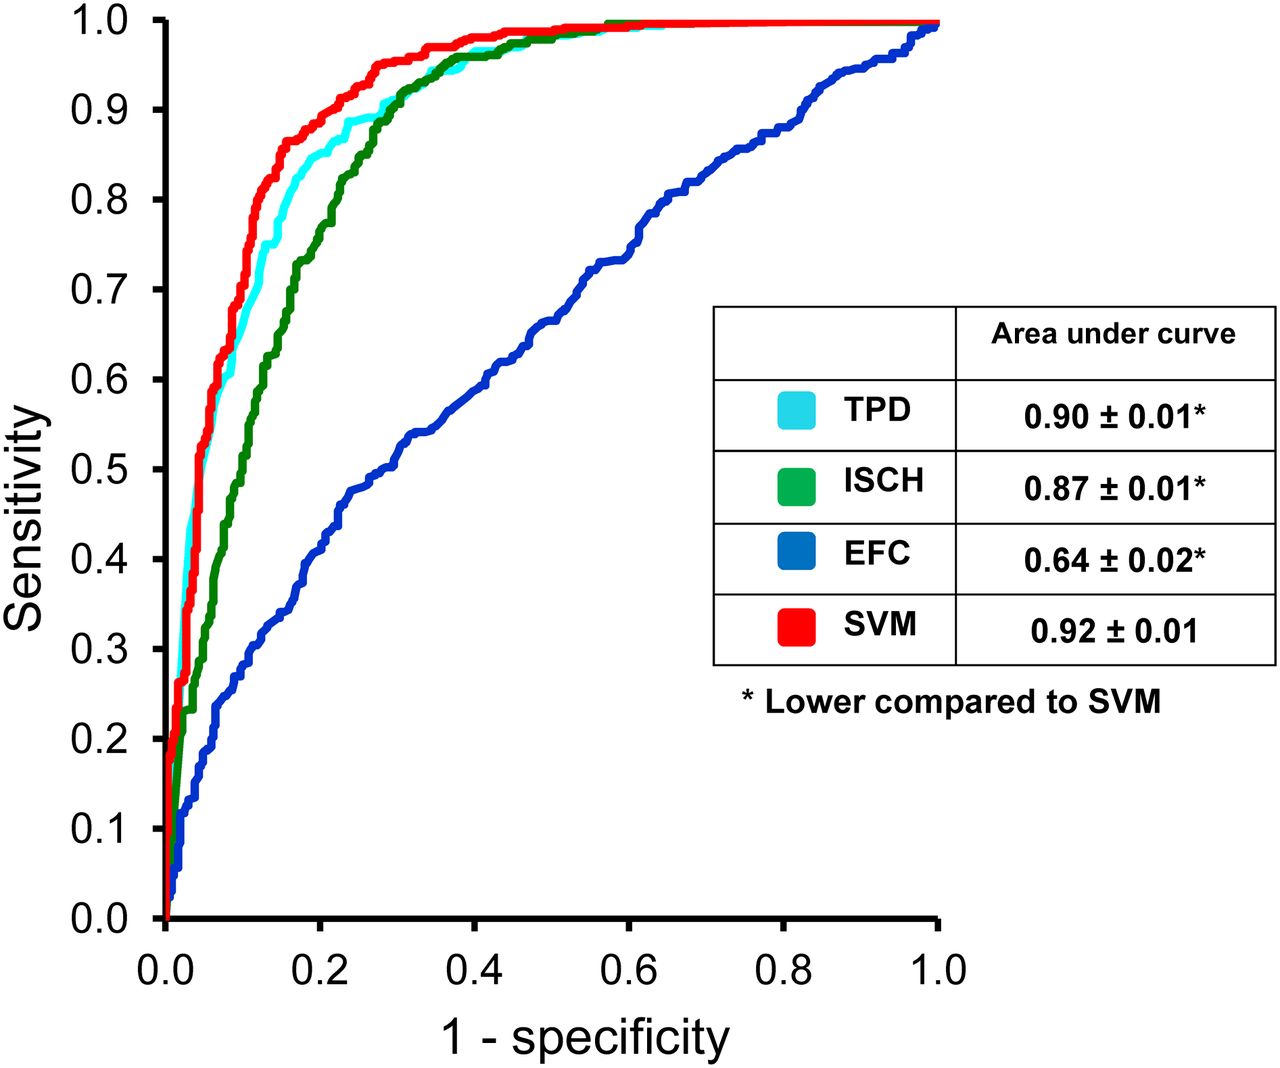
Figure 1 compares the sensitivity, specificity, and accuracy of the quantitative measures TPD, ISCH, EFC, and SVM for the detection of ≥70% CAD on a per-patient basis. When the TPD was compared with the SVM analysis, specificity and accuracy were significantly higher for SVM than for TPD (P < 0.05). The sensitivity, however, was similar between the SVM (84%; 95% confidence interval, 81%–88%) and TPD (85%; 95% confidence interval, 81%–88%) analyses. When ISCH was compared with the SVM analysis, sensitivity and accuracy were significantly higher for SVM than for TPD (P < 0.05). The specificity, however, was similar between the SVM and ISCH analyses. The sensitivity, specificity, and accuracy of SVM were higher than those of EFC (P < 0.05). The ROC curves comparing TPD, ISCH, EFC, and SVM probability estimates are shown in Figure 2. Table 2 also demonstrates the number of patients in whom the diagnosis was correctly changed using SVM versus TPD alone. In most cases, one or both of the other factors (ISCH and EFC) established the correct diagnosis. The ROC AUC was significantly better for SVM probability estimates (0.92) (P < 0.001 for all) than for TPD (0.90), ISCH (0.87), and EFC (0.64) probability estimates.

Sensitivity, specificity, and accuracy of SVM vs. TPD, ISCH, and EFC for detection of ≥70% coronary artery lesions. Red indicates significant difference, compared with SVM (P < 0.05). Error bars indicate 95% confidence interval (CI).

ROC curves comparing Support Vector Machine (SVM) algorithm, Total Perfusion Deficit (TPD), Ischemic Changes (ISCH), and Ejection Fraction Changes (EFC) for detection of ≥70% coronary artery lesions. *Statistically significant difference, compared with SVM (P < 0.001).
Number of Times Diagnosis was Correctly Changed When SVM Was Used Versus TPD
The sensitivity, specificity, and diagnostic accuracy of SVM using linear kernel function (d = 1) for detection of >70% CAD on a per-patient basis was determined. The sensitivity was 89%, the specificity was 77%, and the overall diagnostic accuracy was 82%. When comparing polynomial SVM to linear SVM, the diagnostic accuracy and specificity were significantly higher (P < 0.05), whereas the sensitivity was significantly lower (P = 0.046).
We also assessed the sensitivity, specificity, and diagnostic accuracy of SVM by combining quantitative perfusion (TPD and ISCH) and functional variables: regional MTC, absolute stress end-diastolic, and end-systolic volumes, which are shown in Table 3. The sensitivity of quantitative perfusion with MTC and absolute volumes significantly decreased, whereas the specificity significantly improved when compared with the combined method using quantitative perfusion and changes in ejection fraction, with accuracy remaining approximately the same. In addition, the ROC AUC was not significantly different.
Comparison of SVM Combining Quantitative Perfusion with Different Functional Parameters
SVM Versus Visual Analysis
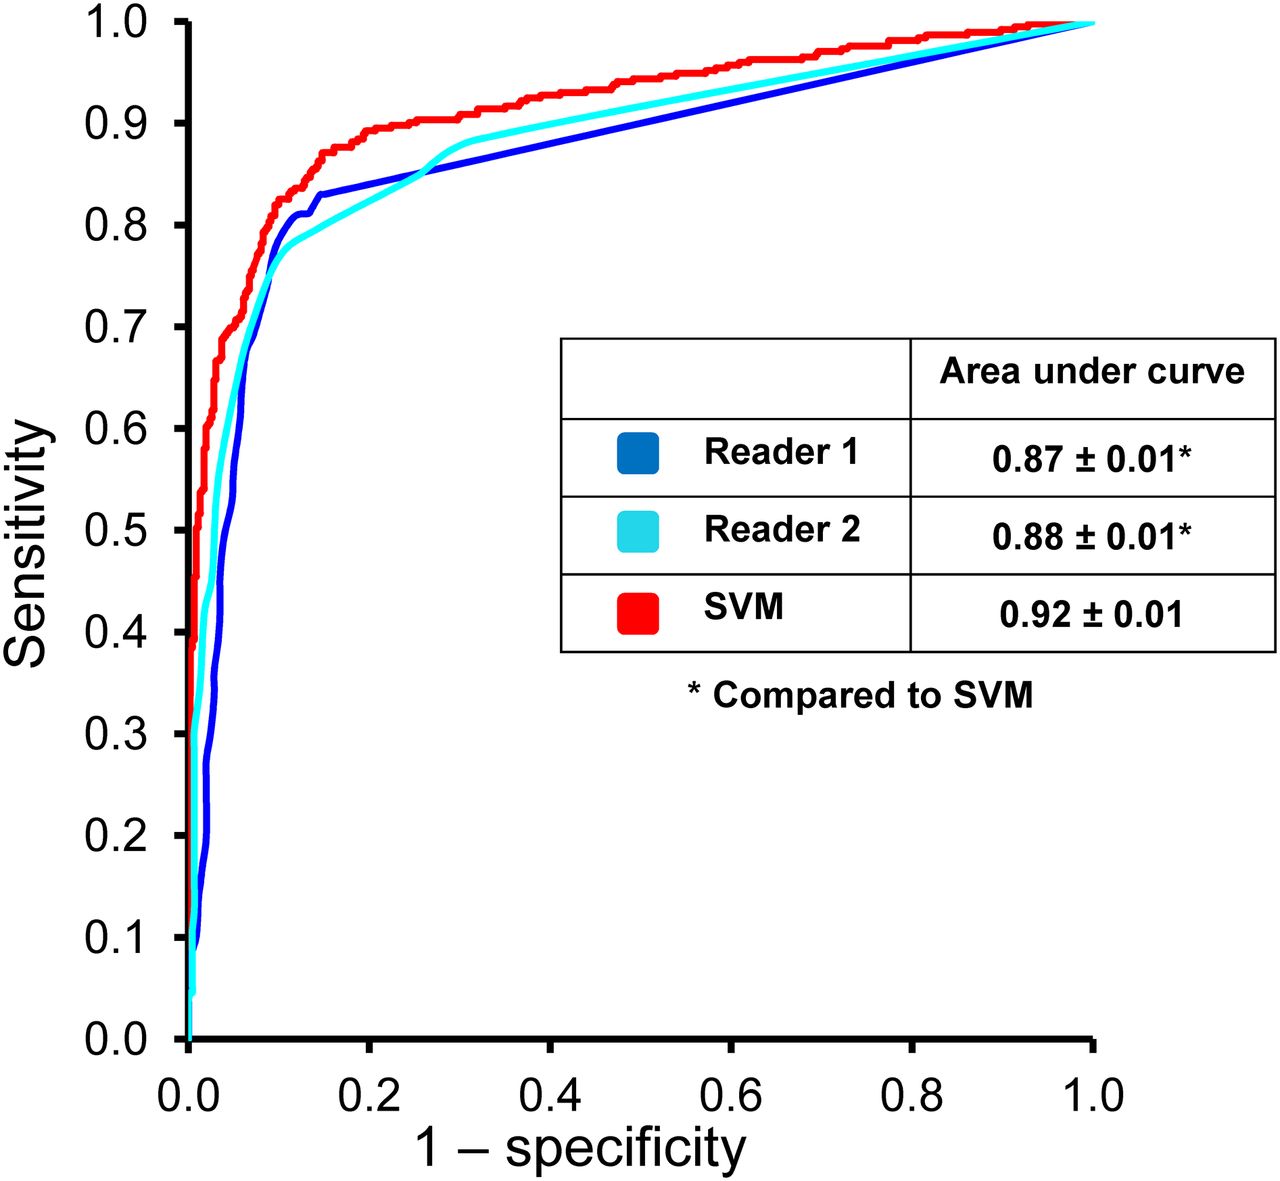
Figure 3 compares the sensitivity, specificity, and accuracy of SVM with those of readers (SSS) for the detection of ≥70% CAD on a per-patient basis. The sensitivity, specificity, and accuracy of SVM were comparable to those of reader 1. When compared with reader 2, the sensitivity of SVM was significantly better (P < 0.05). The specificity and diagnostic accuracy of SVM were similar to those of reader 2. The ROC curves comparing SVM and the 2 visual readers are shown in Figure 4. The ROC AUC for SVM probability estimates were significantly better (P < 0.03) than those for both readers. In addition, we compared the sensitivity, specificity, and accuracy of SVM with SDS in Figure 3 for the detection of ≥70% CAD on a per-patient basis. These values were not significantly different from those obtained using SSS.
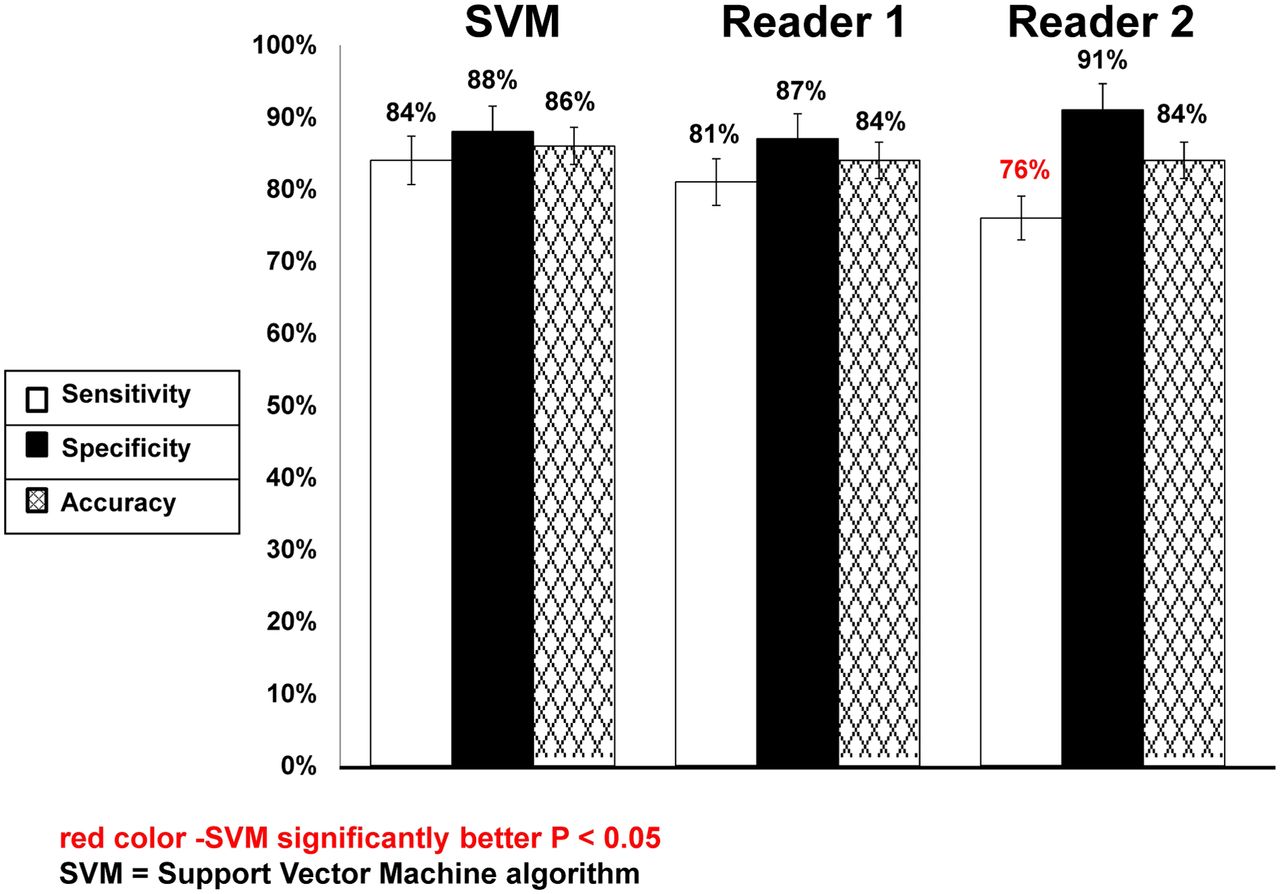
Sensitivity, specificity, and accuracy of SVM vs. visual analysis (SSS and SDS) for detection of ≥70% coronary artery lesions. Red indicates significant difference, compared with SVM (P < 0.05). Error bars indicate 95% confidence interval (CI).

ROC curves comparing Support Vector Machine (SVM) algorithm and visual analysis by 2 readers for detection of ≥70% coronary artery lesions. *Statistically significant difference, compared with SVM (P < 0.05).
DISCUSSION
In this study, we were able to demonstrate significant improvement in diagnostic accuracy for the detection of obstructive CAD using the SVM algorithm, which combined quantitative perfusion and functional variables. There has been significant interest in improving the overall diagnostic performance on MPS, in hopes of identifying individuals with significant CAD who might benefit from earlier intervention and preventing unnecessary invasive evaluations in patients with false-positive MPS findings (21). Although individual quantitative measurements have previously been used for the diagnosis of obstructive CAD (5,8,15), to our knowledge, this was the first study indicating improvement in diagnostic accuracy of MPS using learning algorithms that combine multiple features.
Statistical learning algorithms have been used in cardiovascular medicine to predict multiple features including those putting a patient at increased risk of decompensated heart failure (29) and predictors of onset of atrial fibrillation (30). Prior studies have demonstrated that quantitative analysis can be a useful supplement to the visual analysis (31,32), providing an accurate and objective method for the assessment of the extent, severity, and reversibility of perfusion defects. The ability to combine multiple quantitative features could further enhance the value of quantitative MPS tools for the diagnosis of obstructive CAD. In this study, we demonstrated that the combination of SVM with the currently available automated software improves significantly the overall diagnostic accuracy of the quantitative analysis system. To our knowledge, this is the first report of SVM application for this purpose.
We also compared the diagnostic accuracy of SVM using different quantitative perfusion and functional analyses. The combination of quantitative perfusion and regional MTC using SVM resulted in a significant decline in sensitivity, significant improvement in specificity, and similar accuracy. These findings are consistent with prior studies demonstrating a decline in sensitivity and improvement in specificity when using regional functional data (33). Therefore, it appears that changes in both global and regional wall motion between stress and rest provide incremental diagnostic value when the SVM combined method is used; however, global ejection fraction may be a more reasonable approach in view of the fact that both specificity and accuracy improve without a significant decline in sensitivity.
We compared the diagnostic accuracy of SVM with that of 2 experienced visual readers. Prior studies have shown less variability for automated analysis than for semiquantitative analysis (34), especially when compared with less experienced readers (35,36). The diagnostic accuracy of SVM, combining multiple quantitative features, was at least comparable to 2 experienced readers from high-volume centers. Therefore, SVM analysis might play an integral role as an automated tool to suggest diagnostic classifications (and potentially the degree of confidence in the decision) for readers who may be less certain about normal variations in uptake (37). The SVM library could be easily integrated with standard quantitative nuclear cardiology tools (the SVM library is freely available and can be distributed with other software). SVM probability estimates have a simple intuitive interpretation, and this advantage can facilitate clinical acceptance and allow a measure of the confidence in the proposed classification.
This study had several limitations. Coronary angiography, which has known constraints, was used as the gold standard for this study. The degree of stenosis was interpreted visually rather than quantified, potentially causing an overestimation of stenosis. Patients with LLk CAD were included in our analysis and were considered to have normal results, however, this was necessary to provide a balanced set for the SVM. Furthermore, integration using SVM was applied to a population with suspected but not known CAD. However, the detection of CAD is typically useful only in this group. In the current study, we excluded patients with a prior history of CAD and significant valve disease; therefore, the results of this study might not be applicable to these patients. We selected only a limited number of quantitative features to demonstrate proof of concept and prevent overfitting in large feature space. However, even with such a limited number of features, we could demonstrate significant improvement in diagnostic accuracy. In addition, we used a binary classification (normal vs. abnormal) both for visual and for automatic analysis. Further studies are likely needed to define the value of multiple categories classification based on the portability estimates in the context of disease detection. Furthermore, although the splitting of training and testing groups was consistent with our internal experience, future studies using different training arrangements may be needed to further evaluate this proof of concept. Finally, although we had a large patient population, the results were obtained on only 1 particular camera system. Therefore, further multicenter evaluations will be required to confirm these results.
CONCLUSION
Computational integration of several quantitative perfusion and functional variables by the SVM approach allows improvement of the diagnostic accuracy and specificity of MPS. In addition, the diagnostic accuracy of SVM was at least comparable to the accuracy of visual analysis and can potentially outperform visual assessment based on ROC comparisons.
DISCLOSURE
The costs of publication of this article were defrayed in part by the payment of page charges. Therefore, and solely to indicate this fact, this article is hereby marked “advertisement” in accordance with 18 USC section 1734. This research was supported in part by grant R01HL089765 from the National Heart, Lung, and Blood Institute/National Institutes of Health (NHLBI/NIH). The content of this article is solely the responsibility of the authors and does not necessarily represent the official views of the NHLBI. Cedars-Sinai Medical Center receives royalties for the quantitative assessment of function, perfusion, and viability, a portion of which is distributed to some of the authors of this manuscript. No other potential conflict of interest relevant to this article was reported.
Acknowledgments
We thank Dr. Caroline Kilian and Arpine Oganyan for editing and proofreading the manuscript.
Footnotes
Published online Mar. 12, 2013.
- © 2013 by the Society of Nuclear Medicine and Molecular Imaging, Inc.
REFERENCES
- Received for publication July 30, 2012.
- Accepted for publication October 10, 2012.


Jump to section
Related Articles
Cited By...
- Explainable Deep Learning Improves Physician Interpretation of Myocardial Perfusion Imaging
- Quantitative clinical nuclear cardiology, part 2: Evolving/emerging applications
- Relationship Between Quantitative Adverse Plaque Features From Coronary Computed Tomography Angiography and Downstream Impaired Myocardial Flow Reserve by 13N-Ammonia Positron Emission Tomography: A Pilot Study