


Abstract
To be a reliable predictor of response, 18F-FDG uptake should reflect changes in the amount of viable tumor cells. However, 18F-FDG also accumulates in inflammatory cells. Shortly after treatment, the influx of inflammatory cells in the tumor can therefore interfere with early response evaluation. The aim of this study was to investigate whether this inflammation is suppressed by the administration of corticosteroids and, in turn, can improve the correlation of 18F-FDG uptake with tumor cell kill. Methods: Severe combined immunodeficiency mice were inoculated subcutaneously with Daudi cells. When the tumor measured 15 mm, mice were divided in 2 groups treated with 1 single dose of cyclophosphamide, 125 mg/kg (group A) or cyclophosphamide followed by hydrocortisone (0.2 mg/d) for 5 d (group B). The change in 18F-FDG uptake was evaluated with small-animal PET (5 mice/group) on D+6, D+9, D+13, and D+16 (days after treatment). At each time point, 4 mice per group were sacrificed for quantification of the different tumor cell fractions by flow cytometry and histopathology. Changes in 18F-FDG uptake were correlated with inflammation and viable tumor cells. Results: Cyclophosphamide administration resulted in a steady reduction in viable cell fraction until D+9 (reduction from baseline, −64%). The viable cell fraction increased again on D+13. A transient influx of inflammatory cells was seen from D+6 to D+13 (peak on D+9, 24% of total cell fraction). After hydrocortisone administration, a similar reduction in the viable cell fraction was seen. The inflammatory response was less pronounced but developed with earlier kinetics (peak on D+6 [15% of total cell fraction], almost resolved on D+9) and consisted primarily of granulocytes instead of mononuclear cells in the absence of corticosteroids. In both groups, a significant reduction in 18F-FDG uptake was seen until D+6. On D+9, a transient increase in 18F-FDG uptake was seen in group A, whereas a further decrease was observed in group B. Conclusion: After corticosteroid administration, the contribution of inflammatory cells to the 18F-FDG uptake was less important than that in mice treated with chemotherapy alone. The earlier, but weaker, inflammatory response after corticosteroid administration consists primarily of granulocytes instead of mononuclear cells.
The evaluation of early response to therapy is difficult to assess by conventional radiographic modalities because reduction of tumor volume is a late sign of effective therapy. Therefore, anatomic imaging modalities, using size criteria, are less suitable for early evaluation of response assessment and persisting viable tumor tissue. This is especially important in malignancies that are highly sensitive to treatment with chemotherapy and radiotherapy, for example lymphomas, where substantial long-term cure rates are expected and where early salvage therapy can improve the patient's outcome in case of resistance to the first-line therapy. However, this success leads to an increase in long-term side effects, for example secondary tumors. Therefore, there is a strong need for tailoring the intensity of treatment to individual patients on the basis of early response assessment, as this may avoid the administration of several chemotherapeutic cycles with limited efficacy and may allow an early switch to a second-line therapy.
During the last few years, several clinical studies have demonstrated that 18F-FDG PET significantly improves the accuracy of initial staging, management of recurrent cancer, and monitoring of therapy response of lymphoma (1–4). 18F-FDG PET is a functional imaging technique that reflects the glycolytic rate of tissues and has been used to measure the increased metabolic demand in tumor cells. Currently, the use of PET for response assessment is changing from evaluation at the end of treatment to prediction of tumor response early during the course of therapy. However, early after the initiation of therapy, it is not uncommon to see residual 18F-FDG uptake in the tumor mass, and cutoff values (percentage decrease from baseline or amount of residual uptake) will probably be necessary to differentiate responders from nonresponders. To be a reliable predictor of response, 18F-FDG uptake should reflect changes in the amount of viable tumor cells. However, the rapid decrease in tumor glucose metabolism after effective therapy is only partially concordant with 18F-FDG uptake in viable tumor cells. The inflammatory stromal cells, which appear as a result of chemotherapy or radiotherapy, also show a high intracellular accumulation of 18F-FDG and may even show a higher uptake than that of the viable tumor cells, making it difficult to correctly estimate the viable tumor fraction (5). The aim of this study was to evaluate whether the administration of corticosteroids can suppress this inflammatory reaction and, in turn, improve the correlation of PET response and tumor cell kill.
The experiments were performed using a previously validated mouse model in which severe combined immunodeficiency (SCID) mice were inoculated subcutaneously with Daudi B-cells, a human lymphoma cell line derived from a Burkitt lymphoma (6). All mice were treated with cyclophosphamide, and half of the number of mice also received hydrocortisone over 5 d, analogous to the present standard therapy in humans.
MATERIALS AND METHODS
Animal Model
SCID mice (C.B-17/Icr scid/scid) were bred under germ-free conditions. There are no functional B- and T-cells in these mice, but there is a normal myeloid differentiation and maturation of natural killer (NK) cells. Male and female mice were used at random. Six-week-old mice were inoculated subcutaneously with 5 × 10⁶ Daudi cells in the right thigh. The human B-lymphoblast cell line Daudi, derived from a Burkitt lymphoma, was a kind gift from Prof. Jan Balzarini (Rega Institute for Medical Research, Leuven, Belgium). This cell line was originally obtained from the American Tissue Culture Collection. Developing tumors were measured every 2 d. Treatment was started when the tumors reached a diameter of 15 mm. All animals were treated following institutional guidelines, and experiments were approved by the local ethical committee for animal experiments.
Experimental Design
Seventy-one mice were used for analysis (Table 1). Six mice were sacrificed after small-animal PET, when their tumor diameter had reached 15 mm, without receiving any treatment. Their tumors were dissected for flow cytometry (n = 4) and histopathology (n = 2), and these results were used as reference values (day 0).
Flow Chart of Experimental Design
The other 65 mice were divided into 2 treatment regimens. The first group (group A, n = 30) was treated with a single dose of cyclophosphamide (Endoxan; Baxter), 125 mg/kg intraperitoneally, on day 0 (D0). The second group (group B, n = 35) received cyclophosphamide, 125 mg/kg intraperitoneally, on D0, and hydrocortisone (Solu-Cortef; Pfizer), 0.2 mg intraperitoneally, for 5 d (D0 to D+4, administered between 9:00 am and 11:00 am) (7).
18F-FDG uptake over time was evaluated by serial small-animal PET (5 mice in each group) on D0 (before treatment), D+6, D+9, D+13, and D+16. After their last scan (D+16), these mice were sacrificed and their tumor was dissected for flow cytometry or histopathology.
Four mice of each group were sacrificed after small-animal PET on D+2, D+4, D+6, D+9, and D+13, and their tumors were dissected for flow cytometry. One mouse in group A and 2 mice in group B were sacrificed on D+2, D+4, D+6, D+9, and D+13, and their tumors were dissected for histopathology.
Small-Animal PET Scanning
After overnight fasting, small-animal PET was performed using a Focus 220 microPET (Siemens Medical Solutions USA, Inc.). The spatial resolution of this PET system is 1.6 mm, and acquired images were reconstructed with ordered-subsets expectation maximization. Simulations with spheres of different diameters using these settings showed that the effects of partial volume on 18F-FDG uptake are minimal in lesions with a diameter larger than 3 mm.
After sedation by gas anesthesia (isoflurane, Forene; Abbott), tumor dimensions were measured (by caliper), and body weight and glycemia were determined. Sixty minutes after injection of 8–11 MBq 18F-FDG via a tail vein, small-animal PET was performed (10 min), on a single bed position with the tumor in the center of the field. All animals received an intramuscular injection of furosemide (40 mg/kg, Lasix; Aventis) in the contralateral thigh at the same time as the tracer injection to reduce reconstruction artifacts caused by the high concentration of 18F-FDG in the urine, and the bladder was carefully emptied before scanning.
Determination of Different 18F-FDG PET Parameters
In the 10 mice that were used for serial follow-up (5 mice in group A and 5 in group B), the mean standardized uptake value (SUVmean), the maximal SUV (SUVmax), and the metabolic tumor volume (Volmetab) were measured at each time point. SUVs were automatically calculated using the formula SUV = measured activity concentration in the tumor (Bq/g) × body weight (g)/injected activity (Bq). Volume contouring was done on a visual basis (3-dimensional isocontour), with in-house software (8). The total lesion glycolysis (TLG) was defined as SUVmean × Volmetab. The change in TLG (ΔTLG) was calculated and expressed as a percentage of the baseline TLG on D0: ΔTLG = (TLGx − TLG0)/TLG0 × 100, with TLGx being the 18F-FDG uptake on day x (9). The percentage decreases in SUVmean, SUVmax, and Volmetab were calculated in an analogous way. Whereas SUVs represent the density of cells in a certain tumor volume (cell fraction), TLG provides a measurement of the total 18F-FDG uptake in the whole tumor lesion (absolute number of cells). To correct for differences in administered dose (paravenous injections became more frequent after several injections in the same mouse), all SUVs were normalized by dividing SUVs of the tumor by the corresponding SUVmean of a standard region in the liver (10).
In sacrificed mice, the 18F-FDG activity in the tail was measured, decay-corrected, and subtracted from the initially injected dose. SUVs were further calculated in an analogous way. After dissection, the activity in the tumor was counted in a well counter (Wizard; Wallac).
Flow Cytometry
To allow comparison of the different contributing cell fractions with 18F-FDG uptake, mice were sacrificed by decapitation a few minutes after small-animal PET. The tumor was carefully dissected and was teased apart to obtain single cell suspensions suitable for flow cytometry (Becton Dickinson immunocytometry systems).
Cells (1 × 10⁶ cells/sample) were stained with Peridinin–chlorophyll–protein (PerCP)-conjugated antihuman CD45 monoclonal antibody ([mAb] Becton Dickinson) and fluorescein isothiocyanate (FITC)-conjugated antimouse CD45 mAb (Serotec) to calculate the number of cells contributed by the human tumor cells versus the stromal mouse cells. A second sample was stained with annexin-V−FITC and propidium iodide (PI) (Clontech). Necrotic cells are PI positive and annexin-V positive, whereas apoptotic cells are annexin-V positive and PI negative (6). Flow cytometry was performed by a fluorescence-activated cell sorter to acquire the cell fraction composition for each tumor (Cellquest software; Becton Dickinson Bioscience). From further measurements (not shown), we learned that the mouse CD45-positive fraction consisted almost exclusively of viable cells and that with the human CD45 mAb the measured composition consisted of viable and apoptotic and necrotic human cells. Therefore, the percentage of viable tumor cells was calculated as the percentage of human cells minus the sum of apoptotic and necrotic cells.
In some mice (2 nonsteroid- and 2 steroid-treated mice on D+2, D+4, D+6, and D+9), we also performed supplementary experiments for further differentiation of the inflammatory response. By gating on the mouse CD45- positive cells, we further differentiated F4/80-positive cells (macrophages), Ly6 (Gr-1)-positive cells (granulocytes) (11), and NK1.1-positive cells (NK cells).
Histology
After careful dissection, the tumors were fixed and embedded in paraffin. Sections were stained with hematoxylin and eosin, and immunostaining was performed using CD20 mAb, a pan B-cell marker to identify the human tumor cells. The sections were also stained with Ki67 (Mib-1) for identification of proliferating cells.
Tumors were semiquantitatively scored for CD20-positive tumor cells, Ki67-positive cells, apoptotic/necrotic cells, inflammatory cells, and fibrosis (−, almost no cells; +, some cells; ++, lots of cells; and +++, almost all cells).
Statistics
For each time point, the mean ± SEM of the different variables (SUVs, viable tumor cells, stromal host cells, necrotic and apoptotic cells) in both treatment groups were calculated and expressed graphically. A 2-tailed P value of P ≤ 0.05 was considered statistically significant. When a significant difference between the 2 groups was suspected, unpaired Student t tests were performed. Bonferroni correction was subsequently used to reduce falsely significant results when multiple comparisons were suspected, and corrected P levels were reported as Pcorrected. To compare overall reduction in 18F-FDG between both groups over time, the area under the curve (AUC) of the different 18F-FDG PET parameters was calculated and compared with the unpaired Student t test.
RESULTS
Flow Cytometry
Our experiments measured the viable tumor cell fraction and the inflammatory mouse cells. The response of the different cell fractions to chemotherapy is detailed in Figure 1. The administration of cyclophosphamide resulted in a steady reduction of the viable tumor cell fraction already clear on D+2 and D+4 after therapy, with a maximal reduction of the viable tumor fraction on D+9 (27% viable tumor cells or −64% compared with baseline). The viable tumor fraction increased again on D+13. A transient, massive influx of inflammatory mouse cells was seen from D+6 to D+13, with a peak of 24% of the total cell fraction on D+9, whereas the amount of these cells at baseline was only negligible.

Evolution of viable tumor cells (A) and stromal mouse cells (B) as measured by flow cytometry in mice treated with chemotherapy (▪, group A) and mice treated with chemotherapy and hydrocortisone (□, group B) and expressed as mean percentage ± SEM. x-axis: different time points (days after treatment); y-axis: percentage cell fraction out of total, as measured by flow cytometry. *Significant differences after Bonferroni correction between both treatment groups.
When hydrocortisone was added over 5 d (group B), a similar reduction in the viable cell fraction and a similar increase in the necrotic cell fraction were observed with respect to group A. However, the inflammatory response developed earlier, with a peak on D+6, but was less pronounced (16% of total cell fraction). On D+9, there was already an important decrease in the inflammatory cell fraction in contrast to the still rising amount of inflammatory cells in group A at the same time point. Differences in the inflammatory cell fraction at both time points were significant with P = 0.007 on D+6 (5.7% in group A vs. 16.0% in group B) and P = 0.01 on D+9 (24.4% vs. 11.0%) using an unpaired Student t test and after Bonferroni correction (Pcorrected ≤ 0.01). On D+13, the inflammatory cell fraction had returned almost to baseline values and was similar in both groups.
No representative cell suspensions for flow cytometry could be obtained on D+16, because there was only a small amount of tumor tissue that could not be differentiated from surrounding fibrosis.
Serial Follow-up by Small-Animal PET Scanning
On D+6, there was a fast decrease in all measured parameters on small-animal PET in both treatment groups, in parallel with the reduction in the viable tumor cell fraction (Figs. 2A and 2B). In group A, the initial decrease in SUVmean and SUVmax was followed by a stabilization and a mild increase on D+9, despite a further reduction in the viable tumor cell fraction. In group B, the initial decline in SUVmean and SUVmax was followed by a further decrease on D+9, however, more limited. There seemed to be a difference at the P ≤ 0.05 level in ΔSUVmax on D+9 between both groups (P = 0.032; −48.6% vs. −71.0%) as well as in ΔTLG on D+9 (P = 0.017; −88.0% vs. −94.7%), but this was not significant after Bonferroni correction (Pcorrected ≤ 0.0125). There was also a tendency toward a difference in decline in ΔSUVmean and ΔVolmetab (P = 0.053 and P = 0.060). Time–activity curves in group B were significantly lower compared with those in group A (P = 0.023 and P = 0.034 for AUC ΔSUVmax and AUC ΔTLG).

(A) Serial small-animal PET images in the same mouse on D0 (before chemotherapy) and on D+6, D+9, D+13, and D+16 after treatment. (B) Evolution in SUVmean, SUVmax, Volmetab, and TLG as measured by serial small-animal PET scanning in mice treated with chemotherapy (▪, group A; n = 5) compared with mice treated with chemotherapy and hydrocortisone (□, group B; n = 5) and expressed as mean ± SEM. *Significant at P ≤ 0.05 level by unpaired Student t test.
On D+13 and D+16, there was no significant difference between both groups. On D+16, tumor diameters had dramatically shrunken and this may have led to artificially lower SUVs due to partial-volume effects, which are not relevant on the other evaluated time points.
Ex vivo evaluation of 18F-FDG uptake, as counted in the well counter, was very similar to the results of small-animal PET (results not shown). There was also no systematic difference in the glucose levels between mice that received steroids compared with mice that received only chemotherapy. Glucose correction did not change the curves of measured PET parameters and resulted in the same conclusions as noncorrected PET results.
Histopathology
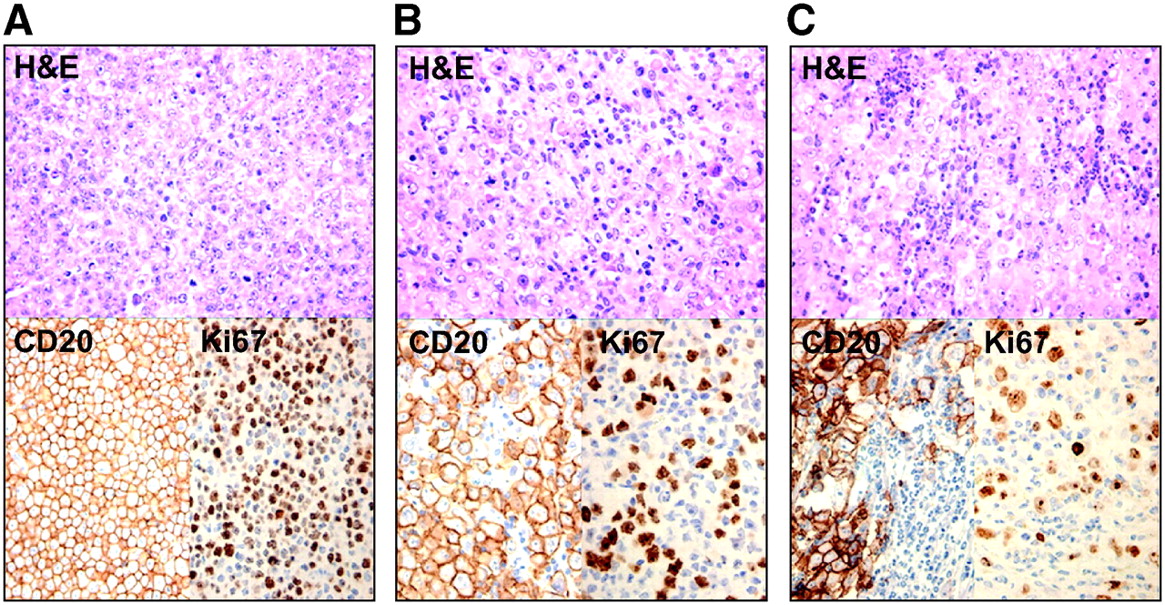
In untreated animals, tumors were composed of a massive proliferation of CD20-positive cells with a high proliferation rate (Ki67 highly positive) and the presence of multiple mitotic figures (Table 2; Fig. 3A). Almost no stromal reaction is found, with very few mononuclear cells and virtually no polymorphonuclear cells.

Histopathologic sections on D0 (before treatment) and on D+9 after treatment after staining with hematoxylin and eosin (H&E) and immunostaining with anti-CD20 and Ki67. (A) Histology on D0 shows high density of CD20-positive tumor cells, with high proliferation rate. (B) D+9 in group A: diffuse stromal reaction of primarily mononuclear cells. (C) D+9 in group B: influx of primarily granulocytes.
Semiquantitative Analyses of Histologic Sections in Groups A and B
After chemotherapy, there is a rising level of apoptotic/necrotic cells from D+4 and D+6. This phase is marked by the appearance of an increasing number of nonneoplastic mononuclear cells. These cells reached a peak on D+9, whereas their peak decreased a few days later to be replaced by fibrosis. On D+16, only some small islands of viable tumor cells were visible. In group B, results were very similar, except that we observed an influx of primarily polymorphonuclear cells on D+9 instead of a mainly mononuclear infiltration in group A (Figs. 3B and 3C).
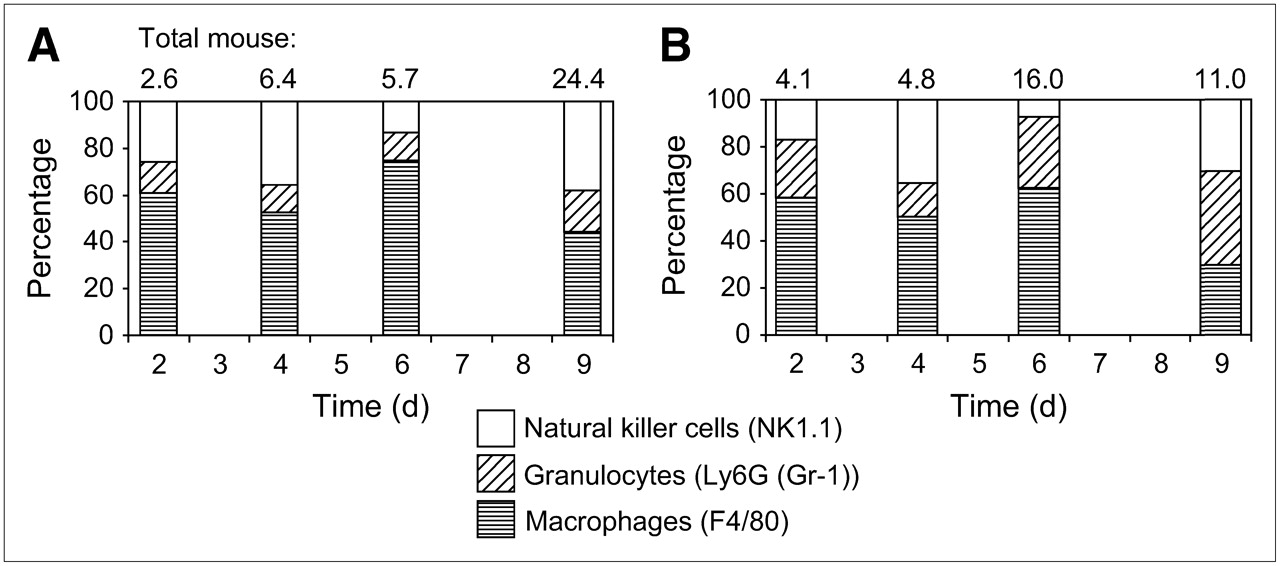
To confirm these results, we performed supplementary flow cytometry for further differentiation of the stromal reaction (Fig. 4). We counterstained mouse CD45-positive cells with phycoerythrin-conjugated F4/80 (macrophages), Ly6 (Gr-1) (granulocytes), and NK1.1 (NK cells). We observed a change in the proportion of macrophages/granulocytes, with a shift from mainly macrophages in group A to a mainly polymorphonuclear infiltration in group B. Given the small number of samples (only 2 samples per time point), we did not perform a statistical analysis on these data.

Subdivision of inflammatory reaction in NK cells (NK1.1), granulocytes (Ly6G (Gr-1)), and macrophages (F4/80) as measured by flow cytometry and expressed as percentage of total stromal host cells over time (2 mice per time point) in group A (A) and group B (B).
DISCUSSION
Several clinical studies have shown that 18F-FDG PET is a useful technique for chemotherapy monitoring. This finding is based on a rapid and significant decrease in tumor glucose metabolism early after chemotherapy, before any change in tumor size. However, this decrease is only partially concordant with the decrease in 18F-FDG uptake in viable tumor cells. The administration of chemotherapeutic agents leads to apoptosis/necrosis of tumor cells, provoking an inflammatory response of the host that leads to an increase in 18F-FDG uptake. Kubota et al. (5) was the first to observe that 18F-FDG uptake was similar in inflammatory cells and in viable tumor cells. Therefore, one should consider not only the tumor cells but also the nonneoplastic cells in a tumor lesion. Previous experiments in our tumor model confirmed this phenomenon and showed that this leads to an overestimation of viable tumor tissue (6). The effect of corticosteroids on this inflammatory reaction was not yet assessed, although most clinically used chemotherapeutic regimens contain high doses of corticosteroids. To our knowledge, this study is the first to demonstrate the effect of corticosteroids on the inflammatory reaction in tumor lesions in a known tumor mouse model and with in vivo 18F-FDG small-animal PET.
Two conclusions may be drawn from small-animal PET measurements. First, the reduction in 18F-FDG uptake measured by the different PET parameters was more important in steroid-treated mice, resulting in a response curve that was systematically located below the curve of the nonsteroid regimen. This may correspond to the known lympholytic effect of steroids, especially in lymphoma, leading to a more pronounced tumor response. Second, SUVs tended to increase on D+9 after chemotherapy, and this effect is suppressed by the administration of steroids, suggesting a lower 18F-FDG uptake caused by the inflammatory influx in steroid-treated mice.
Flow cytometric analyses were performed for evaluation of the different cell fractions that contribute to the observed 18F-FDG uptake. During the first 6 d after chemotherapy, the decrease in SUVs represents very well the decrease in the viable tumor cell fraction, primarily the only cell population at that time. On D+9 after the administration of cyclophosphamide, there was a transient stromal reaction, and SUVs tended to increase, although a further decrease in the viable cell fraction was seen. However, the increase of SUVs was mild, which is probably due to the fact that the loss of viable tumor cells on D+9 outweighs the infiltration of inflammatory cells. These results correspond very well with the results reported by Spaepen et al. (6), validating our technique and our reproducibility.
Administration of steroids for 5 d resulted in a suppression of the peak inflammatory reaction on D+9, corresponding to a suppressed 18F-FDG uptake on that day. However, steroid administration also resulted in an increased stromal reaction at earlier time points (D+6). The stromal reaction as seen after cyclophosphamide administration was changed under the influence of corticosteroids, with a shift from a mononuclear reaction to a predominately granulocytic reaction. This shift can be explained by the properties of steroids to provoke a mobilization and activation of granulocytes, leading to a higher level of circulating granulocytes and a higher and faster penetration into the tumor lesion, as shown by Maruyama et al. (12).
In contrast to the stimulating effect on granulocytes, there is a reported inhibitory effect of steroids on the differentiation of macrophages (13), monocytes (14), lymphocytes (15,16), and NK cells (17,18) and on the access to an inflammatory site. Macrophages and monocytes play an important role, as they are involved in the clearance of cellular debris and apoptotic cells and are, therefore, responsible for a substantial amount of the stromal reaction. The upregulation of granulocytes and the downregulation of mononuclear cells can explain the changing macrophage/granulocyte ratio that was observed on histology and confirmed by flow cytometry. As different types of leukocytes are marked by a different glucose metabolism, a changed composition of the inflammatory influx under steroid administration can result in an altered 18F-FDG uptake (19).
Several authors have shown that 18F-FDG uptake in leukocytes is strongly dependent on their level of activation and on complex interactions between cells (20–22). Granulocyte function is relatively refractory, whereas monocyte/macrophage function is particularly suppressed by corticosteroids (23). Therefore, it is plausible that 18F-FDG uptake in the steroid-treated mice is influenced not only by the amount and type of cells but also by a changed activation state of the leukocytes.
The choice for cyclophosphamide as the cytotoxic treatment was inspired by the administration of this drug in clinical settings, but we are aware that this compound also has an immunosuppressive effect (24). It is possible that this also affects the stromal reaction in our tumor model, but there is no evidence that this effect is different in steroid- and nonsteroid-containing regimens.
Similar to the results of Spaepen et al. (6), we found no clear differences in the apoptotic cell fraction under chemotherapy, and the necrotic cell fraction—though increasing after chemotherapy—showed a rather large variability. The mechanical stress these cells undergo—caused by the mechanical teasing apart of the cells—and the delay between excision of the tumors and flow cytometry probably induced a certain degree of spontaneous apoptosis and necrosis. As the measurements of necrosis and apoptosis are directly reflected in the calculation of the viable tumor cell fraction, this may also explain the absence of a clear difference between the viable cell fraction in the nonsteroid- and the steroid-containing regimen (Fig. 1A), despite the differences in 18F-FDG uptake. Measurement of the inflammatory mouse fraction does not have this limitation; therefore, we based our conclusions primarily on the results of the inflammatory mouse fraction as well as on the histologic sections.
Our tumor model involves an immunodeficient animal (SCID mice) without a functional T- or B-cell compartment. Therefore, it is not possible to evaluate the lymphocytic cell fraction, and our data cannot be generalized to immunocompetent mice or humans. Despite these limitations, these mice have a normal macrophage, granulocyte, and NK function, and an inflammatory reaction was shown in this tumor model in earlier experiments (6). However, immunodeficient animals are inherent to the study of human cell lines in vivo, and no lymphoma model in immunocompetent mice has been described. Our hypothesis is that results in immunocompetent mice will be more dramatic, because of a more important inflammatory response, but will lead to the same conclusions.
Although there is no consensus yet on what the thresholds should be for early therapy response assessment by 18F-FDG PET, guidelines have been proposed already by the European Organization for Research and Treatment of Cancer (EORTC) PET group (25) and were used in clinical trials to define early PET response. According to the EORTC PET group, a decrease in the SUV from baseline of at least 15% after 1 cycle and 25% after several cycles is necessary to obtain a partial response. In this context, a transient influx in inflammatory cells—even if it accounts for a rather mild increase in 18F-FDG uptake—can be of importance, as well as the effect of steroids, which are often part of the treatment regimen in lymphoma patients.
CONCLUSION
The administration of corticosteroids resulted in a suppression of the 18F-FDG uptake caused by the inflammatory influx on D+9 after cytotoxic treatment. The earlier, but weaker, inflammatory response after corticosteroid administration has another composition, with a shift from mononuclear cells to primarily granulocytes. Therefore, early after chemotherapy, the results of 18F-FDG uptake obtained in nonsteroid-containing regimens should be carefully revalidated in steroid-containing regimens because of the possible effects of a changing inflammatory reaction.
Acknowledgments
This work was supported in part by grant G.0177.04 from the Flemish Fund for Scientific Research (FWO Vlaanderen) and the Foundation Emmanuel van der Schueren. Lieselot Brepoels is a Research Assistant of the FWO and Peter Vandenberghe is Senior Clinical Investigator of the FWO Vlaanderen. The authors gratefully thank Prof. Jan Balzarini for his assistance with the tumor model and Peter Vermaelen, Werner Scheers, and Sabine Fevery for their technical support.
Footnotes
-
COPYRIGHT © 2007 by the Society of Nuclear Medicine, Inc.
References
- Received for publication July 7, 2006.
- Accepted for publication November 27, 2006.


Jump to section
Related Articles
Cited By...
- Hypermetabolism in 18F-FDG PET Predicts Favorable Outcome Following Decompressive Surgery in Patients with Degenerative Cervical Myelopathy
- Tumor Response and Toxicity of Neoadjuvant Erlotinib in Patients With Early-Stage Non-Small-Cell Lung Cancer
- Evaluation of the Role of Tumor-Associated Macrophages in an Experimental Model of Peritoneal Carcinomatosis Using 18F-FDG PET
- Improvement of Early 18F-FDG PET Interpretation in Diffuse Large B-Cell Lymphoma: Importance of the Reference Background
- 18F-FDG and 18F-FLT Uptake Early After Cyclophosphamide and mTOR Inhibition in an Experimental Lymphoma Model