


Abstract
To be a reliable predictor of response, tracer uptake should reflect changes in the amount of active tumor cells. However, uptake of 18F-FDG, the most commonly used PET tracer, is disturbed by the inflammatory cells that appear early after cytotoxic therapy. The first aim of this study was to investigate whether 3′-18F-fluoro-3′-deoxy-l-thymidine (18F-FLT), a marker of cellular proliferation, is a better tracer for response assessment early after cytotoxic therapy. A second objective of this study was to investigate whether 18F-FDG and 18F-FLT responses were comparable early after mammalian target of rapamycin (mTOR) inhibition, as an example of proliferation-targeting therapies. Methods: Severe combined immunodeficient mice were subcutaneously inoculated with Granta-519 cells, a human cell line derived from a leukemic mantle cell lymphoma. Half the mice were treated with cyclophosphamide and the other half with mTOR inhibition. 18F-FDG and 18F-FLT uptake was evaluated by small-animal PET on day 0 (D0; before treatment), D+1, D+2, D+4, D+7, D+9, D+11, and D+14. At each time point, 2 mice of each treatment condition were sacrificed, and tumors were excised for histopathology. Results: After cyclophosphamide, 18F-FDG and 18F-FLT uptake decreased, with a maximum reduction of −29% for 18F-FDG and −25% for 18F-FLT uptake at D+2, compared with baseline. Although 18F-FDG uptake increased from D+4 on, with a maximum on D+7, 18F-FLT uptake remained virtually stable. Histology showed an increase in apoptotic or necrotic tumor fraction, followed by an influx of inflammatory cells. In mTOR-inhibited mice, 18F-FDG uptake dropped until D+2 after therapy (−43%) but increased at D+4 (−27%) to form a plateau on D+7 and D+9 (−14% and −16%, respectively). Concurrently, 18F-FLT uptake decreased to −31% on D+2, followed by an increase with a peak value of +12% on D+7, after which 18F-FLT uptake decreased again. Cyclin D1 expression dropped from D+1 until D+4 and returned to baseline at D+7. Conclusion: Because 18F-FLT uptake is not significantly influenced by the temporary rise in inflammatory cells early after cyclophosphamide, it more accurately reflects tumor response. However, a formerly unknown temporary rise in 18F-FLT uptake a few days after the administration of mTOR inhibition was defined, which makes it clear that drug-specific responses have to be considered when using PET for early treatment monitoring.
Uptake of 18F-FDG is closely related to the metabolic activity and the number of viable tumor cells; because a reduction in metabolism and proliferation of the damaged cells and a reduced number of viable cells occur within a few days after chemotherapy, effective therapy results in a subsequent reduction of the 18F-FDG uptake measured using PET.
Römer et al. were the first to document a rapid decrease of 18F-FDG uptake in non-Hodgkin lymphoma (NHL) as early as 7 d after treatment (1). However, a significant number of patients still have residual 18F-FDG uptake 1 wk after treatment, and it was hypothesized that assessment of response early after therapy requires quantification of 18F-FDG uptake and the use of cutoff values. Until now, no threshold was defined that allowed the prediction of relapse in the first days after therapy in lymphoma (2). It is possible that quantification of response assessment at this time is too variable because of interfering factors such as inflammation. Shortly after the administration of cytotoxic therapy (e.g., cyclophosphamide)—which acts through the cross-linking of DNA and the induction of apoptosis or necrosis—an influx of activated inflammatory cells occurs, making it difficult to correctly quantify tumor response. In previous work, we showed that this influx can be suppressed by the administration of corticosteroids (3,4).
Alternatively, other tracers (e.g., 3′-18F-fluoro-3′-deoxy-l-thymidine [18F-FLT]) can be used for treatment monitoring. 18F-FLT is monophosphorylated by cytosolic thymidine kinase-1 (TK1), which leads to intracellular trapping. Because TK1 increases just before and in the S phase, 18F-FLT uptake is cell cycle–dependent and is assumed to reflect the amount of active proliferating cells (5). Because inflammatory cells have only a minor tendency to proliferate once they enter the tumor, the 18F-FLT uptake, compared with 18F-FDG uptake, in tumor lesions is less hampered by this inflammatory response; 18F-FLT uptake may reflect more accurately the obtained treatment response. However, 18F-FLT is only insignificantly incorporated into DNA and TK1 may be upregulated, despite an inhibition of the DNA synthesis. The first aim of this study was to investigate in vivo whether 18F-FLT is a better tracer for response assessment in the first days after cytotoxic therapy.
Most recent advances in cancer treatment have come from the development of disease-specific molecule-targeted agents, instead of from the empiric combinations of cytotoxic agents from the past. Many of these drugs induce cell cycle arrest instead of tumor cell death and are not expected to induce fast tumor regression, making measurements of cellular viability by 18F-FDG theoretically less relevant. The assessment of cellular proliferation by 18F-FLT might be an alternative. An example of these new strategies is the inhibition of the mammalian target of rapamycin (mTOR). mTOR is a regulator of cellular proliferation and acts through several targets. One of these targets is the messenger RNA (mRNA) encoding for the cyclin D1 protein, which makes this strategy extremely interesting for the treatment of mantle cell lymphoma (MCL) (6). This subtype of B-cell NHL is characterized by translocation t(11;14) connecting the cyclin D1 gene with the promoter region of the immunoglobulin heavy chain. As a result, the cyclin D1 gene is constitutively transcripted to cyclin D1 mRNA, which leads to an overexpression of the cyclin D1 protein. Cyclin D1, at its turn, induces the progression of the cell cycle through the G1–S phase. The blocking of mTOR leads to an inhibition of the translation of cyclin D1 mRNA to the cyclin D1 protein and provokes cell cycle arrest in mid to late G1.
Especially after the administration of proliferation-targeting therapies, the time course of 18F-FDG and 18F-FLT uptake has not yet been properly explored. Therefore, a second objective of this study was to investigate whether 18F-FDG and 18F-FLT responses were comparable early after mTOR inhibition.
MATERIALS AND METHODS
Animal Model
Six-week-old male severe combined immunodeficient (SCID) mice (C.B-17/Icr SCID/SCID) were inoculated with 5.106 Granta-519 cells, subcutaneously in the left shoulder and the right thigh. The Granta-519 cell line was obtained from the DMSZ tissue bank. This cell line is derived from a leukemic MCL and carries t(11;14) associated with cyclin D1 overexpression. Treatment with cyclophosphamide or temsirolimus was started when the tumor reached a diameter of 10–15 mm.
Experimental Design
A total of 46 mice were used for analysis. Two mice were sacrificed when their tumor diameter reached 15 mm; these mice did not receive any treatment. Their tumors were dissected for histopathology and used as baseline references.
The other mice were divided into 2 treatment regimens. The first group (n = 22) was treated with a single dose of cyclophosphamide (125 mg/kg intraperitoneally) (Endoxan; Baxter) on day 0 (D0). The second group (n = 22) received temsirolimus (50 mg/kg intraperitoneally), which was provided by Wyeth (CCI-779, Torisol). Temsirolimus is one of the first mTOR inhibitors currently tested in clinical studies for the treatment of patients with relapsed MCL (7). 18F-FDG and 18F-FLT uptake over time was evaluated by serial small-animal PET (5 mice per treatment per tracer) on D0 (before treatment), D+1, D+2, D+4, D+7, D+9, D+11, and D+14. At each time, 2 mice of each treatment condition were sacrificed, and tumors were excised for histopathology (Table 1).
Flow Chart of Experimental Design
Small-Animal PET
After overnight fasting, the mice underwent small-animal PET (Focus 220 microPET; Concorde-CTI/Siemens). Spatial resolution of the used PET system is 1.6 mm, and acquired images were reconstructed with ordered-subsets expectation maximization. Simulations with spheres of different diameters with these settings showed that effects of partial volume on 18F-FDG uptake were minimal in lesions with a diameter larger than 3 mm.
After the mice were sedated by gas anesthesia (isoflurane, Forene; Abbot), tumor dimensions were measured (caliper) and body weight and glycemia were determined. Sixty minutes after an injection of 18F-FDG (8–11 MBq) via a tail vein, small-animal PET was performed (10 min) at a single-bed position with the tumor in the center of the field. All animals received an intramuscular injection of furosemide (40 mg/kg) (Lasix; Aventis) in the contralateral thigh at the same time as the tracer injection, to reduce reconstruction artifacts caused by the high concentration of 18F-FDG in the urine; the bladder was carefully voided before scanning.
18F-FDG and 18F-FLT PET Evaluation
The same methodology as described in previous work was used to quantify 18F-FDG and 18F-FLT uptake in the tumor lesion (4). Because of the frequent occurrence of central necrosis and low tumor-to-background ratios for 18F-FLT, this analysis was based on maximal standardized uptake values (SUVs).
Change in SUV was expressed as a percentage of the baseline SUV on D0. To correct for differences in administered dose (paravenous injections became more frequent after several injections in the same mouse), all SUVs were normalized by dividing maximal SUVs of the tumor by the corresponding mean SUV in a standard region in the liver as a reference value. This standard region was defined as a circular region of interest of about 0.8 mm diameter in a homogeneous part of the liver. All further reported SUVs are maximal SUVs normalized for liver uptake.
Histology
Paraffin-embedded sections were stained with hematoxylin and eosin. Immunohistochemical staining was performed with antiCD20 mAb (pan B-cell marker), with Mib-1, cyclin D1, and proliferating cell nuclear antigen (PCNA). Although Mib-1 recognizes an epitope of the Ki67 nuclear antigen that is present during DNA synthesis (all cells currently in the cell cycle, not in G0), PCNA protein expression is associated with late G1 or S phase in normal cells (S phase).
Every fifth microscopic field of viable-looking tumor tissue was semiquantitatively scored for the number of CD20-, Mib-1–, PCNA-, and cyclin D1–positive cells of the total number of viable tumor cells, and a mean value was estimated (− [<25%, almost none]; + [some, 25%−50%]; ++ [a lot, 50%−75%]; and +++ [almost all, 75%−100%]).
Statistics
For each time point, the mean ± SEM in both treatment groups was calculated and expressed graphically. A 2-tailed P value of less than or equal to 0.05 was considered statistically significant. Unpaired Student t tests were used to evaluate differences between the 2 treatment groups, and paired Student t tests were performed for differences between time points on the activity curve within 1 treatment condition.
RESULTS
Baseline 18F-FLT and 18F-FDG Uptake
All tumors had visible 18F-FLT and 18F-FDG uptake, and almost all tumors had a central zone of low tracer uptake. Mean SUVFDG at baseline was 3.1 (range, 2.4–4.8), and mean SUVFLT at baseline was 2.1 (range, 1.7–2.4). Baseline 18F-FDG uptake was significantly higher than 18F-FLT uptake (P < 1.10−7).
Decrease in 18F-FLT and 18F-FDG Uptake in Cyclophosphamide-Treated Mice
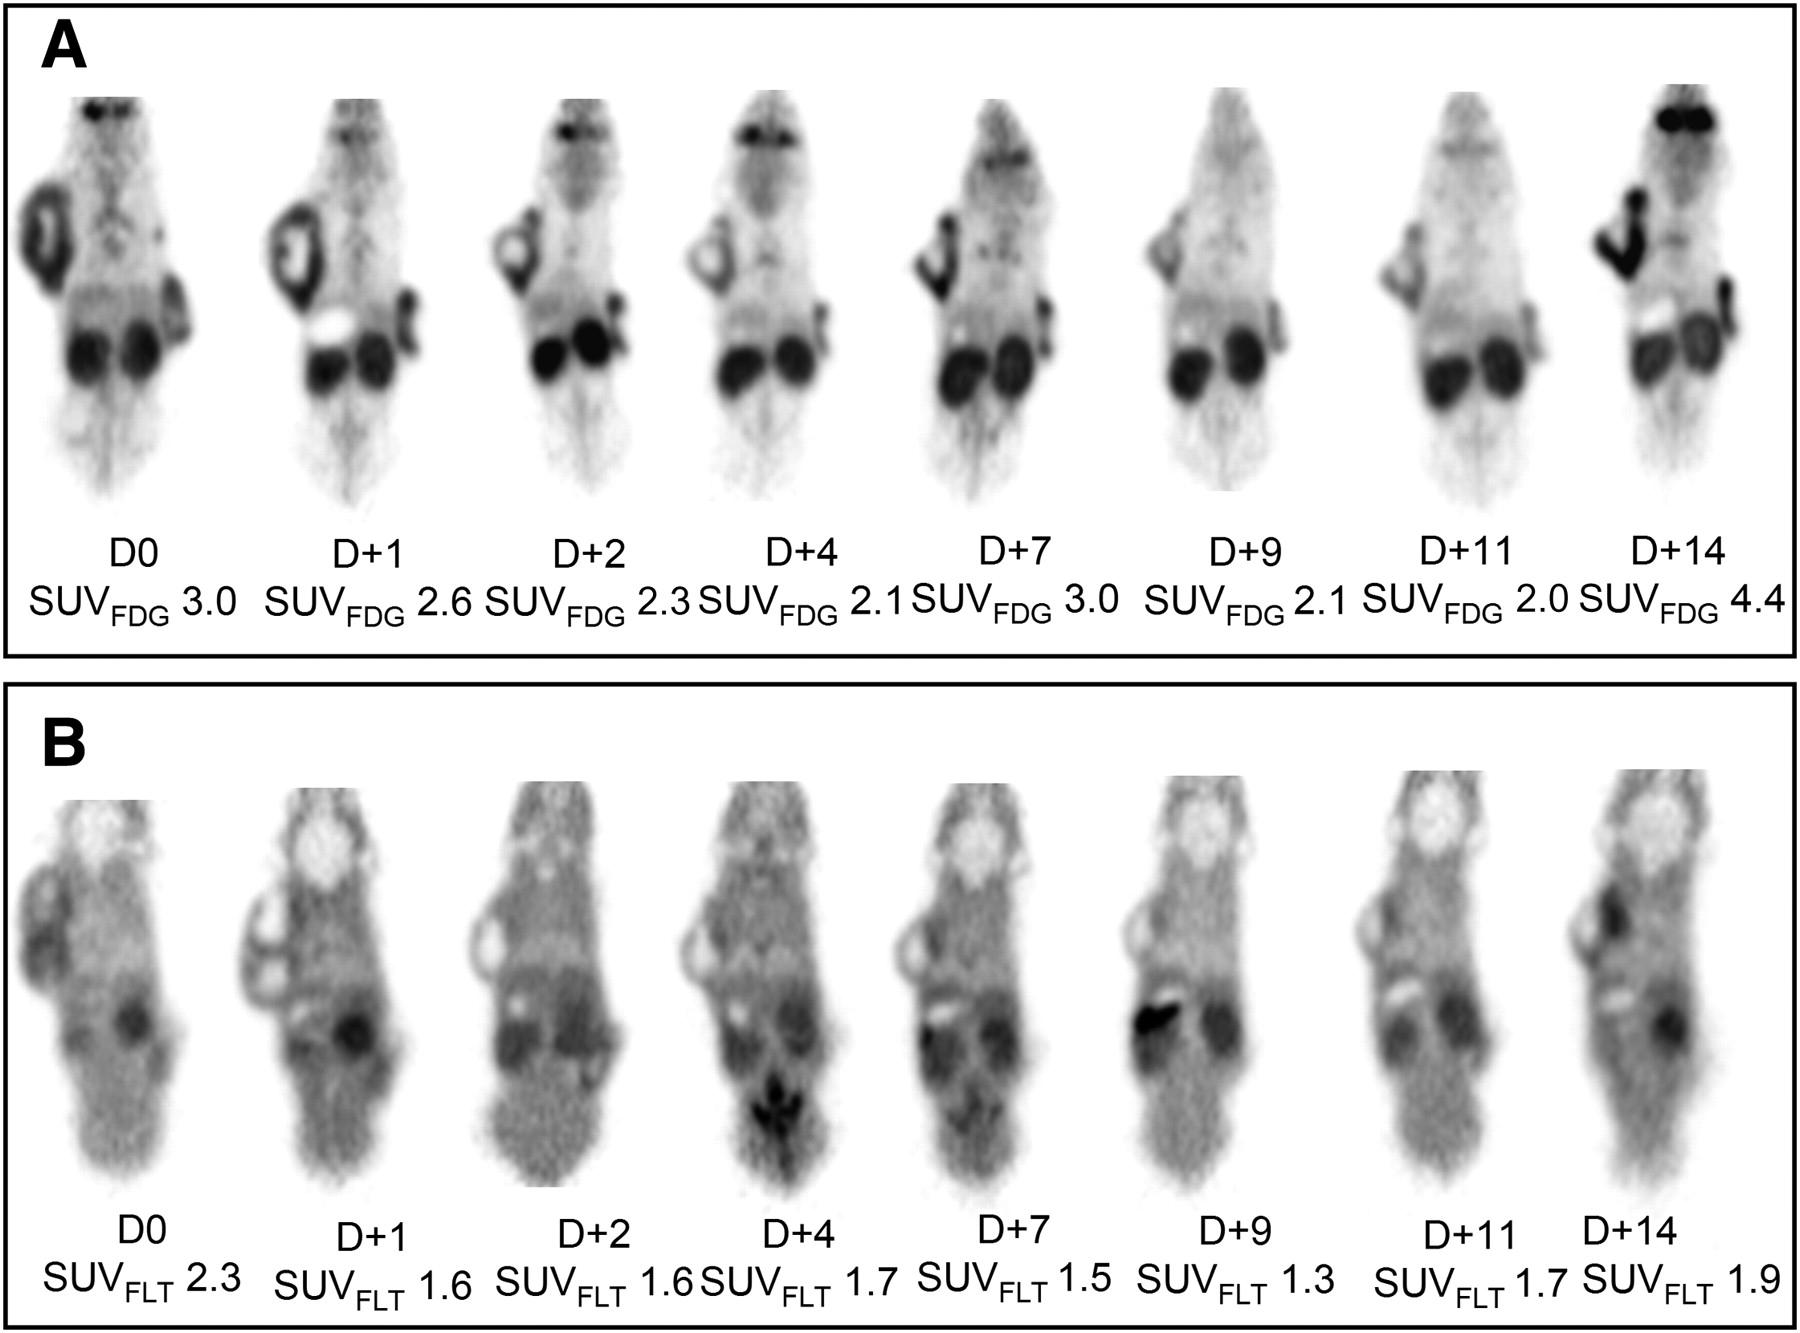
Figure 1 shows an example of the evolution of 18F-FDG and 18F-FLT uptake after the administration of cyclophosphamide. 18F-FDG and 18F-FLT uptake decreased shortly after the administration of cyclophosphamide, with a maximum reduction of −29% for 18F-FDG and −25% for 18F-FLT uptake at D+2, compared with baseline values (Fig. 2A). Although 18F-FDG uptake increased from D+4 on, with a maximum on D+7 (+1% increase, compared with baseline), 18F-FLT uptake remained virtually stable (−16% at D+7, compared with baseline). After this temporary increase, 18F-FDG uptake decreased again at D+9 (−19%) and D+11 (−25%) and increased again at D+14 (+20%).

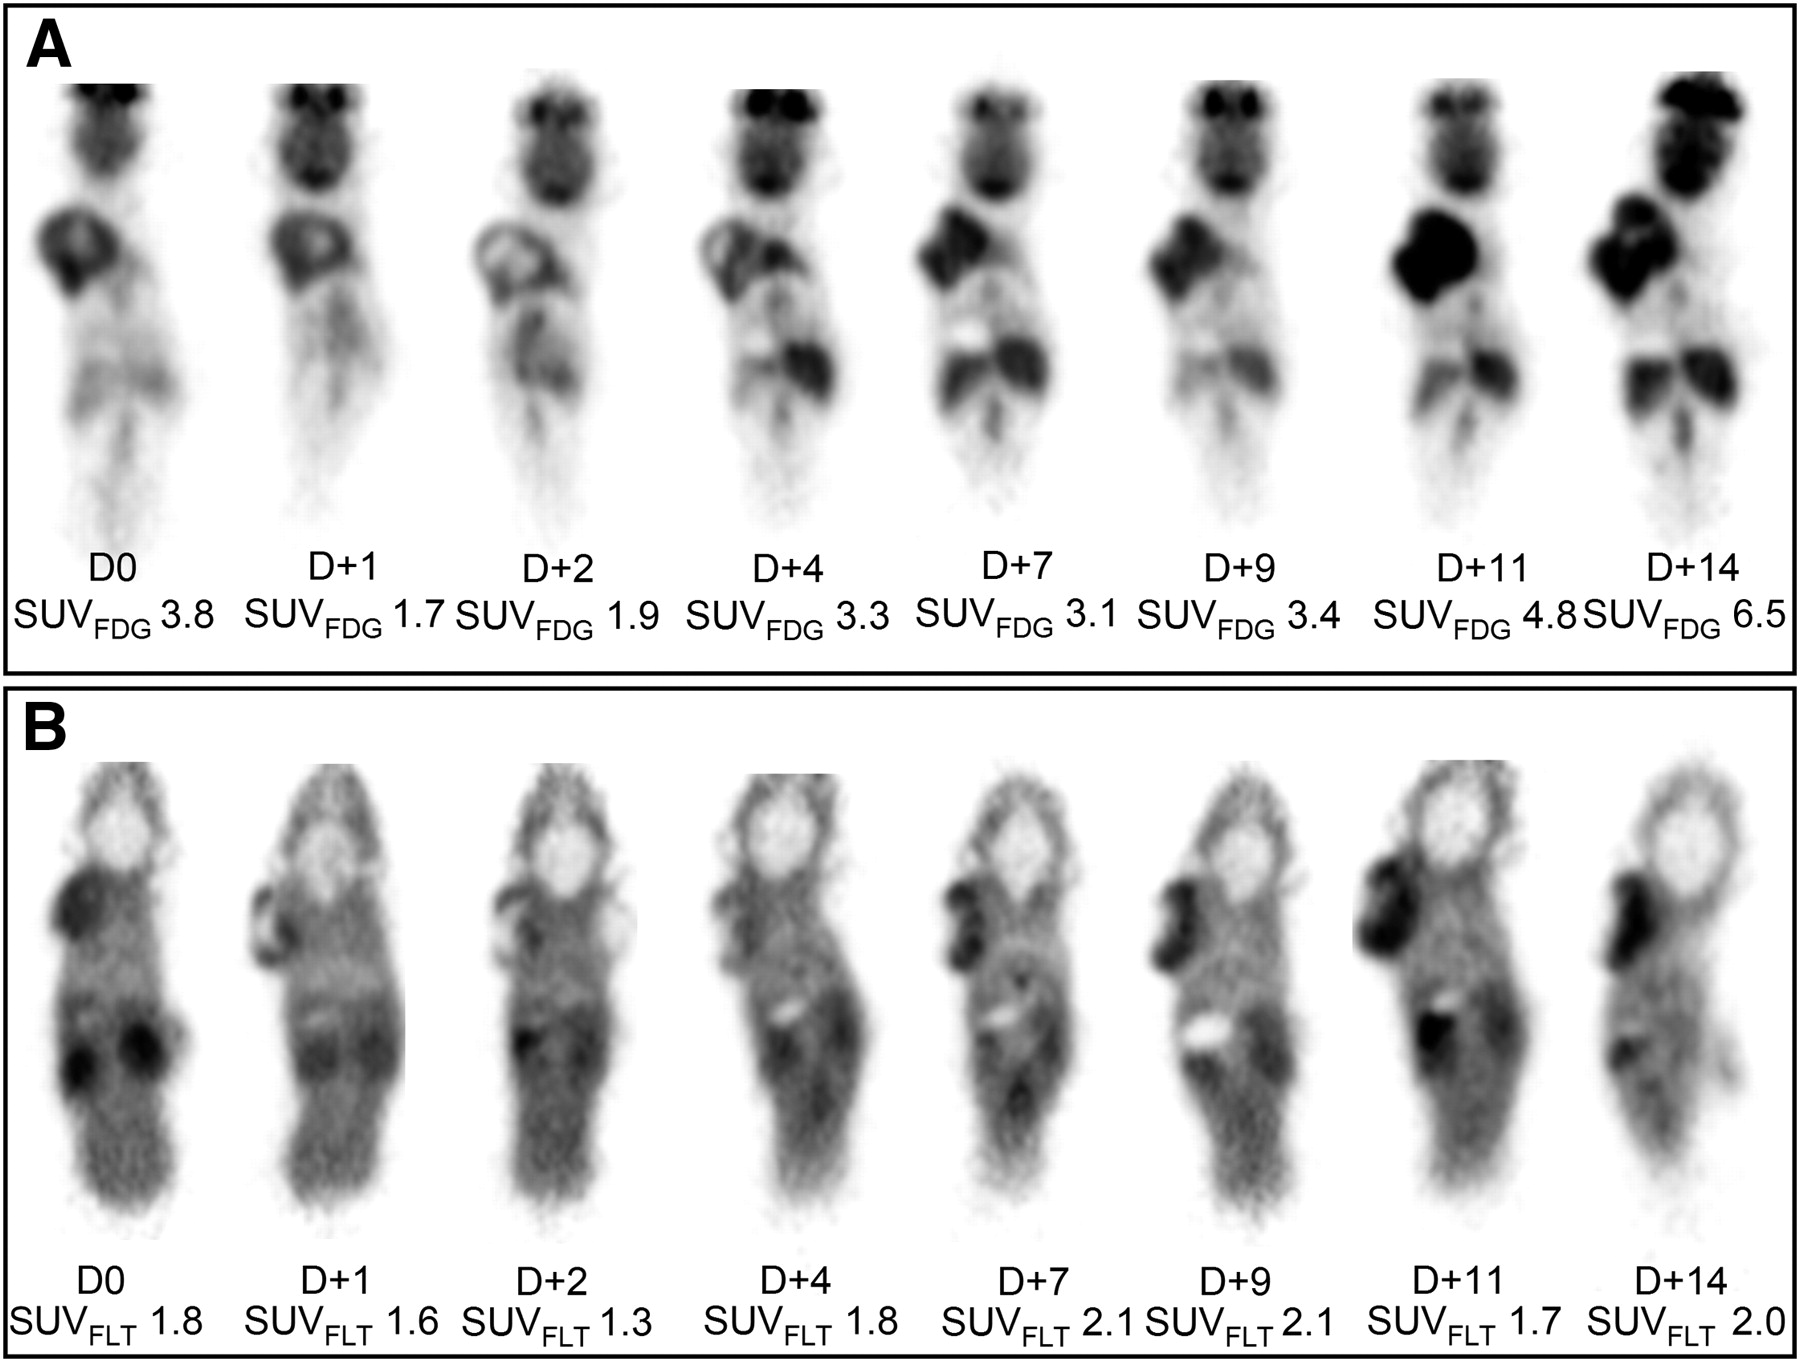
Example of serial small-animal PET images on D0 and on D+1, D+2, D+4, D+7, D+9, D+11, and D+14 after treatment with cyclophosphamide as measured with 18F-FDG (A) and 18F-FLT (B) PET.

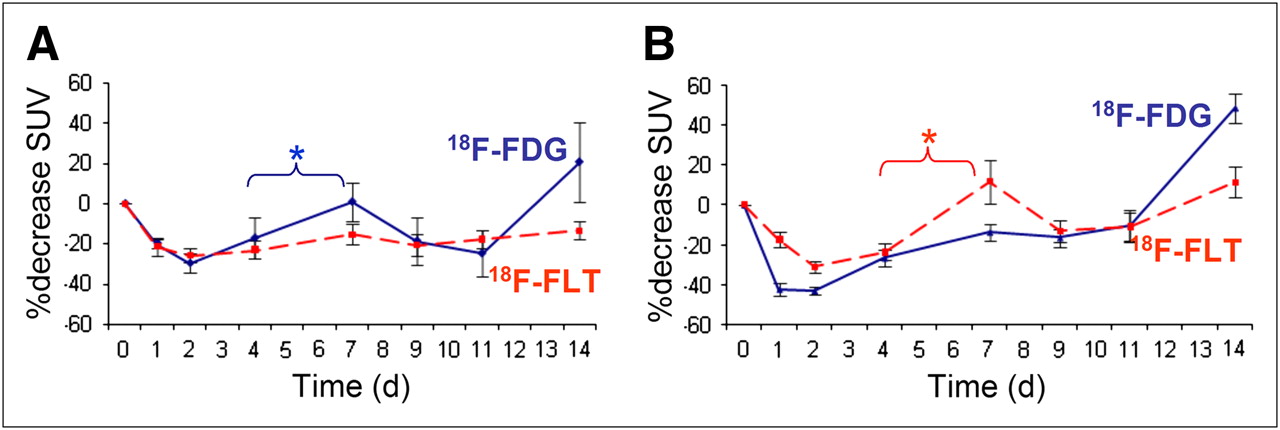
18F-FDG and 18F-FLT uptake as measured by serial small-animal PET and expressed as mean SUVFDG and mean SUVFLT ± SEM in mice treated with cyclophosphamide (A), compared with mice treated with temsirolimus (B). Blue curve = percentage decrease in SUVFDG; red curve = SUVFLT. *Significant at the P ≤ 0.05 level.
The difference in 18F-FDG uptake between D+4 and D+7 was highly significant (P = 0.0005). No significant difference could be retained for 18F-FLT uptake between D+4 and D+7 (P = 0.48) (Table 2). No significant difference between the slopes of 18F-FLT uptake and 18F-FDG uptake was observed (P = 0.13).
Comparison of SUVFDG and SUVFLT at Days 4 and 7
Decrease in 18F-FLT and 18F-FDG Uptake in Temsirolimus-Treated Mice
In temsirolimus-treated mice, 18F-FDG uptake dropped at D+1 and D+2 after therapy (−43% on D+2, compared with baseline) but increased at D+4 (−27%, compared with baseline) to form a plateau on D+7 and D+9 (−14% and −16%), after which 18F-FDG uptake increased on D+14 (Figs. 2B and 3).

Example of serial small-animal PET images on D0 and on D+1, D+2, D+4, D+7, D+9, D+11, and D+14 after treatment with temsirolimus and measured with 18F-FDG (A) and 18F-FLT (B) PET.
Concurrently, 18F-FLT uptake decreased after temsirolimus administration, until a maximum decrease of −31% on D+2, and then importantly increased with a peak value of +12%, compared with baseline, on D+7. After this temporary increase, 18F-FLT uptake decreased (−13% and −11% on D+9 and D+11, respectively), only to increase on D+14 (+11%).
Histopathology in Untreated Mice
In untreated animals, tumors were composed of a massive proliferation of CD20-positive cells with positivity for Mib-1 and PCNA, with high cyclin D1 expression and the presence of multiple mitotic figures. Baseline tumors had a significant necrotic fraction, even before any treatment was started, and some nontumor, inflammatory cells were present, mainly macrophages.
Histopathology in Cyclophosphamide-Treated Mice
After the administration of cyclophosphamide, there was an increase in apoptotic or necrotic tumor fraction from D+4 to D+9. This rise in apoptotic or necrotic cells is followed by an increasing number of inflammatory cells, with a maximum on D+9 to make place for fibrosis a few days later at D+14.
The number of cyclin D1–positive cells decreased on D+1 and D+2, with a slow increase in the number of cyclin D1–positive cells from D+4 until baseline values were reached on D+9. No clear responses were seen in the number of Mib-1– and PCNA-positive cells (Table 3; Fig. 4).
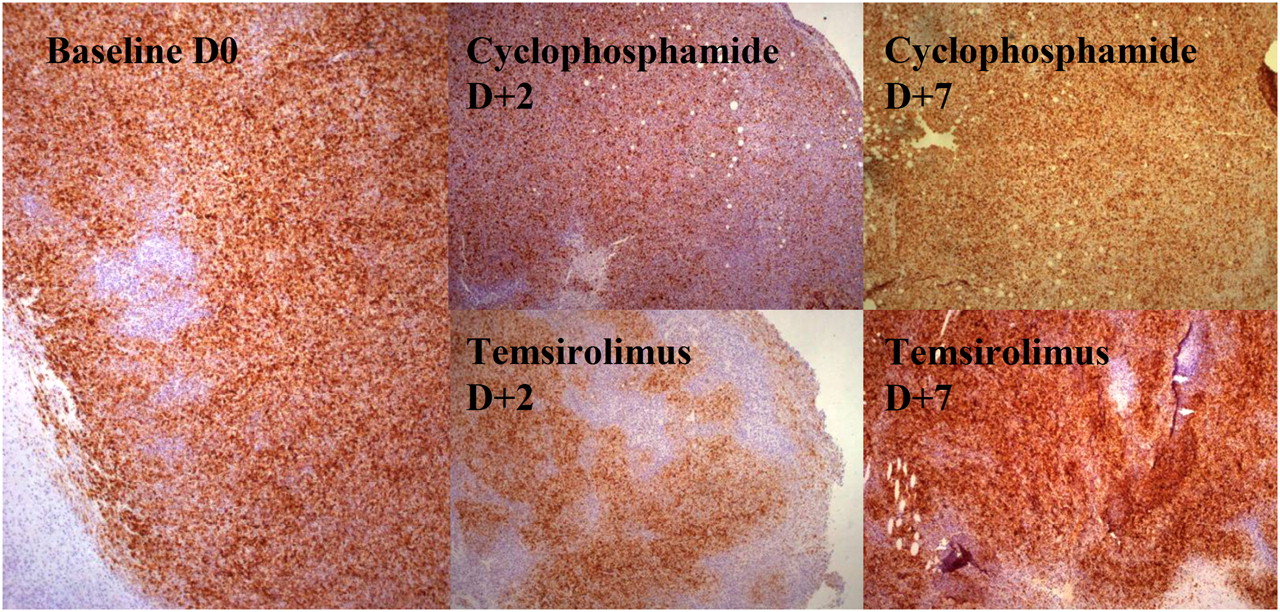
Immunohistochemical staining for cyclin D1 at day 0 (before) and at D+2 and D+7 after treatment. Staining for cyclin D1 shows moderate decrease in cyclin D1–positive tumor cells after 2 d of treatment with cyclophosphamide. After administration of temsirolimus, important decrease in amount of cyclin D1–positive tumor cells was seen at D+2, which increased again on day 7.
Semiquantitative Scoring of Number of Considered Cells on Total Number of Viable Cells in Cyclophosphamide-Treated Mice
Histopathology in Temsirolimus-Treated Mice
Temsirolimus induced an increase in the apoptotic or necrotic cell fraction at D+2 after therapy. Compared with cyclophosphamide-treated mice, a more pronounced inflammatory reaction was observed at D+2 to D+4, which consisted largely of macrophages but also of some granulocytes.
Cyclin D1 expression dropped from D+1 until D+4 and returned to baseline at D+7. Concurrently with the decrease in cyclin D1, Mib-1 expression decreased, although the decrease was less pronounced. At D+9 after therapy, morphology of the tumor had returned to baseline appearance, with a high cyclin D1 and Mib-1 expression. Tumor volume increased spectacularly at D+14, because of tumor regrowth. No changes were observed in PCNA expression (Table 4; Fig. 4).
Semiquantitative Scoring of Number of Considered Cells on Total Number of Viable Cells in Temsirolimus-Treated Mice
DISCUSSION
Because patients with poor prognosis may benefit from early intensified treatment regimens, it is useful to know the individual patient's risk of relapse as early as possible. The rationale for performing PET early during therapy lies in the detection of resistant tumor clones that respond to treatment more slowly than chemosensitive tumor cells and may eventually cause disease relapse or progression. However, early after therapy, an inflammatory reaction occurs that mainly consists of macrophages for the removal of necrotic debris. Because these inflammatory cells also show high 18F-FDG uptake, their presence will disturb measurements of the tumor response. This study evaluated whether 18F-FLT was a more reliable tracer for quantification of response, because 18F-FLT is more tumor-specific than 18F-FDG and is believed to reflect the amount of active proliferating cells. Concurrently, 18F-FDG and 18F-FLT responses were compared after the administration of temsirolimus (a cell cycle–targeting agent).
A significantly lower baseline 18F-FLT uptake than 18F-FDG uptake was found, which has already been reported for several other tumor types (8–12) and which made it difficult to adequately delineate tumor volume in 18F-FLT images. Therefore, this analysis concentrated on the maximal SUVs, the most frequently used parameter for response assessment because of the relative resistance of maximal SUVs to partial-volume effects and interobserver variability.
Our results in cyclophosphamide-treated mice showed a significant increase in 18F-FDG uptake from D+4 to D+7, which was not present for 18F-FLT uptake. This finding confirms the hypothesis that the temporary rise in inflammatory cells does not significantly influence 18F-FLT uptake. Therefore, 18F-FLT uptake after therapy is less disturbed by this reaction and is more reflective of tumor tissue than is 18F-FDG uptake after the administration of cyclophosphamide. This finding corresponds to the many reports on the low uptake of 18F-FLT in inflammatory lesions (13,14). However, the initial enthusiasm about the higher specificity of 18F-FLT has been tempered by the recent reports that 18F-FLT uptake also occurs in granulomatous inflammatory lesions such as tuberculosis (15) and in reactive lymph nodes (16,17) (related to a high proliferation rate of macrophages and B-lymphocytes, respectively).
After the administration of temsirolimus, 18F-FDG uptake dropped spectacularly at D+1 and D+2 but increased at D+4, after which 18F-FDG uptake remained almost steady for another 7 d. This result corresponds to the histologic finding that in temsirolimus-treated mice, tumor response occurs earlier and more dramatically than in cyclophosphamide-treated mice. The inflammatory reaction in these mice is also present earlier than in cyclophosphamide-treated mice, which may explain why 18F-FDG uptake increased at D+4. The subsequent plateau from D+7 to D+11 is probably a summation of a decline in inflammatory 18F-FDG uptake and a reactivation of the tumor cells.
Concurrently with the decrease in 18F-FDG uptake, 18F-FLT decreased at D+1 and D+2 after the administration of temsirolimus. At D+4, 18F-FLT uptake after temsirolimus administration increased to form a significant peak at D+7, after which 18F-FLT uptake dropped again on D+9. Until now, no comparable finding has been described, and the exact mechanism of this finding remains unclear.
The increase in 18F-FLT uptake on D+7 cannot be attributed to an inflammatory reaction because of the absence of matching histopathologic findings; thus, the explanation lies in 18F-FLT uptake by the tumor cells themselves. The increased expression of cyclin D1 at this time suggests that the tumor cells have regained their translation capacity of cyclin D1 and consequently their proliferation capacity (half-life of temsirolimus, 9–17 h) (Wyeth investigational brochure, April 2008). This explanation is consistent with previous reports that the still-viable tumor cells reenter into S phase within 2–4 h after removal of the drug, which leads to an elevated TK1 (5,18–20). However, an increase in 18F-FLT uptake can also be a result of activated cellular repair mechanisms, a stimulation of the salvage pathway of the pyrimidine metabolism, or the antiangiogenic effect of temsirolimus that was shown in breast cancer and may have led to alterations in tracer availability at the tumor site (18). Therefore, in future work, it is important to correlate our findings with an evaluation of TK1 activity and DNA flow cytometry to obtain a more sustained insight on the provoking mechanism of this finding.
18F-FLT uptake was shown to be largely drug-dependent in cell lines, with a 7- to 10-fold increase in 18F-FLT uptake after treatment with 5-fluorouracil (5-FU), attributed to a blocking of the de novo pathway of the pyrimidine metabolism with a redistribution of nucleoside transporters to the plasma membrane and an accumulation of 5-FU–treated cells in early S phase (21). In contrast, 18F-FLT uptake after cisplatin administration was reduced, despite considerable S-phase arrest (22).
In targeted therapies, Solit et al. showed that mitogen-activated protein kinase/extracellular signal-regulated kinase (MEK), which causes G1 arrest and downregulation of cyclin D1 expression, leads to a significant decrease in 18F-FLT uptake 1 wk after treatment (23). In a mouse follicular lymphoma xenotransplant model, a significant decrease of 18F-FLT uptake was observed at 48 h after chemotherapy with cyclophosphamide (24). Comparable results were obtained with preclinical models of sarcoma after cisplatin administration (8), esophageal carcinoma after chemoradiation (25), and squamous cell carcinoma 24 h after irradiation (26).
Recently, Herrman et al. evaluated 18F-FLT PET for early response monitoring in 22 patients with high-grade NHL and showed that 18F-FLT uptake in lymphoma is decreased 2 d after treatment with cyclophosphamide, doxorubicin, vincristine, and prednisone but not after rituximab (27).
Until now, no authors, to our knowledge, have monitored the time course of 18F-FLT uptake at several time points during the first days after treatment, although by comparing baseline 18F-FLT uptake with a single time point after treatment, information about time-dependent processes can be masked, certainly interfering with PET results. The flipside of monitoring multiple time points in the same animals is the absence of histologic or cytologic data of the scanned animal itself and a more hampered correlation of PET results with ex vivo tumor evaluation.
The main limitation of this study is without a doubt the mouse model. The tumor model involves an immune-deficient animal (SCID mice) without a functional T or B cell compartment, and extrapolation of our results to immune-competent mice or humans is, therefore, not possible. Despite these limitations, SCID mice have a normal macrophage, granulocyte, and natural killer function, and an inflammatory reaction was shown in this tumor model at about D+7 in earlier experiments (4,28).
Each of the used treatment strategies has inevitable influences on the immune system. Cyclophosphamide is used for immune suppression, and temsirolimus is a potent inhibitor of lymphocyte proliferation and cytokine production and is currently being tested for the treatment of rheumatoid arthritis. Although temsirolimus will probably have only minor influences on our tumor model (no functional T and B cells in SCID mice), these are likely to interfere with the normal clinical situation. Another drawback of this study is that it does not include dynamic scans, which could have allowed a more thorough insight into the dynamics of tracer uptake as a response to therapy.
The objective of this study was to investigate how 18F-FDG and 18F-FLT uptake changed in the first days after therapy and whether different treatment strategies require other interpretations of uptake quantification. It was not our objective to compare action mechanisms of the different drugs or to compare the efficacy of treatments with each other; consequently, this investigation does not allow conclusions about the drugs used, only about their effect on tracer uptake early after therapy.
CONCLUSION
This investigation showed that the used treatment strategy influences 18F-FDG and 18F-FLT uptake in different ways, with different time–activity curves shortly after therapy. The temporary rise in 18F-FDG uptake at day 7 after cyclophosphamide administration, attributable to a temporary influx of inflammatory cells, did not alter 18F-FLT measurements. Therefore, 18F-FLT uptake is a more accurate measurement for tumor response than is 18F-FDG uptake after the administration of cyclophosphamide.
However, a formerly unknown temporary rise in 18F-FLT uptake occurred a few days after the administration of temsirolimus had been defined and was related to an increased expression of cyclin D1. The increased expression of cyclin D1 probably points to a reactivation of the tumor cells; however, the exact underlying mechanism of the temporary rise in 18F-FLT uptake remains to be established on the molecular level.
Our results make it clear that not only with 18F-FDG PET, but even more with 18F-FLT PET, is the timing of response assessment crucial because of temporary metabolic changes.
Acknowledgments
This work was supported in part by grant G.0177.04 from the Flemish Fund for Scientific Research (FWO Vlaanderen). Lieselot Brepoels is a Research Assistant of the FWO.
Footnotes
-
COPYRIGHT © 2009 by the Society of Nuclear Medicine, Inc.
References
- Received for publication January 14, 2009.
- Accepted for publication March 18, 2009.


Jump to section
Related Articles
Cited By...
- A Personalized Preclinical Model to Evaluate the Metastatic Potential of Patient-Derived Colon Cancer Initiating Cells
- [18F]-FLT Positron Emission Tomography Can Be Used to Image the Response of Sensitive Tumors to PI3-Kinase Inhibition with the Novel Agent GDC-0941
- FLT-PET Is Superior to FDG-PET for Very Early Response Prediction in NPM-ALK-Positive Lymphoma Treated with Targeted Therapy
- [18F]FLT-PET Imaging Does Not Always "Light Up" Proliferating Tumor Cells
- Phase I Trial of Cixutumumab Combined with Temsirolimus in Patients with Advanced Cancer
- 18F-FLT PET as a Surrogate Marker of Drug Efficacy During mTOR Inhibition by Everolimus in a Preclinical Cisplatin-Resistant Ovarian Tumor Model
- Can Evaluation of Targeted Therapy in Oncology Be Improved by Means of 18F-FLT?
- Monitoring Tumor Response to Therapy with 18F-FLT PET