


Abstract
The aim of this study was to prospectively assess the regional changes of glucose metabolism of the cervical spinal cord in patients with degenerative cervical spine stenosis and symptomatic cervical myelopathy after decompressive surgery using 18F-FDG PET. Methods: Twenty patients with symptomatic degenerative monosegmental cervical stenosis with neuroradiologic signs of spinal cord compression underwent decompressive surgery. The clinical course using a functional status score (Japanese Orthopedic Association [JOA] score), 18F-FDG uptake, and MR imaging were assessed before and at follow-up 12 mo after surgery. Pre- and postoperative changes of 18F-FDG PET were correlated to the patients’ clinical outcome. Results: Ten patients demonstrated preoperatively a focally increased 18F-FDG uptake at the level of the stenosis. At follow-up, the uptake declined significantly (P = 0.008), and a significant improvement of JOA scores (P < 0.001) could be observed. The remaining 10 patients were characterized preoperatively by an inconspicuous glucose uptake at the level of cord compression in combination with a poststenotic decrease of 18F-FDG uptake. At follow-up, both JOA scores and 18F-FDG uptake changed insignificantly. Conclusion: Focal glucose hypermetabolism at the level of cervical spinal cord compression may predict an improved outcome after surgical decompression. Thus, this finding on 18F-FDG PET suggests a functional damage in a reversible phase of cervical myelopathy.
- cervical myelopathy
- degenerative cervical spinal stenosis
- spinal cord recovery
- 18F-FDG PET
- compression-induced inflammatory response
Compression of the cervical spinal cord due to degenerative cervical spine stenosis induces a progressive dysfunction of the myelon with subsequent neurologic deficits (i.e., cervical myelopathy) (1,2). MR imaging offers an exact morphologic visualization of the stenosis and the cord compression. However, there is no clear correlation between radiologic signs and clinical aspects of cervical myelopathy (3–6). Patients with severe stenosis and hyperintense signal alterations on T2-weighted MR images can lack any symptoms, and the degree of spinal cord compression correlates neither with the neurologic deficits nor with the recovery after surgical decompression (3–6). Therefore, mechanical compression of the cervical spinal cord alone seems not to be the essential factor for the development of myelopathy. Other factors such as a compression-induced neuroinflammation have been recently discussed (7–9).
Given the limitations of conventional MR imaging in prediction of clinical outcome in patients with cervical myelopathy, 18F-FDG PET has been used for metabolic assessment of the healthy, noncompressed cervical spinal cord (10–14) as well of the affected spinal cord (13). In a previous publication (15), we reported preliminary results of this prospective study on 18F-FDG uptake in 20 patients with compression of the cervical spinal cord due to degenerative cervical spine stenosis and cervical myelopathy. In the present work, we report the final results including pre- and postoperative data of MR imaging and 18F-FDG PET as well as the clinical outcome 12 mo after decompressive surgery.
MATERIALS AND METHODS
Patients
Between June 2008 and July 2010, 20 patients with degenerative cervical spine stenosis and consecutive cervical myelopathy due to local compression of the spinal cord and an intramedullary hyperintensity on T2-weighted MR images were included for this prospective, monocentric study. The patients were selected from a series of 512 patients with degenerative cervical spine pathology who were operated on at the St. Vinzenz Hospital in Düsseldorf, Germany. A detailed description of the inclusion and exclusion criteria was reported previously (15). In short, the patients were selected according to the following inclusion criteria: degenerative spondylotic stenosis of the cervical spine with local cord compression and intramedullary hyperintensity on T2-weighted MR imaging, clinical symptoms of cervical myelopathy with a Japanese Orthopedic Association (JOA) score of less than 16, and monosegmental stenosis and local cord compression at the vertebral level C3/4 or C4/5.
The diagnostic use of 18F-FDG PET was approved by the ethical review board of the St. Vinzenz Hospital in Düsseldorf, and all subjects gave written informed consent to their participation in the study. Three women and 17 men were included. The mean age was 64.9 ± 12.6 y (range, 45–83 y), and the mean duration of symptoms was 10.0 ± 8.6 mo (range, 1–30 mo). The average preoperative JOA score was 10.5 ± 2.6 points (range, 6–15 points). Detailed information is shown in Table 1.
Demographic and Clinical Data
The functional status was assessed using the JOA scoring system (15), which reflects the clinical activity of cervical myelopathy. An evaluation was performed preoperatively and at 6 and 12 mo after surgery. The difference between the preoperative and the postoperative JOA score after 12 mo was evaluated as a measure for clinical recovery. Complete clinical follow-up data were available in all 20 patients.
Imaging
T1- and T2-weighted MR images (1.5T, Sonata; Siemens) of the cervical spine without the administration of a contrast agent were acquired in the axial and sagittal planes preoperatively for exact visualization of the level of cord compression and detection of intramedullary hyperintensity on T2-weighted MR imaging as the radiologic sign of myelopathy. There were no major abnormalities in T1-weighted images within the spinal cord of our study patients indicating cystic lesions, syrinx formation, or other pathologic changes. The evaluation was done by an experienced radiologist who was masked to patients’ clinical condition and PET results. The postoperative MR imaging was performed on average after 12 mo (range, 10–15 mo) after surgery to verify the operative goal of a sufficient decompression of the stenosis and to evaluate changes of the intramedullary hyperintensity on T2-weighted MR images. Two patients refused to undergo follow-up MR imaging.
The glucose metabolism of the cervical spinal cord was determined preoperatively using PET to assess the metabolic aspects of myelopathy. All patients fasted at least 12 h before the PET studies. The PET scans were obtained at 1 h after intravenous injection of 370 MBq of 18F-FDG. To ensure normoglycemia, in all patients blood glucose levels were controlled before 18F-FDG injections. The application of insulin to reduce blood glucose to normal levels was not necessary. PET images were obtained on an ECAT EXACT HR+ scanner in 3-dimensional mode (Siemens Medical Systems, Inc.; 32 rings; axial field of view, 15.5 cm). For attenuation correction, transmission scans with three 68Ge/68Ga rotating line sources were used. After correction for random and scattered coincidences and dead time, image data were obtained by iterative reconstruction; the reconstructed image resolution was about 5.5 mm. Postoperative PET scans were acquired accordingly on average after 12 mo (range, 9–17 mo). Two patients refused to undergo follow-up 18F-FDG PET imaging.
For the evaluation of 18F-FDG PET data, dedicated software (MPI tool, version 3.28; ATV) was used. 18F-FDG PET images were coregistered with the corresponding MR imaging scans. To provide the highest reliability, the regional assessment of 18F-FDG uptake in the cervical spinal cord was performed as described previously (10,13,15–18). PET images were evaluated by a radiologist masked to patients' clinical performance. Maximum standardized uptake values (SUVs) of 18F-FDG uptake were calculated for each vertebral level from C1–C7 (Table 1) by dividing the maximum radioactivity (kBq/mL) of the regions of interest (ROI) by the radioactivity injected per gram of body weight (13,15). Circular ROIs with a diameter of 10 mm were placed onto the spinal cord in transaxial PET slices using sagittal MR images as an online reference as described previously (13). The maximum uptake value in the ROI was used as representative for tissue radioactivity to eliminate the partial-volume effect caused by an ROI size that was slightly larger than the diameter of the spinal cord, especially within the area of stenosis. For the statistical analysis, data of vertebral level C1 were discarded because there was spillover from the lower brain stem.
Surgical Decompression
After completion of preoperative imaging and clinical evaluation, all patients underwent standard microsurgical decompression of their stenosis. Except for patient 6, who received a posterior decompression (Supplemental Fig. 2; supplemental materials are available at http://jnm.snmjournals.org), in all other 19 patients a routine anterior decompression and cage fusion with or without anterior plate was performed (Figs. 1 and 2; Supplemental Fig. 1).
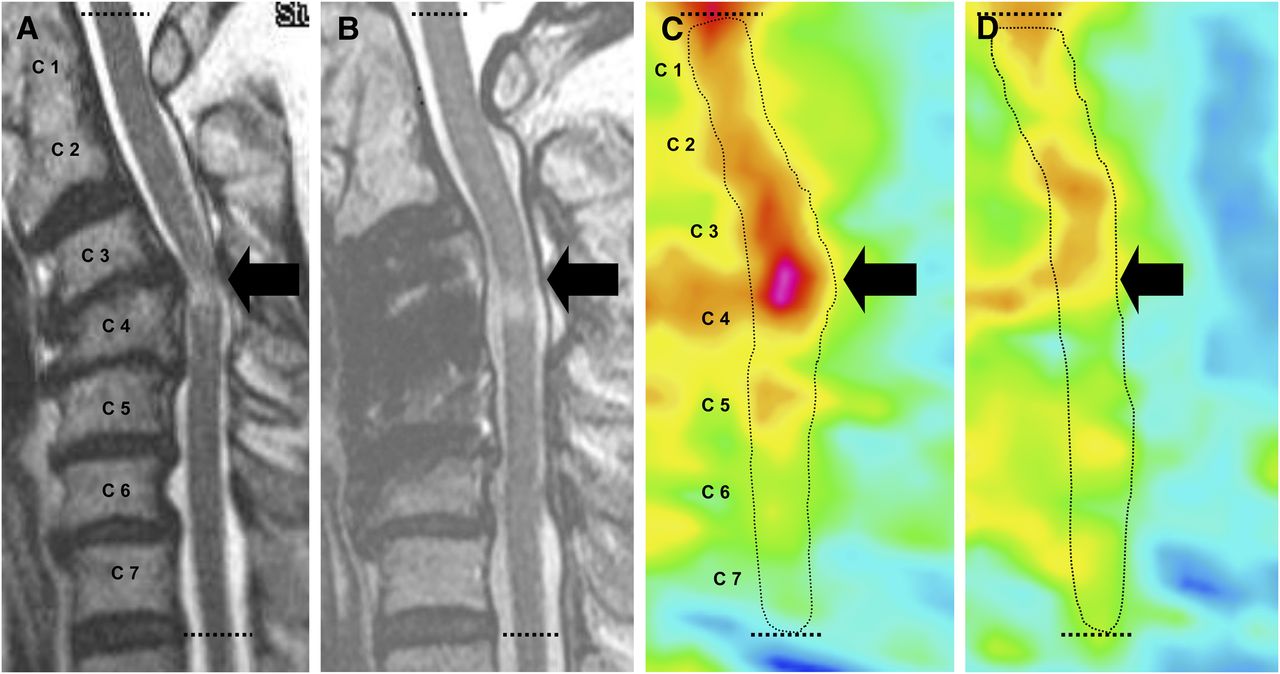
Patient with myelopathy type 1 (patient 3). T2-weighted MR image (A) shows stenosis with compression of cervical spinal cord and intramedullary hyperintensity at level C3/4 (arrow). Corresponding 18F-FDG PET image (C) shows increased 18F-FDG uptake at level of stenosis at C3/4 (arrow). Dotted line indicates position of spinal canal. Postoperatively, symptoms of cervical myelopathy improved considerably (increase of JOA score, 6 points). One year after decompressive surgery, MR image shows reestablished flow of cerebrospinal fluid around cervical spinal cord and intramedullary hyperintensity at level of former stenosis at C3/4 (arrow) is unchanged (B). In contrast, corresponding 18F-FDG PET image (D) indicates almost complete decline of 18F-FDG uptake at level of former stenosis at C3/4 (arrow).

Patient with myelopathy type 2 (patient 18). T2-weighted MR image (A) shows stenosis with compression of cervical spinal cord and intramedullary hyperintensity at level C3/4 (arrow). Corresponding 18F-FDG PET image (C) shows at level of stenosis no focally increased 18F-FDG uptake (arrow) and poststenotic decrease of glucose metabolism below level of C4. Dotted line indicates position of spinal canal. Postoperatively, symptoms of cervical myelopathy have not improved (pre- and postoperative JOA score, 8 points). Postoperative MR image 12 mo after decompressive surgery (B) shows reestablished flow of cerebrospinal fluid around cervical spinal cord and unchanged intramedullary hyperintensity at level of former stenosis at C3/4 (arrow). Corresponding 18F-FDG PET image shows no significant changes of 18F-FDG uptake pattern (D).
Statistical Analysis
All values are expressed as mean ± SD. Differences between groups were tested by the Student t test for independent samples or the Wilcoxon rank sum test. Changes in clinical parameters within the subgroups of patients with cervical myelopathy after surgery were tested using the Student paired t test. To determine the influence of the variables age, duration of symptoms, deterioration of the JOA scores, and presence of focally increased 18F-FDG uptake at the level of the cervical spine stenosis on clinical outcome, a correlation analysis was performed using the Pearson product moment and Spearman rank correlation coefficient. The independent influence of the different variables on clinical outcome was tested by multiple linear regression analysis. Statistical analyses were performed using SigmaStat software (SigmaPlot 11.0; SPSS Inc.) and PASW Statistics software (release 20.0.1; SPSS Inc.). Probability values of less than 0.05 were considered significant.
RESULTS
Identification of Different Metabolic Pattern in Patients with Cervical Myelopathy
As reported in our previous publication (15), we observed 2 markedly different patterns of 18F-FDG uptake. Patients with increased 18F-FDG uptake at the level of cervical spinal cord compression were classified as myelopathy type 1 (n = 10) (Fig. 1), and patients with inconspicuous 18F-FDG uptake at the level of cervical spinal cord compression in combination with a poststenotic decrease of 18F-FDG uptake were classified as myelopathy type 2 (n = 10) (Fig. 2). The quantitative data of 18F-FDG uptake (SUV) at the different levels of the cervical spine before and after surgery are presented in Table 1.
Preoperative 18F-FDG uptake at the level of stenosis was significantly higher in patients classified as having myelopathy type 1 (SUV, 2.3 ± 0.4) than in patients classified as having myelopathy type 2 (SUV, 1.9 ± 0.2; P = 0.05). At follow-up 12 mo after surgery of patients with myelopathy type 1, the postoperative 18F-FDG PET was available in 9 patients and the uptake at the level of the stenosis declined significantly (SUV, 1.9 ± 0.5; P = 0.008) (Fig. 1; Supplemental Figs. 1 and 2).
In patients with myelopathy type 2, an inconspicuous 18F-FDG uptake was noted in 10 patients at the individual level of stenosis and cord compression. Postoperative 18F-FDG PET after decompressive surgery could be obtained in 9 patients. At follow-up, 18F-FDG uptake at the level of the stenosis declined moderately (preoperative SUV, 1.9 ± 0.2, vs. postoperative SUV, 1.8 ± 0.3; P = 0.031) (Fig. 2).
Clinical Course and Outcome
Most of the myelopathy patients (n = 15) experienced an improvement of the clinical condition quantified by an increased JOA score after the follow-up 12 mo after surgical decompression. This clinical improvement predominantly occurred in the early phase after surgery.
A short history of symptoms or a clinical deterioration during the last 3 mo before study entry (acute or progressive cervical myelopathy) was associated with a favorable outcome (r = 0.45; P = 0.044) (Table 1). In contrast, a longer history of symptoms or a lack of clinical deterioration during the last 3 mo before study entry (chronic and stable cervical myelopathy) was associated with mild or absent clinical improvement (Table 1). A significant correlation was found between postoperative outcome (improvement of JOA score 12 mo after decompressive surgery) and duration of symptoms (r = −0.57; P = 0.009).
Impact of MR Imaging Changes on Outcome
MR imaging was performed after decompressive surgery in 18 of 20 patients. T2-weighted MR images showed vanishing intramedullary hyperintensity in 1 patient, shrinking intramedullary hyperintensity in 7, and unchanged signal alterations in the remaining 10. There was no significant difference in postoperative JOA score in patients with regression of the intramedullary hyperintensity, compared with those with postoperatively unchanged MR imaging findings (12.8 ± 2.2 vs. 14.5 ± 2.5; P = 0.075).
Impact of 18F-FDG PET Changes on Outcome
Patients with myelopathy type 1 showed a significantly shorter duration of symptoms (5.5 ± 4.7 vs. 14.5 ± 9.5 mo; P = 0.014) and a significantly higher deterioration of JOA score during the last 3 mo before decompressive surgery (4.1 ± 2.5 vs. 0.7 ± 0.5 points; P < 0.001) than did patients with myelopathy type 2.
At follow-up 12 mo after decompressive surgery, we observed considerable differences concerning the recovery of clinical symptoms. The overall outcome in myelopathy type 1 was favorable, and the patients showed a significant improvement of the JOA score (preoperative JOA score, 9.5 ± 2.5, vs. postoperative JOA score, 14.6 ± 1.7; P < 0.001) (Fig. 3). In contrast, there was no significant clinical change in patients with inconspicuous glucose metabolism at the level of cervical spine stenosis (myelopathy type 2). JOA scores after decompressive surgery remained constant (preoperative JOA score, 11.6 ± 2.5, vs. postoperative JOA score, 12.2 ± 2.4; P = 0.081) (Fig. 3). Improvement in JOA score after 12 mo was significantly higher in myelopathy 1 than in myelopathy 2 (5.1 ± 1.5 vs. 0.4 ± 0.8; P < 0.001). Multiple regression analysis identified the preoperative JOA score (P < 0.01) and the presence of a peak on 18F-FDG PET (P < 0.001) as independent predictors of postoperative outcome.

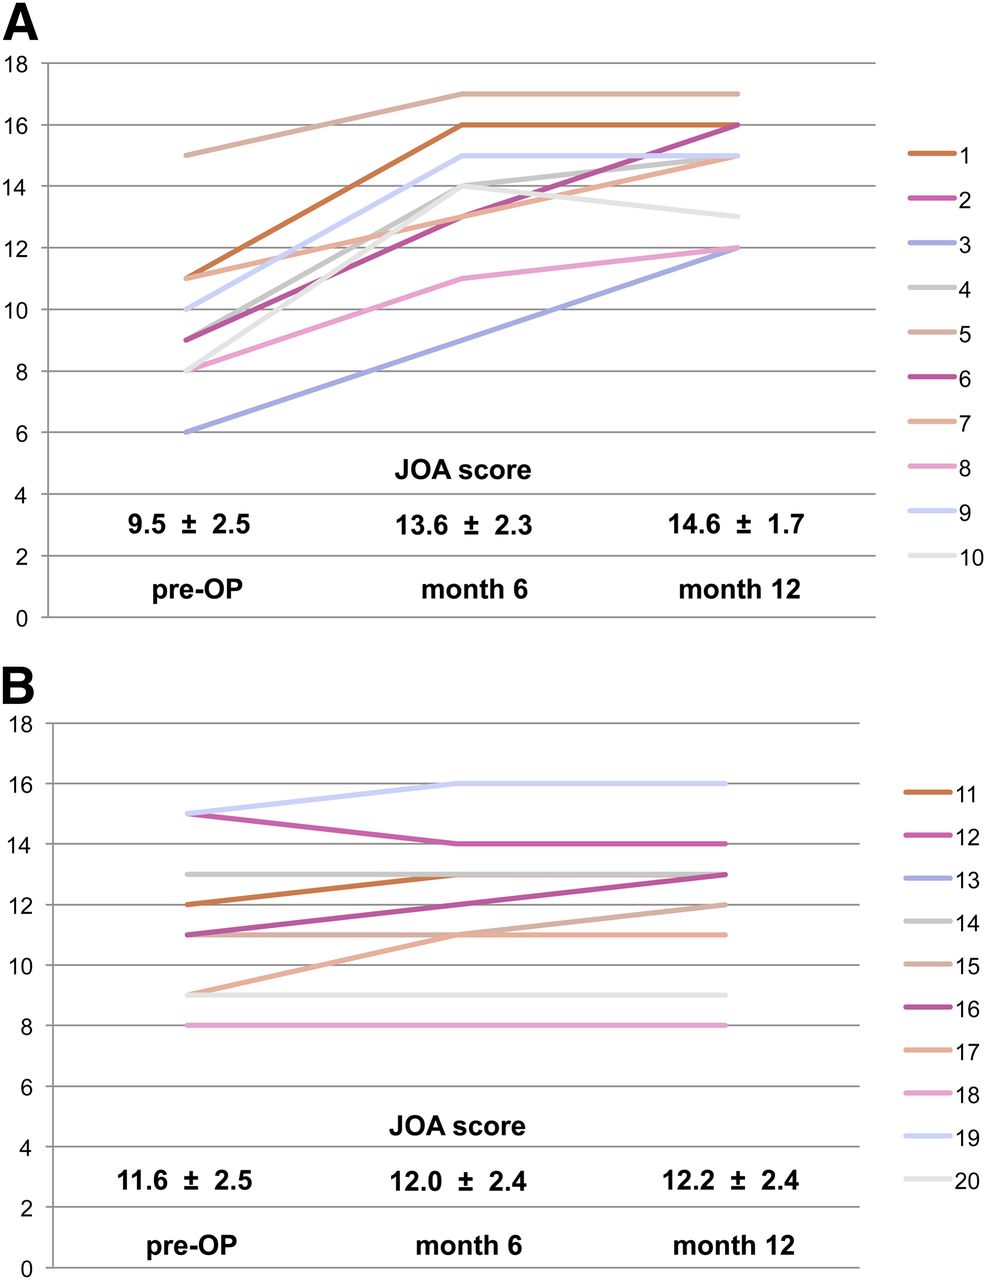
Preoperative JOA scores and postoperative changes of JOA scores in patients with myelopathy types 1 and 2 (A and B, respectively), assessed at 6 and 12 mo after decompressive surgery. Twelve months after decompressive surgery, patients with myelopathy type 1 (A) show favorable clinical recovery, with significant improvement of JOA scores (preoperative JOA score, 9.5 ± 2.5, vs. postoperative JOA score, 14.6 ± 1.7; P < 0.001). In contrast, patients with myelopathy type 2 (B) show no significant changes of JOA scores (preoperative JOA score, 11.6 ± 2.5, vs. postoperative JOA score, 12.2 ± 2.4; P = 0.081).
DISCUSSION
Our results suggest that focal glucose hypermetabolism at the level of stenosis occurs temporarily during the early course of compression-induced cervical myelopathy. 18F-FDG PET imaging revealed that the hypermetabolic pattern at the level of the cervical spine stenosis was reversible (Fig. 1; Supplemental Figs. 1 and 2), suggesting a functional impairment in a reversible phase of cervical myelopathy. Most importantly, these patients experienced a significantly better outcome after decompressive surgery. Therefore, in patients with myelopathy type 1 the presence of this metabolic pattern may indicate the time interval when decompressive surgery can lead to substantial clinical improvement. Additionally, the appearance of the focal glucose hypermetabolism at the level of stenosis seems to be associated with the phase of rapid clinical deterioration. In contrast, metabolic findings in patients with myelopathy type 2 may indicate an irreversible structural damage of the spinal cord in a more chronic stadium of cervical myelopathy. Thus, decompressive surgery may not lead to relevant improvement of myelopathy symptoms.
From the histopathologic point of view, structural tissue damage of the spinal cord in the chronic and irreversible phase of myelopathy is well described. An atrophy and loss of neurons in the gray matter and demyelination of the white matter have been demonstrated in biomechanical and autopsy studies (19,20). Consecutively, the spinal cord becomes thinner and a cystic degeneration can occur. In contrast, the exact pathophysiologic mechanisms and histologic changes within the spinal cord during a potentially reversible phase of cervical myelopathy are not clearly defined.
The focal hypermetabolism at the level of stenosis might be explained best by a compression-induced inflammatory response with intramedullary infiltration of glucose-consuming macrophages. The assumption that compressive myelopathy reflects a secondary neuroinflammation was based on results of animal studies with models of traumatic spinal cord injuries and cervical spondylotic myelopathy (9). Yu et al. recently provided evidence that cervical spondylotic myelopathy, a slow progressive compression injury to the cord and arguably the most prevalent form of spinal cord injury (8), induces innate immune responses that contribute to neuronal and oligodendrocyte death, similar to that seen in acute spinal cord injury (7). Furthermore, it could be demonstrated that the immunologic injury is mediated at least in part by Fas and Fas ligands (9)—that is, components of the immune response known to induce apoptosis. These novel results focus attention on the clinical importance of cervical spondylotic myelopathy and provide a rationale for targeting cell death by pharmacologic neuroprotection as well as for other medical treatment options in addition to treatment by the usual procedure of decompressive surgery (8,9).
On the basis of the experiences with other neuroinflammatory diseases (e.g., multiple sclerosis), it is supposable that treatment with corticosteroids may suppress the influx of inflammatory cells and subsequently the hypermetabolism in the compressed cervical spinal cord. Additionally, from animal models it is known that increased 18F-FDG uptake occurs in inflammatory tissue (21), and both the invasion of inflammatory cells and the subsequent increasing 18F-FDG uptake can be suppressed successfully by administration of corticosteroids (22).
In addition, besides a compression-induced inflammatory response, other factors may contribute to the increased 18F-FDG uptake in patients with cervical myelopathy. With regard to the limited resolution of PET, inflammation related to adjacent herniated disk material or arthritis of facet joints with spillover to the cervical myelon has to be considered. Furthermore, a temporarily increased neuronal activity due to mechanical compression may be hypothesized, but experimental data do not provide evidence for this assumption.
Thus far, only a few studies have investigated 18F-FDG uptake of the cervical spinal cord in compressive myelopathy in larger series of patients. Studies by Uchida et al. and Baba et al. reported preoperatively either a global reduction or a global increase of 18F-FDG uptake across the entire spinal cord independent of the level of stenosis (16–18). In a recent study of this group (23) including 24 patients with monosegmental degenerative cervical stenosis, a local disturbance of glucose metabolism at the level of stenosis and cord compression corresponding to the local intramedullary signal changes in MR imaging could be observed, which is in agreement with our results. In that study, which included a quantitative assessment of intramedullary signal changes in T1- and T2-weighted images, a separation of patients into myelopathy type 1 and type 2 groups was not performed, but 18F-FDG uptake was more sensitive for prediction of the patients’ clinical outcome after decompression than signal intensity on the MR imaging (23). Regarding signal alterations on MR imaging, the hypointensity in T1- but not the hyperintensity in T2-weighted MR imaging correlated with a poor clinical improvement after surgical decompression. The authors hypothesized that the high-intensity signal changes on T2-weighted images represented edema and gliosis within the spinal cord in an early and potentially reversible stage of compressive myelopathy. In contrast, a low-intensity signal in T1-weighted images could reflect myelomalacia, cystic degeneration, syrinx formation, and necrosis in a more chronic and irreversible stage of the disease (23).
It has to be considered that 18F-FDG PET is relatively expensive, not always available, and in the daily routine management of patients with cervical spine stenosis and cervical myelopathy not implemented. Past medical history, careful neurologic examination, and MR imaging are essential to diagnose a myelopathy. However, in a considerable number of patients, preoperative evaluation of outcome after decompressive surgery based on the clinical course and MR imaging findings is difficult (e.g., unknown onset of symptoms and clinical deterioration, long-term clinical course without deterioration, MR imaging not possible). In these patients, functional imaging using 18F-FDG PET may be an option to add valuable information for the preoperative evaluation of outcome.
CONCLUSION
A hypermetabolism of the cervical spinal cord at the level of cervical spine stenosis as indicated by an increased 18F-FDG uptake seems to be a marker for a potentially reversible phase of a compression-induced cervical myelopathy. The lesion of the spinal cord seems to be predominantly functional. Presence of this metabolic pattern reflects the time frame when decompressive surgery can lead to substantial clinical improvement. The focal hypermetabolism at the level of stenosis might be explained best by a compression-induced inflammatory response with intramedullary infiltration of glucose-consuming macrophages. This hypothesis was supported by recent evidence and provides a rationale for antiinflammatory medical treatment options, for example, corticosteroids to suppress the local hypermetabolism of glucose.
DISCLOSURE
The costs of publication of this article were defrayed in part by the payment of page charges. Therefore, and solely to indicate this fact, this article is hereby marked “advertisement” in accordance with 18 USC section 1734. No potential conflict of interest relevant to this article was reported.
Acknowledgments
We thank Suzanne Schaden, Cornelia Frey, and Elisabeth Theelen for valuable assistance in the PET studies.
Footnotes
↵* Contributed equally to this work.
Published online Aug. 5, 2013.
- © 2013 by the Society of Nuclear Medicine and Molecular Imaging, Inc.
REFERENCES
- Received for publication August 27, 2012.
- Accepted for publication April 4, 2013.


Jump to section
Related Articles
Cited By...
- No citing articles found.