


Abstract
Ex vivo autoradiographs of healthy kidney tissue from patients who received 111In-DTPA-octreotide (DTPA is diethylenetriaminepentaacetic acid) before nephrectomy showed very heterogeneous radioactivity patterns in the kidneys. The consequences of the reported inhomogeneities have been evaluated for radionuclide therapy with 90Y- DOTA-Tyr3-octreotide (DOTA is 1,4,7,10-tetraazacyclododecane-N,N′,N′′,N′′′-tetraacetic acid), 177Lu-DOTA-Tyr3-octreotate, and 111In-DTPA-octreotide by calculating dose distributions and dose−volume histograms (DVHs) for the kidneys. Methods: Monte Carlo radiation transport calculations were performed by using the MCNP code version 5. The autoradiography data were used in a 2-dimensional model of the kidney tissue sections. A voxel structure inside the MIRD Pamphlet 19 multiregion kidney model was developed to generate a 3-dimensional representation of the autoradiographs. Dose distributions were calculated for the β-emitter 90Y, the low-energy electron and γ-emitter 111In, and the β- and γ-emitter 177Lu. Isodose curves were generated for the 2-dimensional kidney sections and DVHs for the 3-dimensional kidney model. Results: The isodose curves for the high-energy β-emitter 90Y did not show a sign of the inhomogeneous activity distribution, apart from the cortex−medulla boundaries. Both 111In and 177Lu isodose curves follow the autoradiographic activity distribution exactly. The 2 γ-rays from 111In give higher doses to the low-radioactivity regions in the kidney sections. The DVHs show that the inhomogeneous activity distribution creates considerable volumes within the kidney and within the cortex with lower doses than the average kidney dose, together with volumes receiving much higher doses. This effect is most profound for 177Lu, but also 111In shows this heterogeneity in the dose distribution. Conclusion: Kidney dosimetry for radionuclide therapy can be based on average MIRD-based dose models for high-energy β-emitters (such as 90Y). In contrast, low-energy β-emitters (such as 177Lu) and Auger-electron−emitting radionuclides (such as 111In) produce dose distributions in the kidneys that are very dependent on the activity distribution pattern in the kidney or renal cortex. Complication probability models for renal tissue damage after radionuclide therapy with these latter nuclides need to be developed, as the existing models based on average dose to the kidney or cortex from external beam therapy experience are most probably not valid.
- kidney dosimetry
- dose volume histogram
- 90Y-DOTA-octreotide
- 111In-DTPA-octreotide
- 177Lu-DOTA-octreotate
- radionuclide therapy
Radiolabeled somatostatin analogs such as 111In-DTPA-octreotide (DTPA is diethylenetriaminepentaacetic acid) (OctreoScan; Mallinckrodt Medical BV) are most successful in detecting and imaging tumors expressing somatostatin receptors. As the receptor density is very high in certain types of tumors, often from neuroendocrine origin, therapeutic versions of the imaging compound were developed. Initially, trials with high activities of 111In-DTPA-octreotide were performed; in later studies 90Y-DOTA-Tyr3-octreotide (DOTA is 1,4,7,10-tetraazacyclododecane-N,N′,N′′,N′′′-tetraacetic acid) (90Y-edotreotide or 90Y-DOTATOC) was used. At present 177Lu-DOTA-Tyr3-octreotate is under investigation for therapy of neuroendocrine tumors. For all radionuclide peptide combinations it is of crucial importance to design the optimal therapeutic window with the tumor dose as high as possible and the normal tissue dose as low as achievable. Radiation dosimetry for the normal organs at risk—that is, kidneys and bone marrow in radionuclide therapy—is essential for optimizing patient-tailored therapy.
The emphasis of dosimetry for peptide receptor radionuclide therapy (PRRT) is aimed at the dose-limiting organs: the kidneys. In the phase I trials of 90Y-DOTA-Tyr3-octreotide the dose to the kidneys was calculated according to the MIRD method (1). According to this method, it was assumed that the retained radioactivity of radiolabeled octreotide was homogeneously distributed over both kidneys. The only anatomic “patient specificity” was introduced by using either the male or female phantom with a slight difference in kidney mass (299 g for the male and 275 g for the female). All patients were scheduled for a maximum renal dose of 27 Gy. This limit was set higher than the gold standard for conventionally fractionated external beam therapy of 23 Gy, which results in a 5% probability of developing severe late kidney damage within 5 y (2). The dose rate at which the kidney dose is given in PRRT is substantially lower than in external beam therapy, thus creating a situation with optimal possibilities for sublethal radiation damage repair, comparable to hyperfractionation.
The only reliable and to-this-date predictive dosimetry around the threshold for end-stage renal radiation disease has been performed for 90Y-DOTA-Tyr3-octreotide therapy. Before the first cycle of therapy the pharmacokinetics of renal uptake was determined for each patient by quantitative PET at 3 time points with the positron-emitting analog: 86Y-DOTA-Tyr3-octreotide (3). The cumulated activity in the kidneys for 90Y was calculated and used to determine the maximum allowed activity for each patient. Indeed, less renal toxicity was observed in patients from this trial in comparison with other trials with a similar compound (DOTATOC), where individual patient dosing was based on radioactivity per unit body surface area (4,5). The encountered cases of nephrotoxicity could not be explained by the MIRD-based kidney dosimetry, as all patients received an average dose of 28 ± 3 Gy.
Retrospectively, a relation between the renal dose and renal toxicity could be proven when the dose was corrected for the actual kidney mass, the activity uptake in the cortex, and the relative biological effectiveness of the dose delivery, due to dose rate and fractionation of the therapy (1,6,7). Kidney dimensions were determined from the patient's abdominal CT images and were used to correct the renal cortex dosimetry based on MIRD Pamphlet 19 (MIRD19) (8). The number of therapy cycles and initial dose rates were of relevance for calculating biologic equivalent doses according to the linear-quadratic (LQ) model (9). Although many more patients have now been treated with 177Lu-DOTA-Tyr3-octreotate (10) and in the past with high-activity 111In-DTPA-octreotide (11), no thorough patient-specific dosimetry evaluations are available.
PET using 86Y-DOTA-Tyr3-octreotide as well as SPECT using both 111In-DTPA-octreotide and 177Lu-DOTA-Tyr3-octreotate indicates that most of the renal radioactivity was concentrated in the cortex of the kidneys (12). Ex vivo autoradiography of healthy renal tissue from renal cancer patients showed inhomogeneous distributions of 111In-DTPA-octreotide in the cortex at millimeter-scale resolution (13). The ex vivo autoradiographs of the kidneys confirmed the uptake in the cortex, as observed on the SPECT and PET images, but also showed a very irregular distribution of the cortical radioactivity uptake. The highest uptake was centered in the juxtamedullary (JM) region of the cortex, which was histologically identified as healthy kidney. A striped pattern protruded to the outer regions of the cortex with a reduction of radioactivity uptake density in the outer cortex caused by its divergence. The medulla also showed regional variations in uptake; in general, the central part of the medulla showed the highest uptake. The regions bordering the cortex, however, showed lower uptake and also the striped pattern in the cortical uptake ends abruptly at the corticomedullary boundary. These findings are illustrated in the top left graphs of Figures 1A–1C.
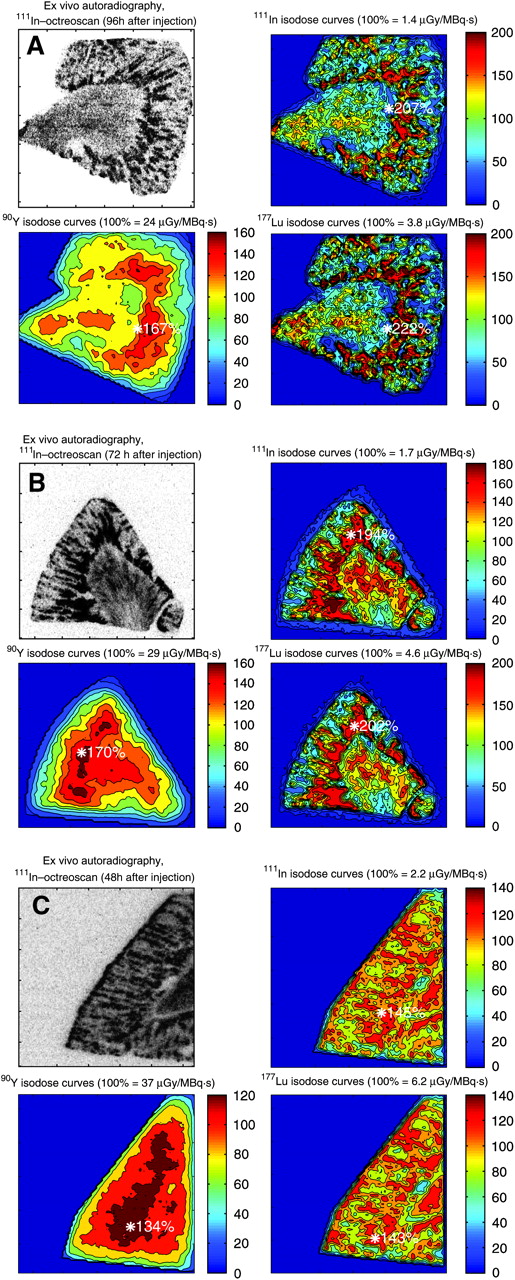
Ex vivo autoradiographs of kidney sections from 3 patients (A, B, and C) at different time intervals after administration of 111In-DTPA-octreotide. Dose factors are normalized to average dose to kidney segment, and isodose curves for 111In, 90Y, and 177Lu are 10%, 20%, 40% and, hence, with 20% increment to the maximum. Asterisk indicates position and value of maximum isodoses.
The objective of this study was to design a calculation model for the dose to the kidneys and its subregions for 90Y, 111In, and 177Lu, based on the observed inhomogeneous activity distributions inside the kidneys. Isodose curves for the 2-dimensional (2D) radioactivity distribution have been derived from the kidney autoradiographs. Dose−volume histograms (DVHs) for an extrapolated 3-dimensional (3D) activity distribution inside the stylized kidney model of MIRD19 are compared with homogeneous distributions. Analysis of DVHs of the kidney is considered to be essential in developing accurate dose−effect relationships for renal tolerance (2,14). Both the effects of inhomogeneities and therapy fractionation with the LQ model should be incorporated in a radiation nephrotoxicity threshold model for PRRT.
MATERIALS AND METHODS
Autoradiogram data of kidney samples from 3 patients with renal tumors were used. The methods used in gathering the ex vivo autoradiographs were described earlier (13). In brief: the male patients were injected with 220 MBq 111In DTPA-octreotide 2–4 d before nephrectomy. Disease-free kidney tissue sections of 10-μm thickness were exposed for 1 d to a phosphor imaging screen (Packard Instruments). The screens were analyzed with a Cyclone phosphor imager (Packard) with a spatial resolution of 500 μm for 111In.
The radioactivity distributions from the autoradiography data files were averaged over 4 × 4 pixel elements for the kidney samples obtained at 96 h (Fig. 1A) and at 72 h (Fig. 1B). The finer structure in the activity distribution of the sample at 48 h (Fig. 1C) made averaging over 3 × 3 pixels necessary. Pixel size was 0.092 mm/pixel. The averaging was performed to reduce the amount of input data and computation time. Furthermore, the resulting sizes of the voxels (0.37 and 0.28 mm, respectively) are more in proportion to the spatial resolution of the imager. Boundary surfaces were fitted to the autoradiographs, both on the outside border of the kidney and also between the cortex and medulla. The averaging and fitting was performed with the Matlab code (The Mathworks, Inc.). The equations for these surfaces were used to define the kidney segments in the Monte Carlo code MCNP5 (15) (Oak Ridge National Laboratory, Los Alamos, NM). The segments were made 1-cm thick to generate a 3D structure. The segments were superimposed by a rectangular grid structure corresponding to the averaging voxels (0.37 × 0.37 × 10 mm3 for Figs. 1A and 1B and 0.28 × 0.28 × 10 mm3 for Fig. 1C) for both the source definition and the dose calculation.
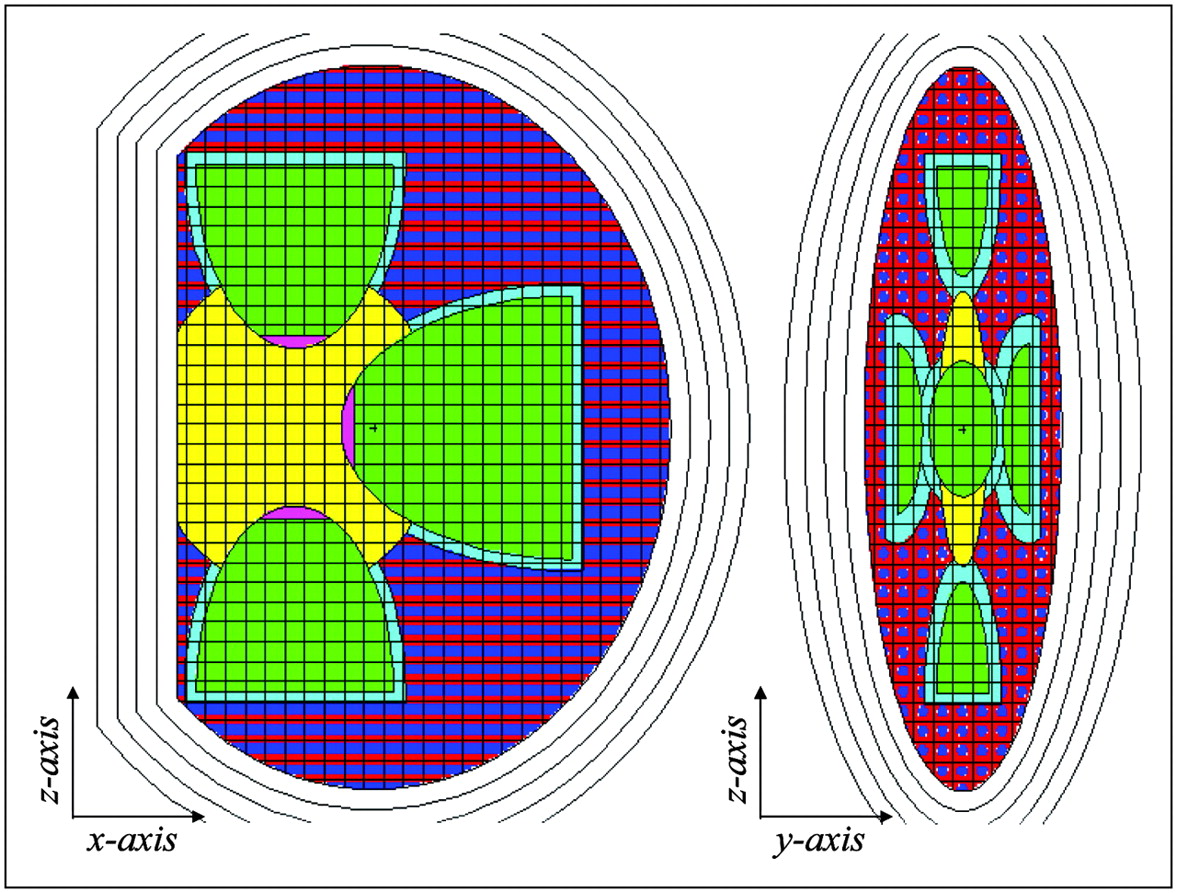
A stylized model of the 3D activity distribution was made for the MCNP5 code inside the MIRD19 multiregion kidney phantom (8) and is shown in Figure 2. The volumes of cortex, medulla, and pelvis were superimposed with 3-mm-sized voxels. Inside the voxels in the cortex volume cylinders of 1.7-mm diameter were positioned in the center to represent the streaky uptake pattern seen on the autoradiograph. The activity distribution in the 3D model was according to the average distributions on the 3 autoradiographs indicated in Table 1 (13). The cortex high radioactivity is assigned to the central cylinders in the voxels and to a 1.8-mm-thick region in the cortex aligning the medulla (JM region). The cortex low radioactivity is assigned to the remaining voxels in the cortex. The activity distribution in the medulla was assumed to be homogeneous, as the autoradiography results do not show the level of heterogeneity found in the cortex. This model is referred to as 3D voxel.

Adult-size MIRD19 multiregion kidney model in sagittal view (x−z) on left and in coronal view (y−z) on right, with overlying 3-mm-voxel grid in medullae (green), pelvis (yellow), and cortex (blue/red pattern). Voxels in cortex were given a 1.7-mm cylindric core representing medullary rays (MR in dark blue); together with a 1.8-mm-thick JM (in light blue) region they form the high-activity-uptake volume. Low-uptake cortex volume (non-MR) is shown in red. Papillae were not voxelized and are colored purple.
Radioactivity Distribution and Volumes of Kidney Regions Inside MIRD19 Kidney Model with High-Uptake (65 %IA) and Low-Uptake (5.8 %IA) Cortex Regions
As the reference condition, a homogeneous radioactivity distribution of 70.8% in the cortex and 29.2% in the medullae was considered. Two methods were applied to calculate the kidney dose for this situation. The data from MIRD19 were used for method 1 (named as MIRD19). In the second method the same 3-mm voxel structure was superimposed over the MIRD19 kidney model, without the central cylinder inhomogeneity, however (named as M19 voxel).
The Monte Carlo calculations with MCNP5 were performed to calculate the radiation transport inside the geometries for the high-energy β-emitter 90Y; the γ-ray, low-energy β-ray, and internal conversion electron emitter 177Lu; and the γ-ray and Auger electron emitter 111In. The emission data were obtained from the RADAR Web site (16). The typical number of particle histories necessary to constrain statistical fluctuations in the total energy absorbed for each voxel below 5% was 10 million for the electrons and 3 million for the γ-rays. MCNP computing times were approximately 50 h for the β-rays and approximately 100 h for the γ-rays on a 3-GHz personal computer.
A substantial part in the Auger electron spectrum (13% of energy emitted) of 111In is below the lowest energy threshold for MCNP of 1 keV. As no electron tracks are generated below this threshold, MCNP discards the energy emitted by these low-energy Auger electrons. The missing energy was added to the source voxels in the postprocessing phase.
The output data were analyzed with Matlab and Excel (Microsoft Corp.) software to produce isodose curves and DVHs. Summation of the different radiation components of the deposited energy for 111In and 177Lu was also performed in Matlab. The dose per decay to each voxel was calculated by dividing the deposited energy by its voxel mass. The relative biological effectiveness was equal to one for each component (β-rays, γ-rays, or low-energy (Auger) electrons). Both the dose distributions and the average dose to each kidney segment in the MIRD19 model were calculated to enable comparison with the published data from MIRD19.
RESULTS
2D Isodose Curves
The isodose curves for the 3 kidney segments show distinct features of the radiation characteristics of 90Y, 111In, and 177Lu (Fig. 1). With 90Y hardly any features of the uptake pattern are visible, apart from the increased dose to the cortex, whereas for 111In and 177Lu it follows more-or-less the radioactivity uptake pattern. 90Y also shows a larger dose gradient toward the outer surfaces of the cortex in comparison with the other 2 radionuclides, due to loss of the longer-ranged β-particles to the surrounding tissue. The maximum dose for all radionuclides is situated in the JM region.
The absorbed fractions of energy for the 3 autoradiography datasets in the cortex and medulla are compared in Table 2 with the values found for the 3D voxel model and for the homogeneous distribution MIRD19 kidney models (MIRD19 and M19 voxel). The results for autoradiographs A and B were in good agreement with the MIRD19 values for the β-rays and low-energy electrons. The x-rays and γ-rays, however, show lower absorbed energy fractions in the 2D models compared with the MIRD19 3D models.
Absorbed Fractions of Energy Emitted by 90Y, 111In, and 177Lu in Cortex and Medulla for 2D Autoradiographies A, B, and C, for 3D models with 70.8% of Activity in Cortex and 29.2% in Medulla
The dose factors, or dose per cumulated activity, for the various intraregion source target combinations are given in Table 3. The average doses to the cortex and medullae for the inhomogeneous activity were within 5% from the published MIRD19 values. For 177Lu, however, the reduction by the inhomogeneous activity distribution in the dose to the cortex is substantial: 11%. Because of the large γ-ray component in the dose, the dose reduction in the cortex for 111In was negligible. A reduction in dose to the cortex regions in between the medullary rays (non-MR) was determined as 34% for 90Y, 44% for 111In, and 76% for 177Lu in comparison with the average cortex dose. The contribution to the cortex dose for 111In by the Auger electrons below 1 keV was 7.6% of the total dose.
Renal Element Dose Conversion Factors (DF) for the 3D Models Defined in Table 2
DVHs
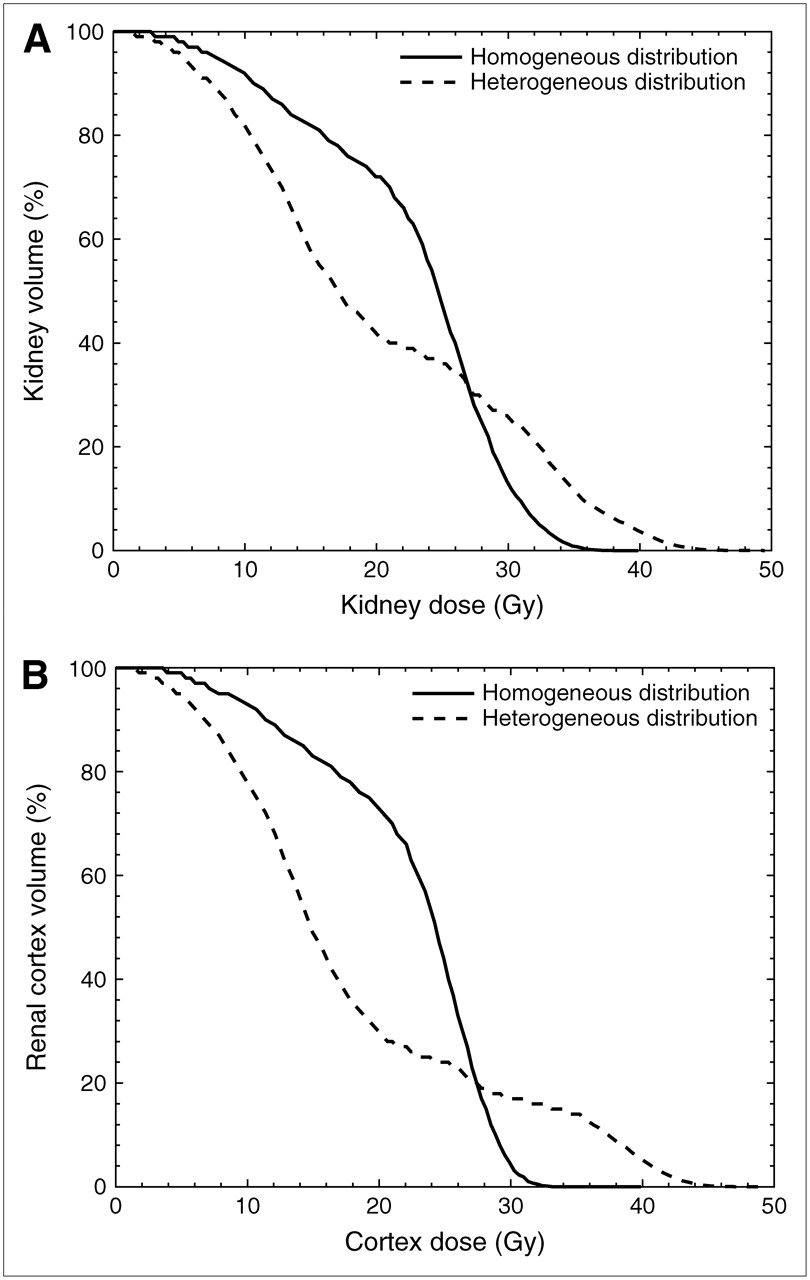
DVHs for the 3 radionuclides are shown in Figures 3, 4, and 5 for the homogeneous and inhomogeneous radioactivity distributions. The normalization of the dose was based on the MIRD19 dose to the cortex, which was set to a mean dose of 27 Gy. The DVHs for the homogeneous distribution show an almost block form around the average dose with deviations being caused by the penetrative nature of the radiation; 111In with its γ-rays and 90Y with its high-energy β-particles show a more shallow curve in comparison with the low-energy β-emitter 177Lu. The DVH for the kidney volume resembles that for the cortex volume, apart from the low dose part for 177Lu and, to a lesser extent, for 90Y, where the zero to low dose to the pelvis (4.3% of the kidney volume) manifests itself. In the dose region between 20 and 30 Gy, the dose to the medulla shows up as a shoulder in the reduction of the kidney volume. Although the irradiation differs quite strongly from inhomogeneous irradiation by external x-ray beams, the same methods (17) can be used to extract effective volumes from these DVHs. Effective volumes together with other DVH characteristics are summarized in Table 4.

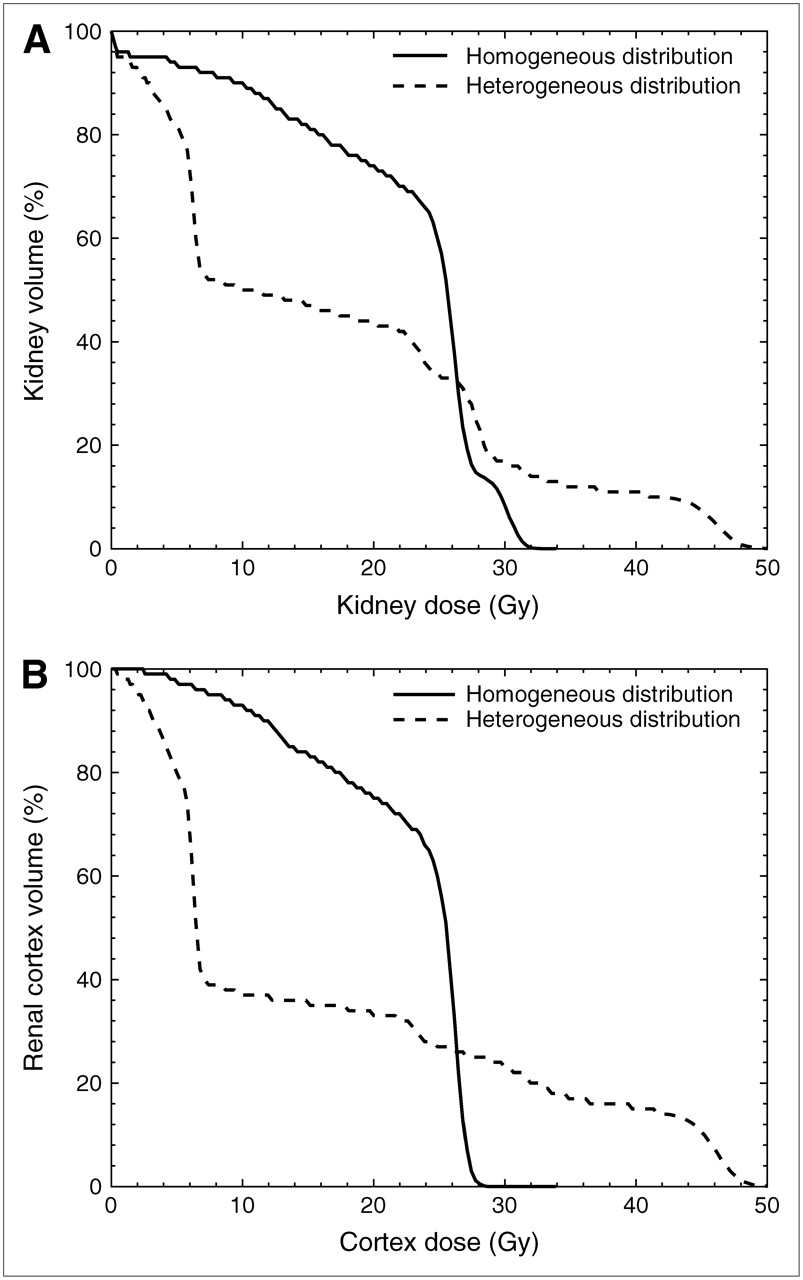
DVHs for kidney (A) and cortex (B) for 90Y source activity: 71% in cortex and 29% in medullae in either a homogenous distribution or a distribution following the mean autoradiograph results. Average dose to cortex was taken as 27 Gy, calculated according to MIRD19 (8).
DVHs for kidney (A) and cortex (B) for 111In source activity: 71% in the cortex and 29% in medullae in either a homogenous distribution or a distribution following the mean autoradiograph results. Average dose to cortex was taken as 27 Gy, calculated according to MIRD19 (8).

DVHs for kidney (A) and cortex (B) for 177Lu source activity: 71% in cortex and 29% in medullae in either a homogenous distribution or a distribution following the mean autoradiograph results. Average dose to cortex was taken as 27 Gy, calculated according to MIRD19 (8).
Summary DVH Data for Homogeneous and Heterogeneous Activity Distribution in Kidney Based on a 27-Gy Dose to Cortex Following MIRD19 (8)
When the radioactivity is assumed to be homogeneously distributed, 5% of the kidney volume would get a dose above 31–32 Gy (D05) for all nuclides. The location of this maximum was outside the cortex, as the cortex D05 ranges between 27 and 30 Gy. The relative volumes receiving 70% of the mean dose of (70% x 27 = ) 18.9 Gy (V70) are for the homogeneous distribution around 75% of the total renal volume.
With the heterogeneous radioactivity distribution D05 rises considerably for 111In and 177Lu to 39 and 46 Gy, respectively. The maximum dose is then found within the cortex. V70 drops by 30% with the heterogeneous distribution and for the cortex even by 40%. The effective volume (17,18) shows the lowest values for the heterogeneous distribution of 177Lu.
DISCUSSION
In nuclear medicine traditionally doses are based on volume-averaged uptake values over the region of interest (ROI) using the planar imaging conjugate view method. With this method the only possible outcome is a mean dose to the organ by fitting a time–activity curve to the ROI data and using the resulting cumulated activity as input for a dosimetry code, such as OLINDA (16). With quantitative PET and in future quantitative SPECT imaging, activity uptake patterns can be measured 3-dimensionally. Ideally, also the dosimetry will have to go to 3 dimensions. In PRRT with, for example, 90Y-DOTA-Tyr3-octreotide it is of great importance to know the constraints in using average kidney dose as a predictor of end-stage renal disease. Replacing average dose by DVHs may be necessary for short-range β-emitters and electron emitters when the activity is heterogeneously distributed.
There is little knowledge on the effect of heterogeneous dose distributions in the kidneys. In rats the effects of regional distribution of the renal radioactivity uptake has been studied as a function of the size of the antibody to which the radionuclide is linked (19). More efficient filtering of smaller antibodies by the glomeruli relatively increases the cortical uptake. Peptide reabsorption occurs in the proximal tubules. Isodose curves were calculated and showed that the combination of short-ranged radiation and small-size antibodies (or peptides) made separate dose calculations for the rat cortex and medulla necessary.
The heterogeneous uptake pattern of 111In-DTPA-octreotide in the human kidney has a large influence on the dose distribution inside the kidney, especially for short-range β-emitters and electron emitters. The calculated isodose curves for 111In and 177Lu show steep gradients between the regions with high and low radionuclide uptake. DVHs are a better instrument for evaluating the differences between the 3 radionuclides considered in this study. Especially 177Lu seems promising in tolerating higher kidney doses in comparison with 111In and 90Y. With an average dose of 27 Gy to the cortex, 60% of the cortex volume (D40) receives a dose below 7.1 Gy with 177Lu. 111In gives a D40 below 17 Gy, and 90Y shows a D40 of 17.5 Gy. The maximum dose to the cortex is, however, the highest for 177Lu: 5% of the cortex volume (D05) gets a dose above 47 Gy, whereas 111In gives a D05 of 40 Gy and 90Y gives a D05 of 25 Gy.
Differences between the dose conversion factors derived from MIRD19 and the values for homogeneous voxelized distribution are evident for 90Y and 177Lu. This could be due to the use of different Monte Carlo codes; for MIRD19 the EGS code was used, whereas in this work MCNP was used. Also the voxel structure may cause boundary problems, such as partial-volume effects in voxels crossing the kidney−region boundaries.
By focusing on the dose to the cortex we assume that this region is responsible for the radiation-induced end-stage renal disease observed after radionuclide therapy in some patients. The experience in external beam radiotherapy (XRT) kidney dosimetry is quite contrary compared with PRRT: The dose to the outer regions of the cortex is lower than that to the regions bordering the medulla. Also the heterogeneity in the radioactivity uptake in the kidneys for PRRT could very well show us the functional subunits (FSUs) of the kidney: the nephrons. Unfortunately, it has not been possible to get good histology of the tissue responsible for the heterogeneous renal radioactivity uptake pattern of 111In-DTPA-octreotide. It is then questionable whether the radiation dose–response of the kidneys still can be considered to follow the behavior typical for parallel structures; in external beam therapy this was concluded from the fact that the critical fraction of FSUs needed to maintain kidney function was determined to be 0.77 (20). Adjacent unirradiated FSUs will take over the function of the irradiated FSUs, and cell migration from the unirradiated part to the irradiated elements may restore the functional status of the kidney.
The structure of the radiation damage with PRRT is, however, very different; it is expected to be maximal in the JM region with all tubuli leading into the medulla. When all tubuli in this region get doses well above the threshold for damage, no neighboring elements will remain to take over their function. Whether cell migration from up- or downstream unirradiated parts of the affected tubuli is fast enough to repair its function seems unlikely. However, the observed clinical experience is that high-dose 111In-DTPA-octreotide and 90Y-DOTA-Tyr3-octreotide therapy, with average kidney doses of 27 Gy, leading to JM doses of 39 and 32 Gy, respectively, for the heterogeneous distribution was given without subsequent major renal problems (1). More specifically, the tubular function showed no clinically relevant deterioration, either shortly after PRRT or during long follow-up. Therapy with 177Lu-DOTA-Tyr3-octreotate at an average kidney dose of 23 Gy, which still leads to a JM dose of 40 Gy, is reported to be even less toxic to the kidneys. The distribution and the size of the glomeruli in the cortex are not homogeneous (21,22), but it is unclear whether this also reflects their contribution to the total kidney function. High doses to the JM regions in the cortex could very well devastate the glomeruli in that region, so the renal function must be maintained only by the glomeruli in the outer cortex. Still, both in the dose–response of the kidney (6) as in the clinical pattern of radiation-induced renal disease by PRRT, no overt unexplained differences were observed from the situation after kidney radiation exposure by XRT.
A commonly applied method in XRT for reducing the DVH data to a single dose parameter is the effective volume method (17,18). Each voxel for a parallel structured organ obeys the same dose–volume relationship as the whole organ. The tolerance dose TD(v) after uniform radiation to a partial volume v depends on the tolerance dose for uniform irradiation of the whole organ (v = 1) by the Lyman equation: TD(v) = TD(1) · v−n .The volume dependence parameter n = 0.7 (23) was obtained by fitting to the kidney tolerance data of Emami et al. (24). Each step in the kidney DVH of volume ΔVi with dose Di is then transformed to an effective volume in the adjacent dose bin with higher dose, which is iterated until each volume section of the DVH is transformed to the effective volume with a maximum dose Dm by:
The effective volumes for 90Y, 111In, and 177Lu are given in Table 4. Homogeneous radioactivity distribution in the cortex creates a dose distribution as if just 56% (111In) to 72% (177Lu) of the cortex volume is homogeneously irradiated with the maximum dose of 30 Gy and 27 Gy, respectively. When the activity is distributed according to the autoradiography data the effective volume drops especially for 177Lu to 24% with a higher maximum at 47 Gy. In the case of 90Y the effective volume shows a lower decrease when introducing heterogeneity, but also the maximum drops from 29 to 25 Gy, as the MIRD19-based dosimetry overestimates the dose to the cortex for inhomogeneous 90Y activity distribution.
In PRRT there is hardly any possibility of actively shaping its DVH to a safer profile, unlike in XRT. The only possibility would be to change from 90Y to 177Lu, when the activity is distributed heterogeneously. Again, it must be stressed that partial irradiation in XRT fields is very different from the dose heterogeneity observed with PRRT. In XRT either a single kidney or the upper poles of both kidneys are irradiated. It is, however, logical to expect that the threshold for late kidney radiation damage after therapy with 177Lu-DOTA-Tyr3-octreotate will show an even higher shift from the external beam threshold than that observed with 90Y-DOTA-Tyr3-octreotide, both due to the heterogeneous dose distribution as well as due to the longer half-life. Taking the Lyman equation literally, this shift for the effective volume of 24% for 177Lu will be a factor of (v−n = 0.24−0.7 = ) 2.7. In reality this shift will be lower, as the observed heterogeneity is undoubtedly a transient situation, but even with the homogeneous activity distribution Veff = 72% leads to a shift in tolerance dose with a factor of 1.26. This would indicate a tolerance dose for 177Lu of 29 Gy instead of 23 Gy.
CONCLUSION
Heterogeneous radioactivity distribution in the kidneys has only consequences to the dose distribution for low-energy β-emitters and electron emitters such as 111In and 177Lu. Large volumes of the cortex get smaller doses than average with 111In and 177Lu. The higher doses to the kidney regions with high radioactivity uptake do not create a higher incidence of renal damage in clinical practice compared with therapy with 90Y. The use of DVHs instead of average doses is strongly advocated for all radionuclides considered, irrespective of any heterogeneity in activity distribution over the kidney. In the case of the short- and medium-range electron emitters, such as 111In and 177Lu, DVHs give a better indication of relative volumes that will exceed tolerance doses. PRRT based on 90Y, emitting longer-ranged β-rays, will create more dose averaging inside the kidney regions. The consequences of heterogeneous dose distribution in the kidney for radiation damage to its functional subunits are not clear. However, if it follows the Lyman relationship, an additional sparing of the kidney of minimally a factor 1.25 can be expected. It is, however, rarely possible to obtain activity distribution data on the tissue level.
Footnotes
-
COPYRIGHT © 2007 by the Society of Nuclear Medicine, Inc.
References
- Received for publication June 13, 2006.
- Accepted for publication October 19, 2006.


Jump to section
Related Articles
Cited By...
- Beyond Average: {alpha}-Particle Distribution and Dose Heterogeneity in Bone Metastatic Prostate Cancer
- Impact of Single-Time-Point Estimates of 177Lu-PRRT Absorbed Doses on Patient Management: Validation of a Trained Multiple-Linear-Regression Model in 159 Patients and 477 Therapy Cycles
- A Realistic Multiregion Mouse Kidney Dosimetry Model to Support the Preclinical Evaluation of Potential Nephrotoxicity of Radiopharmaceutical Therapy
- A Hepatic Dose-Toxicity Model Opening the Way Toward Individualized Radioembolization Planning
- Individualized Dosimetry of Kidney and Bone Marrow in Patients Undergoing 177Lu-DOTA-Octreotate Treatment
- Dosimetric Analysis of 177Lu-cG250 Radioimmunotherapy in Renal Cell Carcinoma Patients: Correlation with Myelotoxicity and Pretherapeutic Absorbed Dose Predictions Based on 111In-cG250 Imaging
- 4-Step Renal Dosimetry Dependent on Cortex Geometry Applied to 90Y Peptide Receptor Radiotherapy: Evaluation Using a Fillable Kidney Phantom Imaged by 90Y PET
- Radioguided Surgery and Systemic Radionuclide Therapy of Neuroendocrine Tumours
- MIRD Pamphlet No. 20: The Effect of Model Assumptions on Kidney Dosimetry and Response--Implications for Radionuclide Therapy
- CELLDOSE: A Monte Carlo Code to Assess Electron Dose Distribution S Values for 131I in Spheres of Various Sizes