


Abstract
With the advantages of the increased sensitivity of fully 3-dimensional (3D) PET for whole-body imaging come the challenges of more complicated quantitative corrections and, in particular, an increase in the number of random coincidences. The most common method of correcting for random coincidences is the real-time subtraction of a delayed coincidence channel, which does not add bias but increases noise. An alternative approach is the postacquisition subtraction of a low-noise random coincidence estimate, which can be obtained either from a smoothed delayed coincidence sinogram or from a calibration scan or directly estimated. Each method makes different trade-offs between noise amplification, bias, and data-processing requirements. These trade-offs are dependent on activity injected, the local imaging environment (e.g., near the bladder), and the reconstruction algorithm. Methods: Using fully 3D whole-body simulations and phantom studies, we investigate how the gains in noise equivalent count (NEC) rates from using a noiseless random coincidence estimation method are translated to improvements in image signal-to-noise ratio (SNR). The image SNR, however, depends on the image reconstruction method and the local imaging environment. Results: We show that for fully 3D whole-body imaging using a particular set of scanners and clinical protocols, a low-noise estimate of random coincidences improves sinogram and image SNRs by approximately 15% compared with online subtraction of delayed coincidences. Conclusion: A 15% improvement in image SNR arises from a 32% increase in the NEC rate. Thus, scan duration can be reduced by 25% while still maintaining a constant total acquired NEC.
With the advantages of the increased sensitivity of fully 3-dimensional (3D) PET for whole-body imaging come the challenges of more complicated quantitative corrections and the computational burden of the image reconstruction process. The fully 3D acquisition also leads to an increase in the axial extent of the random coincidence event field of view (FOV) relative to the true coincidence event FOV, which is even more significant for scanners with larger radial FOVs relative to the end-shield aperture (1, 2) This relationship is illustrated in Figure 1. The most common method of correcting for random coincidences is a real-time subtraction of a delayed coincidence channel, where one of the single-photon events has an arbitrary large time delay (e.g., 128 ns) before testing for coincident photons within a 2τ time coincidence window, where τ is typically 2–6 ns (3). Since a delayed coincident event cannot arise from a true or scattered coincidence, a delayed coincidence sinogram contains only random coincidences. The corresponding sinogram of prompt coincidence events (those detected in the 2τ time coincidence window) also includes true and scattered coincidences as well as random coincidences. The number of random coincidences detected as delayed coincidences will equal, on average, the number of random coincidences in the prompt coincidence sinogram. With a real-time or “online” correction for random coincidences, the delayed events are subtracted from the prompt coincidences sinogram as they occur. More precisely, we can write, using mean values, that P = T + S + R and D = R, so the correction for random coincidences is T + S = P − D, where P, T, S, R, and D are the numbers (or rates) of prompt, true, scattered, random, and delayed coincidences. This provides an accurate correction for random coincidences but also increases statistical noise in the net (prompt) − (delay) coincidence sinogram. In other words, the estimate of the random coincidences is noisy, and correcting for random coincidences by subtracting a noisy estimate increases the noise in the net (prompt) − (delay) coincidence sinograms. Reducing the variance in the estimate of the random coincidences will reduce the variance in the reconstructed image. For studies with high ratios of prompt/delayed coincidences—for example, an FDG brain scan—the increase in statistical noise is not significant. Whole-body PET studies, however, often are noisy due to the short scan time per bed position and with random/true coincidence ratios approaching or exceeding 100%. The resulting (prompt) − (delay) coincidence sinograms have high levels of statistical noise, which is propagated into the reconstructed image. The net effect of changes in prompt and delayed coincidence rates on the statistical quality of the acquired sinograms can be quantified with the noise equivalent counts (NECs) figure of merit (4):
 Eq. 1 wherefFOV is the fraction of the FOV occupied by the patient and k reflects the variance contributed by the random coincidence estimation method. Strother et al. demonstrated that
  for a sinogram is proportional to the image signal-to-noise ratio (SNR) at the center of a uniform cylinder when the image is reconstructed with filtered backprojection (FBP) (4). This formulation assumes no additional variance contributed by the scatter estimation method, which is feasible with the model-based methods of Ollinger (5) and Watson et al. (6).

Illustrative axial cross-section of cylindric scanner with and without slice-defining septa. Removing septa increases sensitivity by allowing detection of true coincidences that are not perpendicular to scanner axis but also increases FOV for activity that can generate random coincidences. 2D = 2-dimensional.
For the standard random coincidence correction technique based on subtraction of delayed coincidences, we have k = 1 due to the additional noise of the random coincidence estimate whereas, for a noiseless random coincidence estimation method, k = 0. Estimated NEC rates, based on the work of Lartizien et al. (7), for a fully 3D scan centered over the abdomen (liver) of a 170-cm-tall patient weighing 70 kg scanned on a Siemens/CTI ECAT HR+ scanner are shown in Figure 2. We can observe the increase in effective counting rate by assuming a noiseless estimate of the random coincidences (k = 0).
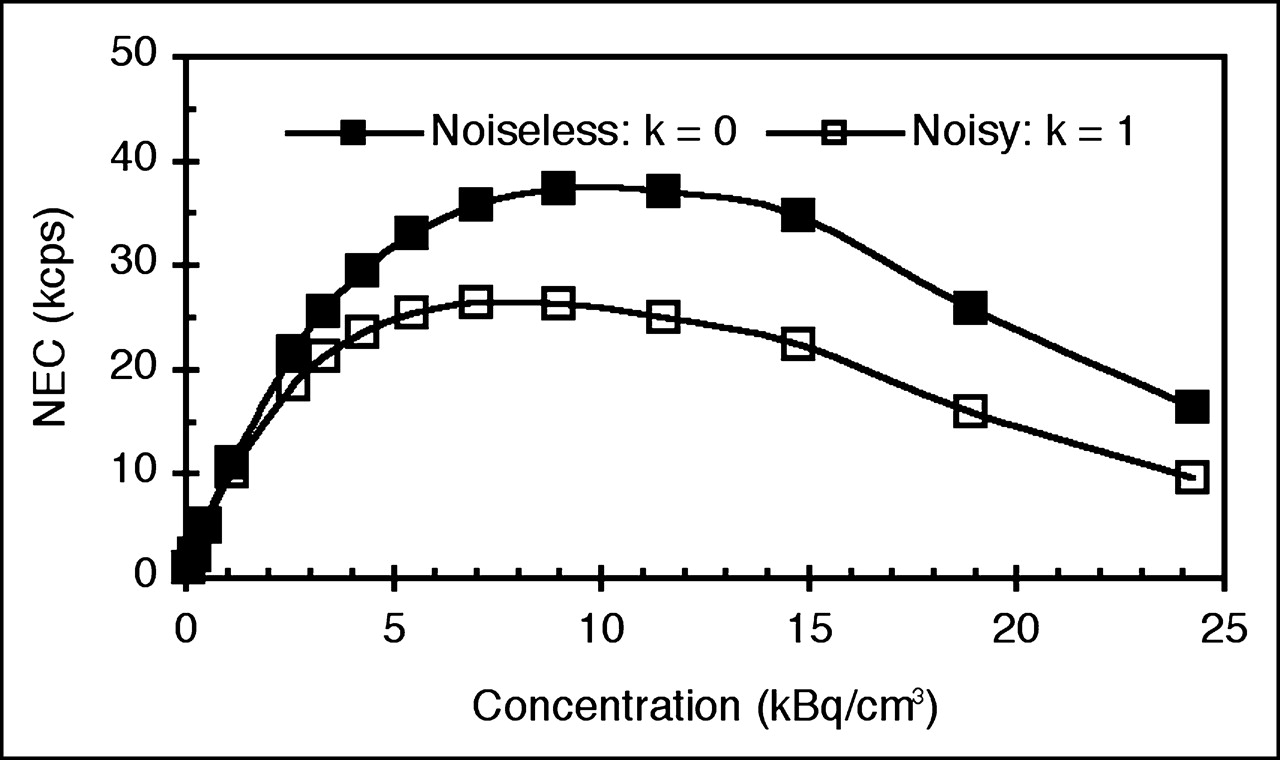
Estimated sinogram NEC rates (7) for a fully 3D patient scan centered over liver for ECAT HR+ scanner show increase in NEC rates by using a noiseless random coincidence estimation method (k = 0) relative to subtraction of delayed coincidences (k = 1).
The online subtraction of delayed coincidences results in a sinogram already corrected for random coincidences at the end of the patient scan, thus minimizing sinogram transfer and processing times. The disadvantage of this approach, as illustrated in Figure 2, is the reduction of the effective counting rate arising from the noise in the delayed coincidences. If the variance of the estimated random coincidences can be reduced, this can be used to reduce image noise or reduce scan duration for an equivalent level of image noise.
Two techniques have been proposed for reducing the variance of the estimated random coincidences. The first method, referred to as the “smoothed-delays” estimation method, is to acquire the delayed coincidences in a separate sinogram, rather than subtracting them in real-time from the prompt coincidence sinogram. Since the orientation of delayed coincidences is essentially random, the noise in the delayed coincidence sinogram can be suppressed by smoothing (or, more accurately, variance reduction methods). The essentially noiseless delayed coincidence sinogram is then subtracted from the prompt coincidence sinogram. To avoid introducing bias, the smoothing of the delayed coincidence sinogram must be done carefully, as there is high-frequency structure introduced by the detector efficiency variations (8–10). Badawi et al. also demonstrated that, when the Casey–Hoffman method was extended to fully 3D sinograms, the variance of the random coincidence estimate was reduced to 0 < k ≪ 1 (10). Collecting and smoothing the delayed coincidences as a separate sinogram reduces the noise in the estimated randoms coincidence rates but requires the collecting, transfer, and processing of a separate sinogram in addition to the prompt coincidence sinogram, which can be a significant burden for multibed 3D whole-body studies.
The second method, referred to as the “singles-based” estimation of random coincidences, calculates the mean random coincidence rate 〈Rij〉 for each line of response (LOR), or sinogram element indexed by detectors i and j, by using the well-known relationship (3):
 Eq. 2 where τ is the coincidence time window and si is the single-photon event rate (including dead time) of detector i. Using the single-photon event rate to estimate the random coincidences by Equation 2 gives an essentially noiseless estimate of the random coincidences. Thus, the k = 0 term in Equation 1 results in a higher NEC rate. To use Equation 2, however, the single-photon flux rates should reflect those single photons that can lead to random coincidences, as photons being evaluated for coincidence must first meet several criteria for energy and approximate location, and so forth. In other words, the single-photon rates have to be measured for each detector at an appropriate point in the data- processing stream. If these conditions are met, then the mean random coincidence rate for each LOR can be reliably estimated using the singles-based approach (11). In this case, only the prompt coincidence sinogram needs to acquired, transferred, and processed, unlike the smoothed-delayed approach. A potential disadvantage of this approach is the introduction of bias by incorrect estimation of any of the factors in Equation 2.
If single-photon rates are not measured at the appropriate point in the data-processing scheme, then Equation 2 cannot be used directly. A modification proposed by Rokitta et al. (12) is to acquire a high-count delayed coincidence reference scan that can essentially be scaled by the measured single-photon rates as a estimate of the random coincidence. Such a calibration sinogram should be measured at appropriate counting rate levels to include detector effects such as dead time or degraded resolution.
An alternative modification of singles-based estimation uses the intrinsic detector efficiencies for true coincidences (corrected for dead time), which are stored for use by the component-based normalization method (13). This approach, which is used in this study, is required when the recorded singles are averaged over multiple adjacent detectors. It avoids the need to acquire a correction sinogram but introduces bias due to any differences between detected single and coincident photons in terms of dead time, pulse pile-up, and energy spectra. In addition, there is an averaging effect in that only the rate for a group of detectors is reported. We modeled this bias with a global scale factor, α(si, sj), that also depends on single-photon rates (for dead-time differences) and that implicitly includes any effects of patient size, which can effect the energy distribution of the single photons. Using this model we have:
 Eq. 3
Eq. 3
These last 3 methods are all based on estimating random coincidences from single-photon rates, and, although there are minor differences between them, we will consider them equivalent in comparing them to the delayed coincidence method. A summary of the general methods for estimating random coincidences is presented in Table 1, which summarizes the trade-offs between the different techniques.
Methods for Estimating Random Coincidences
In this article, we investigate the impact of the method of estimating random coincidences on the SNR measured in the reconstructed image, using both analytic and iterative reconstruction methods, and compare these results with those predicted by the NEC rates. We first determine the lower limit (k = 0) and the upper limit (k = 1) of the SNR using simulations of a volumetric whole-body phantom. We use 50 realizations of simulated fully 3D whole-body PET scans for the ECAT HR+ PET tomograph with counting rates determined for different activity concentrations. In clinical practice, the low-noise (k = 1) methods are preferred for fully 3D acquisitions, so the second phase investigated the differences between the 2 low-noise methods, referred to as smoothed-delays and singles-based estimation method. This was done with measured phantom data collected as a gated acquisition (14, 15) with an ECAT HR+ PET tomograph. Finally, we use the results of the simulation and phantom studies and the counting rate statistics from 84 patient studies to predict the impact in clinical studies of the variance reduction techniques on the sinogram and image SNRs.
MATERIALS AND METHODS
Fully 3D Whole-Body Simulation
Generation of Sinograms.
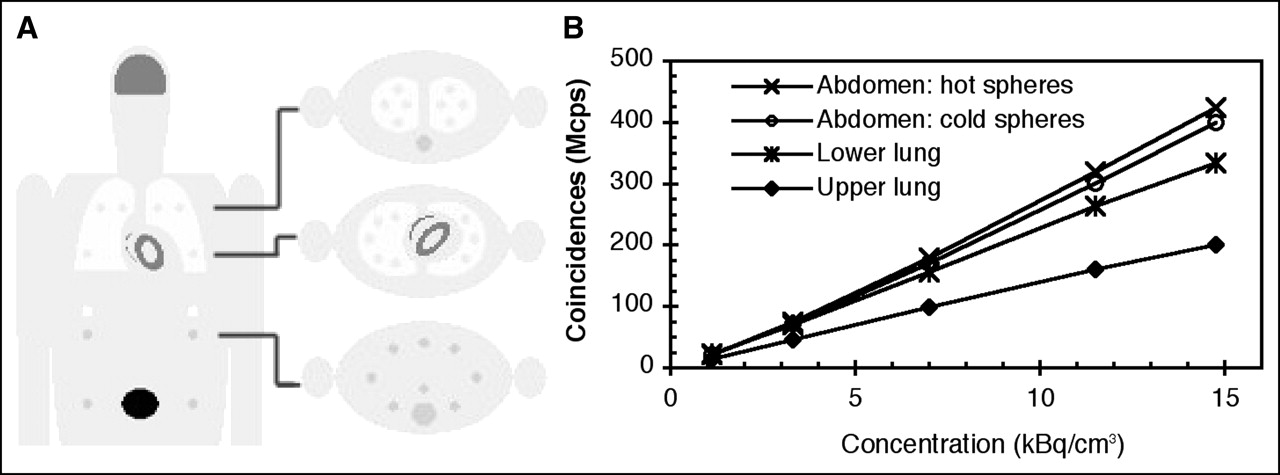
We used an analytic simulator to generate sinogram data of a volumetric whole-body phantom with accurate modeling of noise and resolution properties, including the effect of random coincidences from activity outside the axial FOV (16). The phantom was composed of an extended MCAT phantom with 5 of the transaxial planes containing hot or cold lesions as shown in Figure 3A. In each plane, 8 spheric lesions were simulated with a diameter of 20 mm (volume, ∼86 voxels) and a target-to-background ratio of 2:1. The scanner model was based on the ECAT HR+ PET scanner. Fifty noisy realizations of the phantom were generated for each of the 5 whole-body PET acquisitions corresponding to different injected activity levels. For each realization, 7 bed positions were simulated in 3D mode to cover the entire phantom. The counting rate statistics were calculated to match the counting rate estimated for patients (7). Table 2 summarizes the injected activity levels and the total number of true, scattered, and random coincidences used as an input to simulate the bed position centered over the abdomen (liver). As a consistency check, the simulated counting rates for acquisitions centered over the upper and lower lungs were compared with the average values of 23 fully 3D patient scans acquired on an ECAT HR+ scanner for the same regions of the body.

Test phantom. (A) Coronal and 3 of 5 transverse planes of test phantom containing hot and cold test targets. (B) Representative total number of coincidences (T + S + R) used for 4 of the bed positions in simulations as a function of the activity level at scan start.
Count Rates Used to Simulate 5 Whole-Body Acquisitions with Different Activity Concentrations
We used 2 methods to correct for the random coincidences. The first method subtracted a noiseless random coincidences sinogram from the noisy prompt coincidences. Each LOR in the noiseless random coincidences sinogram was set to the mean value used to generate the Poisson random deviate used as the number of random coincidences for the LOR in the prompt coincidences sinogram. This corresponded to the k = 0 case. The second method corresponded to k = 1 and subtracted a noisy sinogram of Poisson random deviates from the prompt coincidences to simulate the standard online subtraction technique.
In addition to random coincidences, the noise in each sinogram also included the effects of isotope decay, detector efficiency variations, scatter, attenuation, and detector resolution. The attenuation and scattered coincidence corrections were noise free.
Reconstruction Algorithms.
Two different algorithms were used to reconstruct the fully 3D sinograms into 222 image planes of 128 × 128 voxels; each voxel was 5 × 5 × 4.75 mm in size. The first algorithm used the Fourier rebinning algorithm (FORE) to resort the fully 3D sinograms into a stack of 2-dimensional (2D) sinograms (17). The sinograms were then reconstructed with standard 2D FBP, using a Hanning apodizing window rolled off at 0.32 of the Nyquist frequency. The second algorithm was the FORE+(AW)OSEM algorithm (OSEM is ordered-subsets expectation maximization) (18), which includes attenuation weighting (AW) in the model of photon statistics and has been shown to improve detection performance as compared with FORE+OSEM or FORE+FBP, where the effect of attenuation is ignored (19). The FORE+(AW)OSEM parameters of 4 iterations, 16 subsets, and 6-mm 3D gaussian postreconstruction filtering were chosen to match values used routinely for clinical applications at our institution. The whole-body image volume was generated by concatenating the 7 bed positions and using weighted averaging of the overlapping acquisition planes.
Data Analysis.
The figures of merit used for the analysis are summarized here and are precisely defined in the Appendix: (a) the signal-to-noise ratio (SNRS =  ) in sinogram space, (b) the recovery coefficient (RC), (c) the SNR in image space (SNRI), (d) the root-mean-square error (RMSE), and (e) the contrast-to-noise ratio (CNR), which is related to lesion detection calculated using a non–prewhitening matched filter (20). The image-based figures of merit were averaged over all VOIs in each plane as indicated in Figure 3.
Anthropomorphic Torso Phantom
Acquisition Description.
We used an elliptic torso phantom (Data Spectrum) with 6 inserted spheres: 3 hot spheres with radii of 6.0, 10.9, and 13.9 mm and 3 cold spheres with radii of 7.9, 12.6, and 15.6 mm. The main chamber and the hot spheres were filled with an activity concentration of 7.4 kBq/cm3 and 14.8 kBq/cm3 of 18F-FDG to obtain a target-to-background ratio of 2:1. These activity concentrations were chosen such that the NEC rate approximately matched the optimal value for a patient with the abdomen positioned in the axial FOV (7).
The phantom was scanned on an ECAT HR+ tomograph in the University of Pittsburgh PET Center. Data were acquired in fully 3D mode for 2 h but divided by gating into separate sinograms (14, 15). Twelve gates were chosen as this was the maximum supported by the scanner since a separate delayed coincidence sinogram was also acquired for each prompt coincidence sinogram. Thus, there were 24 statistically independent prompt and delayed fully 3D coincidence sinograms. To avoid emission contamination of the transmission scan from residual 18F-FDG, the 20-min 2D transmission scan was performed the following morning.
Three random coincidence correction methods were compared. The first method was the simple subtraction of the delayed sinogram from the prompt sinogram, corresponding to an online subtraction of delayed coincidences from the accumulated prompt coincidence sinogram. The second method consisted of reducing the variance of the delayed coincidence sinogram using the fully 3D Casey–Hoffman method (8, 10). The third method estimated the random coincidences using the single-photon event rates measured per bucket (a group of adjacent detectors). These rates were combined with the individual detector efficiencies for true coincidences (corrected for dead time) and the appropriate efficiency normalization factors as described.
Each prompt coincidence sinogram was corrected for random coincidences using the 3 methods described. Before reconstruction, corrections were also applied for detector efficiency variations, scattered coincidences, and attenuation. The corrected fully 3D sinograms were reconstructed with FORE+(AW)OSEM (18) (4 iterations/16 subsets, 6-mm 3D gaussian postreconstruction filtering).
A CT scan of the phantom was also collected to aid in the definition of the volumes of interest (VOIs) for the reconstructed phantom image. The CT image was manually aligned to both the PET emission image and the transmission image. The accuracy of alignment was estimated to be approximately 1 mm in all directions.
Data Analysis.
We calculated the mean of the background as the average over 12 VOIs positioned in the same transverse plane as the spheres. The radius of each VOI ranged from 5 to 15 mm to average the size dependence of noise correlation effects between pixels introduced by data corrections and image reconstruction. We then calculated the signal-to-noise ratio (SNRI) in the image background.
We calculated the mean of each sphere using a thresholded CT image of the phantom to generate the VOIs. For each sphere, we then calculated the RC, SNRI, and image CNR.
Finally, we estimated the factor α(si, sj) in Equation 3 based on the value that minimized the mean-square error between the singles-based estimate and the measured randoms coincidences over the entire fully 3D dataset. The scanner coincidence time window in Equation 3 was 2τ = 12 ns. To determine the effect of patient size, this measurement was repeated for both the elliptic torso phantom (inner major axis, 30.5 cm; inner minor axis, 22.1 cm) and a standard cylindric phantom (inner diameter, 21.6 cm). The inner height of both cylinders was 18.6 cm. To determine the effect of dead time, the estimates of α(si, sj) were repeated at activity concentrations of 0.9, 4.1, 9.2, 14.5, and 19.3 kBq/cm3, corresponding to total activities in the phantom of 5.2, 2.4, 54, 85, and 114 MBq.
Patient Studies
We used the counting rates of patients acquired on Siemens/CTI ART and HR+ scanners at the University of Pittsburgh PET Center to predict the improvement in NEC from using a random coincidence estimation with reduced variance that would be obtained in clinical practice. The percent improvement was defined as:
 Eq. 4 where the subscript “Noiseless” means k ≪ 1 in Equation 1 and “Online” means k = 1.
The first set of patients studied on the ART scanner contained 61 patients (27 males, 34 females). The average body mass index (BMI) was 27.2 ± 5.0 kg/m2. Following our institutional protocol, acquisitions were performed in fully 3D mode, 1 h after injection of 381 ± 59 MBq of 18F-FDG. The second set of patients studied on HR+ scanner contained 23 patients (13 males, 10 females; BMI = 26.0 ± 3.9 kg/m2). Following our institutional protocol, acquisitions were performed in fully 3D mode, 1 h after injection of 337 ± 78 MBq of 18F-FDG. In both cases, a transmission scan was also acquired for attenuation correction, from which the patient-specific values of fFOV in Equations 1 and A7 were estimated. For all studies, the total number of true, scattered, and random coincidences were extracted from the sinogram file headers for all bed positions to calculate Equation 4. The number of scatter events were calculated using the model-based scatter correction algorithm implemented on the scanners (21).
RESULTS
Simulation Studies
The count levels for true, scattered, and random coincidences were set by specifying the count levels for the abdomen (centered over liver) as specified by Table 2. The resulting total number of simulated prompt coincidences are plotted in Figure 3B as a function of the activity level for the 4 different bed positions of the phantom containing spheric targets. For the 23 patient studies acquired on the HR+ scanner, the prompt coincidences for the thorax centered axially in the scanner’s FOV totaled (159 ± 39) × 106 counts, which is in good agreement with the upper and lower lung numbers prompt coincidences presented in Figure 3B.
Figure 4 presents the image SNR (SNRI) measured from the whole-body phantom study calculated for the VOIs within each image. The comparison of SNRI demonstrates a significant advantage for FORE+(AW)OSEM compared with FORE+FBP due the reduction in noise propagation for fully 3D PET (14, 18, 19). These results are similar for all figures of merit of the 5 different whole-body test planes, except for the RC, which demonstrates a slightly higher RC for FORE+FBP compared with FORE+(AW)OSEM, particularly at low activity levels. The amount of improvement, however, is relatively modest.

SNRI measured from simulation study as a function of activity concentration.
For all figures of merit, there was an improvement by using the noiseless estimate of random coincidences (k = 0) compared with the noisy estimate (k = 1). The relative improvements in image SNR (SNRI) averaged over all bed positions as a function of activity level are shown in Figure 5. We can observe that the relative improvement in sinogram SNR (SNRS), based on  is a good prediction of relative changes in image SNRI (and CNR) for both FORE+FBP and FORE+(AW)OSEM. We note that, although the amount of improvement appears marginally higher for FORE+FBP than FORE+(AW)OSEM, the absolute SNR is higher for FORE+(AW)OSEM.
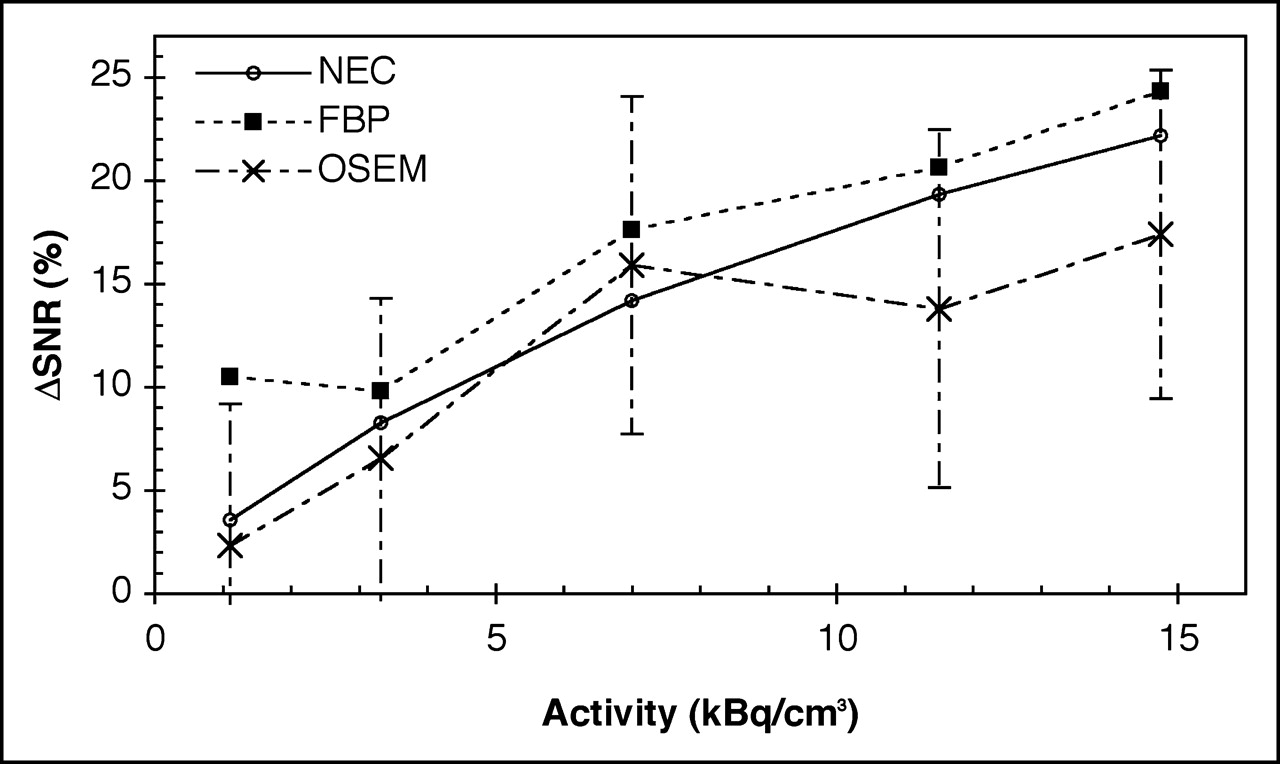
Improvement in SNR using a noiseless correction relative to an online correction. Improvement in SNR is measured in sinogram using global NEC rate (Eq. 1) and locally in image, as measured by detection of small targets.
Anthropomorphic Torso Phantom Studies
Figures of merit for quantitation and detection (SNRI, CNR) comparing the 3 methods averaged over all of the hot and cold target spheres are summarized in Table 3. In addition the background noise, values are analyzed with the SNRI figure of merit. The delayed coincidence method is used as a reference value, and the difference in the figures of merit between the delayed coincidence method and the smoothed delays or singles-based methods are given. These results indicate that the mean value obtained by all 3 correction methods are similar to within 2%, while the improvement in SNR by the smoothed delays or singles-based methods are very similar and range from 4% to 24%.
Comparison of Smoothed Delayed Coincidences and Singles-Based Random Coincidence Estimations Averaged over All Sphere Diameters
For the singles-based estimate, the correction factor (Eq. 3) was α = 1.13 for the elliptic phantom. This corresponded to a coincidence dead time of approximately 18% (7). For the 20-cm-diameter (nominal) cylindric phantom, with a corresponding dead time, the correction factor was α ≅ 0.8.
Patient Studies
We emphasize that the prompt and delayed coincidences are summed for all bed positions to determine the potential effect of a noiseless estimate of the random coincidences on the global NEC rate. The local NEC rate for each bed position will vary with bed position as described by Lartizien et al. (7).
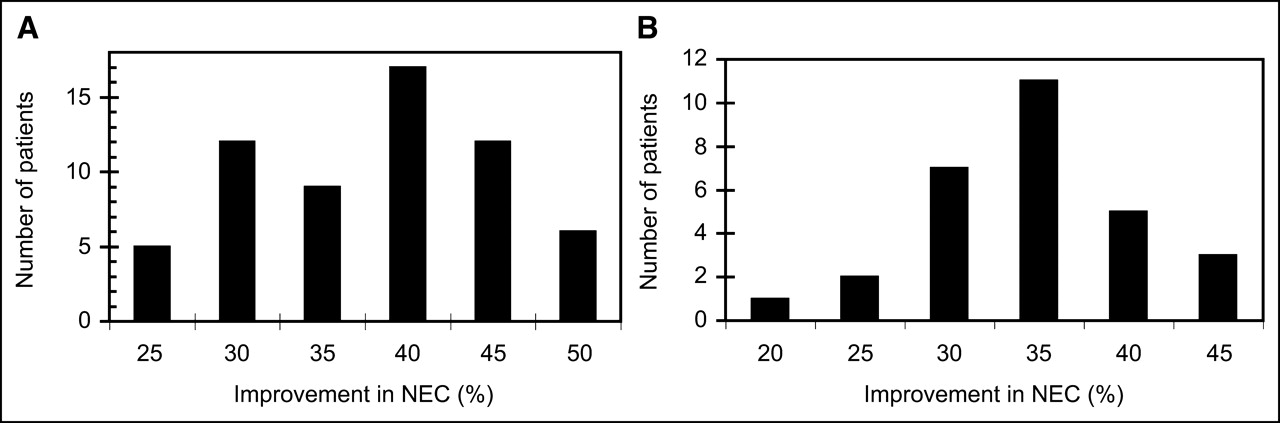
The measured random coincidence fractions expressed as R/(T + S + R) (averaged over all bed positions) for the ART and the HR+ scanners were 52% ± 7% and 49% ± 6%, respectively. Figure 6 represents the distribution of improved NEC rates (ΔNEC) obtained for the ART scanner (Fig. 6A, average improvement of 36% ± 7%) and the HR+ scanner (Fig. 6B, average improvement of 32% ± 6%). These values represent the improvement in image NEC values expected in clinical practice by using noiseless estimates of random coincidences. Using the relation SNR =  (calculated per patient) the corresponding average improvements in SNR are 16% ± 3% and 15% ± 2% for the 2 scanners.

Expected percent improvement in NEC by using singles-based estimation of random coincidences. (A) ECAT ART scanner: 61 patient studies. (B) ECAT HR+ scanner: 23 patient studies.
DISCUSSION
In this work, we investigate the effect of random correction methods on sinogram and image SNRs by using multiple independent studies. We first show that an improvement in sinogram NEC using a noiseless random correction (k = 0 in Eq. 1) compared with the online subtraction of delayed coincidences (k = 1) translates into a proportional improvement in image SNR. Figure 5 shows a good agreement between the sinogram space and the image space for the improvement in SNR averaged over all bed positions. This holds true for images reconstructed with either FORE+FBP or FORE+(AW)OSEM. This is to be expected for FORE+FBP as it is a linear algorithm closely related to the original derivation by Strother et al. for 2D imaging (4). FORE+(AW)OSEM, however, is a nonlinear algorithm and the close similarity between the relative improvements in sinogram space and the image space SNRs was not necessarily expected. We note, however, that these simulations do not model counting rate–dependent effects that may occur in practice. Such effects may degrade image quality at higher counting rates relative to that predicted by NEC rates (22).
For a bed position over the lower lungs of a volumetric whole-body phantom, Figures 4 and 5 show that noiseless estimates of random coincidences with k = 0 resulted in improved results relative to noisy estimates with k = 1 for all figures of merit used as expected. Similar results were obtained for the other bed positions. The results obtained will vary with changes of lesion size or contrast as well as imaging protocol. The choice of a 20-mm lesion with a 2:1 contrast was chosen as a representative target, and proper characterization of detection or quantitation tasks would require a larger study with variations in lesion size, contrast, and imaging protocols.
Using repeats of measured data (to estimate the true image noise from multiple realizations), we then compared 2 methods of reducing the variance of the estimated random coincidences. The results calculated for the mean background value, background noise, and hot and cold sphere SNRs, presented in Table 3, show that there is no significant difference in image SNRs using either method of variance reduction.
For the singles-based estimation method, there are potential sources of error that could lead to different results than those obtained using the smoothed delayed coincidences. For the scanner used in this study, these differences arise from several sources: the use of the average single-photon rates for a large group of detectors, possible differences in detector efficiencies, differences in dead time, and so forth. These factors are affected by the activity levels and distribution—that is, patient size. Phantom studies showed a correction factor variation ranging from 0.80 to 1.13 as the phantom size varied approximately from head to abdomen size. The effect of activity level was less significant for the phantom studied, where the correction factor ranged from 0.87 with a 3% dead time to 0.76 for a 29% dead time.
An advantage for the singles-based estimation method is the reduction by a factor of 2 in the size of datasets that must be transferred and processed relative to the smoothed delayed method. The maximum size of fully 3D sinograms has doubled approximately every 10 mo for the last 2 decades (23).
There were no apparent visual differences between reconstructed images using the 3 different methods of estimating for random coincidences. This lack of apparent visual difference has been noted by several investigators, including Badawi et al. (10), who nonetheless measured improvements in image SNR of ∼5% to ∼15% based on the pixel values in a single realization for images reconstructed with the approximately linear 3DRP algorithm (24). In the current study, we measured the true image noise across multiple realizations (50 for simulations, 12 for measurements) to determine the average change in NEC and SNR for whole-body imaging. An additional difference with Badawi et al. (10) is that we included the effect of activity outside the scanner axial FOV. A third significant difference is that we measured the effect on images reconstructed with the linear FORE+FBP and nonlinear FORE+(AW)OSEM reconstruction algorithms (18). Even with these differences, we measured an approximately 15% improvement in sinogram and image SNR for whole-body 3D PET 18F-FDG studies.
Although a 15% improvement in image SNR does not translate into significant perceptual changes in images, the impact of the reduced variance of randoms estimation can be illustrated by regarding the effect on scan time. A 15% improvement in image SNR arises from a 32% increase in the NEC rate. Thus, to maintain a constant total acquired NEC, the scan duration can be reduced by 25%.
Some newer PET and PET/CT scanners use faster scintillators such as lutetium oxyorthosilicate (LSO) or germanium oxyorthosilicate (GSO) with a faster light decay time than bismuth germanate (BGO). Excellent timing resolution is thus possible with these scintillators, which allows improved coincidence timing. This leads to a reduced random event rate by reducing the coincidence time window (Eq. 2). This improvement, however, is independent of the methods discussed here. In other words, image noise can be further suppressed by using the methods described here for estimation of random events on an LSO- or GSO-based scanner, with the resulting gain in SNR described by Equation A7.
CONCLUSION
The gain in NECs by using a reduced variance random estimation method is translated to improvements in image SNR for both FORE+FBP and FORE+AWOSEM. The figures of merit analyzed indicated that a singles-based randoms estimation performed only marginally worse than smoothing a separately acquired delayed coincidence sinogram, with the advantage of freeing the bandwidth of the coincidence processor for prompt events only. With these random coincidence correction methods, and for the scanners and clinical protocols used here, there was an increase in NEC of 32% for clinical applications, allowing a 25% reduction in patient scan time if constant noise levels are maintained. The improvement obtained in any specific situation, however, will depend on the type of scanner and the imaging protocol.
APPENDIX
Figures of Merit Used for Data Analysis of Simulation Studies
We define xi,r as the reconstructed value of the r-th independent noisy realization of voxel i. Then, 〈x〉r,v is the mean of the r-th realization of volume of interest (VOI) v, where N = 86 is the total number of voxels in each VOI and R = 50 is the number of realizations, which are statistically independent. The VOI mean across all realizations is 〈x〉v, and we define the noise as the sample standard deviation of the VOI mean value across multiple realizations:
 Eq. A1
We do not use the voxel root-mean-square (RMS) standard deviation within the VOI as a measure of noise but mention it here as it is often used, incorrectly, as a measure of image noise. Due to noise correlations present in PET images, the RMS standard deviation is not related directly to the true noise. At best, the voxel RMS standard deviation within a region might be considered a measure of apparent image smoothness.
On the basis of these definitions, we define 5 figures of merit for sinogram and image quality:
The signal-to-noise ratio (SNR) in sinogram space is measured for each bed position of each activity concentration as the square root of the NEC rate defined in Equation 1:
 Eq. A2
The recovery coefficient (RC) for an image plane containing targets is defined as the ratio between the VOI mean value and the true value c, averaged over the L = 8 VOIs centered at the same axial plane. The RC is a measure of the bias in an image, typically with RC < 1 due to resolution effects, which are also known as partial-volume errors:
Eq. A3The SNR in image space is defined as the average of the SNR for the targets of a specific plane and, for each target, the SNR is the ratio of the average VOI value to the standard deviation of the VOI values across realizations:
Eq. A4The root-mean-square error (RMSE) combines the effects of bias and noise and is a measure of the quantitative accuracy. It is defined for each plane as:
Eq. A5The contrast-to-noise ratio (CNR) is calculated as:
Eq. A6 where b is the average background value in a plane without targets. The CNR figure of merit is closely related to the non–prewhitening matched filter, which in turn has been shown to be linearly correlated with human detection performance for simple objects in whole-body PET images such as those considered here (25).


The figures of merit were averaged over all VOIs centered in an axial plane, as indicated in Figure 3.
From Equations 4 and A2, we can also derive as a general result the predicted improvement in SNRS(k) for the sinogram data as a function of k and the ratio of the sum of true and scattered to random coincidences:
 Eq. A7 which reduces to ΔSNR = 0 if k = 1, as expected.
Acknowledgments
This work is supported by National Cancer Institute grant CA-74135. The authors gratefully acknowledge Drs. Ramsey Badawi, Charles Watson, Charles Stearns, and Alexander Ganin for helpful discussions.
Footnotes
Received Apr. 22, 2004; revision accepted Dec. 28, 2004.
For correspondence or reprints contact: Paul E. Kinahan, PhD, University of Washington Medical Center, Box 356004, 1959 N.E. Pacific St., Seattle, WA 98195-6004.
E-mail: kinahan{at}u.washington.edu


