


Abstract
PET/CT imaging after radioembolization is a viable method for determining the posttreatment 90Y distribution in the liver. Low true-to-random coincidence ratios in 90Y PET studies limit the quantitative accuracy of these studies when reconstruction algorithms optimized for traditional PET imaging are used. This study examined these quantitative limitations and assessed the feasibility of generating radiation dosimetry maps in liver regions with high and low 90Y concentrations. Methods: 90Y PET images were collected on a PET/CT scanner and iteratively reconstructed with the vendor-supplied reconstruction algorithm. PET studies on a Jaszczak cylindric phantom were performed to determine quantitative accuracy and minimum detectable concentration (MDC). 90Y and 18F point-source studies were used to investigate the possible increase in detected random coincidence events due to bremsstrahlung photons. Retrospective quantitative analyses were performed on 90Y PET/CT images obtained after 65 right or left hepatic artery radioembolizations in 59 patients. Quantitative image errors were determined by comparing the measured image activity with the assayed 90Y activity. PET images were converted to dose maps through convolution with voxel S values generated using MCNPX, a Monte Carlo N-particle transport code system for multiparticle and high-energy applications. Tumor and parenchyma doses and potential bias based on measurements found below the MDC were recorded. Results: Random coincidences were found to increase in 90Y acquisitions, compared with 18F acquisitions, at similar positron emission rates because of bremsstrahlung photons. Positive bias was observed in all images. Quantitative accuracy was achieved for phantom inserts above the MDC of 1 MBq/mL. The mean dose to viable tumors was 183.6 ± 156.5 Gy, with an average potential bias of 3.3 ± 6.4 Gy. The mean dose to the parenchyma was 97.1 ± 22.1 Gy, with an average potential bias of 8.9 ± 4.9 Gy. Conclusion: The low signal-to-noise ratio caused by low positron emission rates and high bremsstrahlung photon production resulted in a positive bias on 90Y PET images reconstructed with conventional iterative algorithms. However, quantitative accuracy was good at high activity concentrations, such as those found in tumor volumes, allowing for adequate tumor 90Y PET/CT dosimetry after radioembolization.
Radioembolization with 90Y microspheres is an established therapy for hepatocellular carcinoma or metastases to the liver. The goal of radioembolization is to deliver a highly localized absorbed radiation dose to the tumor while keeping the dose below acceptable tolerance levels in normal surrounding tissue. That goal is achieved with 90Y-laden microspheres administered via intraarterial injection into branches of the hepatic artery. Preferential tumor targeting is achieved through lesion hypervascularity and the differential blood supply for tumors relative to liver parenchyma (hepatic artery vs. portal vein) (1,2). 90Y is primarily a β− emitter with a maximum range in soft tissue of 11 mm, producing a highly localized radiation exposure (3).
Verification of 90Y-microsphere distribution, and hence radiation dose, to tumors and the surrounding liver after radioembolization has been limited in the clinic because of the complexity of obtaining in vivo quantitative images from high-energy β− emitters. Consequently, most clinical estimates of radiation dose have been based on calculations that assume a uniform distribution of 90Y throughout the treated volume (2,4). This simplistic, empiric approach underestimates the radiation dose to tumors and overestimates the dose to the surrounding normal tissue when there is preferential delivery to the tumors (5).
PET/CT imaging has been introduced as a feasible method to provide 90Y distribution maps by leveraging β+:β− pair production, which occurs in approximately 32 of every 1 million decays (6–11). Many studies have demonstrated the feasibility of using these PET images for patient-specific dosimetry (12,13).
90Y is not an ideal radionuclide for PET imaging because of the low pair-production branching ratio. Additionally, the 90Y maximum β− energy of 2.28 MeV leads to the production of bremsstrahlung photons that meet PET detector energy acceptance requirements (14), leading to increased single-event rates. The low positron-derived signal coupled with increased single events produces an image acquisition scenario with high random-to-true coincidence ratios. Random coincidence events are commonly corrected by subtracting random events measured in a delayed time window from the prompts signal. This technique, referred to as delayed random coincidence correction (DRCC), enables both real-time and offline random corrections to be performed.
In the setting of high random-to-true coincidence ratios, DRCC can produce negative sinogram ray-sum values from the stochastic nature of radionuclide decay. These negative values are often truncated in commercial software packages before iterative reconstruction to provide concavity, leading to a known positive bias (15–17). In this study, we evaluated the magnitude of this bias in the unusual setting of very high random-to-true coincidence ratios observed in 90Y PET. This study also assesses the feasibility of using 90Y PET/CT images with observed image reconstruction bias for estimation of 90Y dosimetry in tumor and treated-lobe parenchymal volumes after radioembolization.
MATERIALS AND METHODS
Image Acquisition and Reconstruction
90Y PET/CT patient studies that had been acquired approximately 1 h after TheraSphere injection into the right or left hepatic artery at Indiana University Health University Hospital in Indianapolis, IN, between February 2011 and January 2013 were analyzed retrospectively. The Indiana University institutional review board approved this retrospective study, and the requirement to obtain informed consent was waived.
Data were acquired for 10 min per bed position on a Biograph 64 TrueD PET/CT scanner (Siemens Healthcare), with a 4.5-ns coincidence time window and a 435- to 650-keV energy window. The scanner consists of lutetium oxyorthosilicate (LSO) detector elements. Patient images were acquired using Siemens’ net acquisition mode, which corrects for randoms in real time. Images were reconstructed using Siemens’ iterative reconstruction algorithm with point-spread-function spatial recovery (TrueX), which truncates negative ray-sum values in the sinogram before image reconstruction (18). Images were reconstructed with 2 iterations and 14 subsets and had vendor-supplied DRCC, scatter, and attenuation correction applied. PET DICOM image arrays were postprocessed in IDL (Interactive Data Language; Research Systems Inc.) to apply the 90Y positron branching ratio and proper decay correction.
To validate patient imaging results, images of a Jaszczak cylindric phantom containing 5 syringes with an inner diameter of 38 mm filled with 80 mL of known concentrations of 90Y-Cl3 solution were collected once a day for 5 d using the patient protocol. The starting total activity was 1.01 ± 0.1 GBq, calculated by subtracting residual activity measured by an Atomlab 100 (Biodex) dose calibrator from the supplier’s calibration record and corrected for decay to the time of imaging. In addition to the net acquisition mode, phantom data were collected using a prompt/random acquisition mode. The prompt/random acquisition mode saves both prompt and delayed sinograms, enabling averaging or smoothing of the delayed sinogram bin values before DRCC. Given that the delayed sinogram provides an estimate of random coincidence rates, smoothing the sinogram reduces variance introduced during the DRCC (19,20). In addition to TrueX reconstruction, phantom data were reconstructed using direct inverse Fourier transform (diFT) with and without sinogram truncation to evaluate the effect of sinogram truncation.
Image Bias
Image bias was determined by comparing the administered quantity of 90Y with the measured quantity of radionuclide across the image field of view (FOV). For the patient studies, the administered 90Y quantity was defined as injected activity minus the estimated lung shunt fraction for image volumes that excluded most of the lungs. Manufacturer calibration records were used to determine the injected 90Y activity for each patient, corrected for decay and residual activity. A 10% uncertainty was assumed for the assay of 90Y quantities. The lung shunt fraction was determined by a pretreatment SPECT scan of 99mTc-macroaggregated albumin injected during the patient’s planning arteriogram obtained approximately 2 wk before radioembolization. PET images with 2 bed positions contained a majority of the lung in the FOV, and therefore no subtraction was made to remove the lung activity in defining the administered FOV quantity. The administered whole-liver quantity was corrected for the lung shunt fraction in all studies.
For the phantom studies, the total radionuclide quantity measured across the entire PET FOV was compared with the total syringe activity. With IDL software, net acquisition uncorrected sinogram values were binned to create a histogram to demonstrate the distribution of positive and negative values observed after real-time DRCC.
In acquisitions with a low signal, the natural radioactivity of 176Lu in the LSO crystals may produce a significant portion of the random coincident events. To evaluate the proportion of the bias caused by the LSO, a cold phantom acquisition was collected 13 d after manufacturing to allow for decay.
Prompt, random, and true events were recorded from multiple acquisitions of 90Y and 18F point sources to evaluate the impact of bremsstrahlung photons on random-coincidence counting rates. Three acquisitions of 90Y activities—3.8, 1.7, and 0.2 GBq—contained in original TheraSphere vials were collected. Additionally, 4 acquisitions were collected every half hour with a vial filled with 18F. The 18F activity for the first acquisition was 0.13 MBq, decay-corrected from an initial activity of 8.5 MBq as determined by the dose calibrator. An additional acquisition was collected with no activity present to determine the background counting rate.
Quantitative Accuracy and Minimum Detectable Levels
Quantitative accuracy was determined by comparing the observed syringe radionuclide quantity in the phantom images with the true activity. Measured radionuclide quantities were calculated using a region-growing tool on CT images to create volumes of interest (VOIs). Each VOI was expanded by 1 pixel length (4 mm) around its surface using MIMVista software to ensure that all activity in each syringe was measured.
Minimum detectable concentration (MDC) was determined using the Rose criterion, which bases detection limits on a minimum contrast-to-noise ratio (CNR) (21), as found in the following equation: , Eq. 1where CL, CB, and σB are lesion concentration, background concentration, and background noise, respectively. A contrast-to-noise ratio of 8 has been suggested for 90Y PET images because of high noise (11). The MDC is then defined as:
 . Eq. 2Each phantom background SD was determined following the method described by Stute et al. (22) using the mean SD from 10 regions of interest consisting of 45 voxels placed at random at least 2 pixel lengths apart and 3 pixel lengths from the border and syringe VOIs (11).
Absorbed Dose Maps
PET radionuclide concentration images were converted to dose maps in accordance with MIRD 17 (23). Voxel S values were constructed for the PET voxel size (4.07 × 4.07 × 3 mm) using MCNPX, a Monte Carlo N-particle transport code system for multiparticle and high-energy applications (24), using 108 starting β− particles and a cutoff energy of 1 keV. Dose maps were generated by convolving the voxel S values with PET DICOM cumulative activity arrays in IDL.
Phantom syringe VOI dose measurements were used to validate dose map results through comparison with expected dose values using the clinical dosimetry equation: Eq. 3where A is activity in gigabecquerels, M is mass in kilograms assuming liver tissue density, and D is dose in grays (25).
Patient Dosimetry
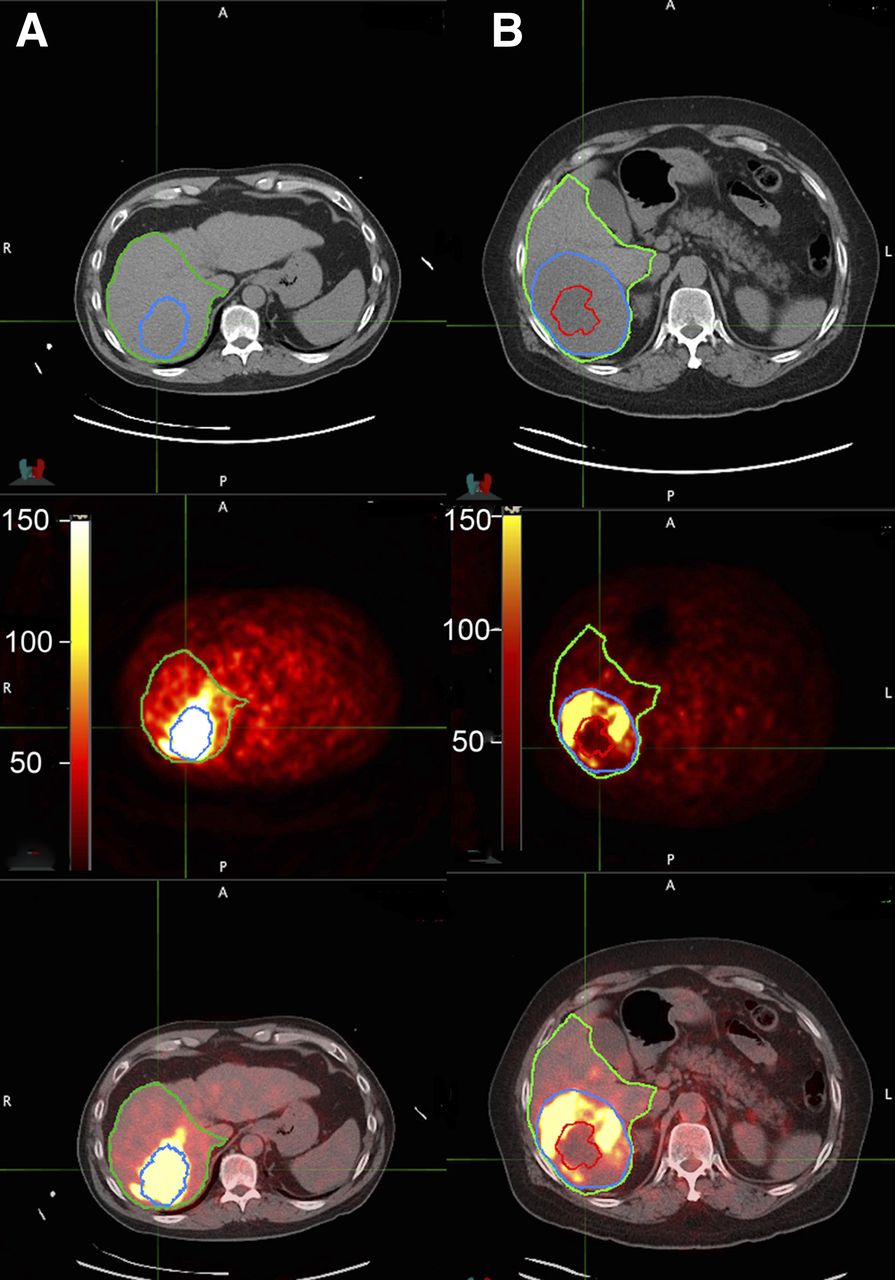
Image radionuclide quantities and tissue volumes were estimated from radiologist-defined contours created on associated CT images for all patient studies (Fig. 1). Only tumors larger than 1 cm were included in the study. Studies with indiscernible tumor boundaries were excluded. Tumors with large necrotic centers were contoured to differentiate between viable and nonviable tumor volumes. Healthy-parenchyma contours were constructed by removing tumor volumes from the treated lobe contours. Mean tumor doses were estimated by placing the contours on the PET dose maps.

Patient PET/CT images reconstructed using TrueX following net acquisition after 3.6 GBq (A) and 3.2 GBq (B) unilobar 90Y radioembolization demonstrating radionuclide quantity observed throughout FOV. Preferential lesion (blue) uptake within treated lobe (green) was observed. Minimal uptake was observed in necrotic (red) regions.
Measured quantities are expected to be overestimated in voxels with a concentration below the MDC. The maximum potential activity from bias can be quantified by assuming that all activity in voxels below the MDC is from bias. The MIMVista upper-threshold tool set to the MDC was used to determine this maximum bias activity for each VOI. Maximum bias activity can be converted to maximum dose bias by separating the activity from measurements above and below the MDC in the clinical dosimetry equation, . Eq. 4In this equation, A+ represents the activity measured above the MDC, A− is activity measured below the MDC, and M is the whole volume mass. The second term, with the activity measured below the MDC, represents the potential dose bias.
Statistical Analysis
Data are expressed as mean ± SD. Phantom VOIs with a concentration above and below the MDC quantitative accuracy measurements were compared with the nonparametric Wilcoxon rank sum test since the continuous measurements were not normally distributed.
RESULTS
Image Reconstruction Bias in Patient Studies
Sixty-five PET/CT acquisitions after right (n = 48) and left (n = 17) hepatic artery radioembolization from 59 patients were included in the analysis, with 16 and 49 having 1 and 2 bed positions, respectively. The mean injected activity was 2.6 GBq, with a range of 0.7–5.7 GBq. The mean lung shunt fraction was 5.3% ± 2.6% and 7.6% ± 4.0% for 1 and 2 bed positions, respectively. Diffuse background activity was observed in all patient PET images (Fig. 1). In the total-image FOV, the measured radionuclide quantities exceeded the administered radionuclide quantity by an average of 8.4 and 13.5 GBq for 1 and 2 bed positions, respectively, when TrueX was used after net acquisition (Fig. 2). The mean measured quantity in whole-liver VOIs was 0.6 ± 0.6 GBq greater than expected.

Calculated activity observed throughout FOV exceeded true radionuclide quantity in all patient PET/CT images reconstructed using TrueX after net acquisition. Larger positive bias was found on average in 2-bed-position acquisitions, which had larger FOV volumes.
Phantom Image Reconstruction Bias
Bremsstrahlung photons increased the 90Y random coincidence event rates compared with 18F for equivalent positron emission rates, whereas true-plus-scatter counting rates were found to be similar (Fig. 3). At 3.8 GBq, 90Y provided a 3.06-fold increase in random events compared with background coincidence rates observed with no activity present. However, interpolation of the 18F random-event-rate results showed that 18F at the same emission rate of 121,500 positrons per second (0.13 MBq of 18F) produced random events at only 1.03 times background.

18F and 90Y counting rates demonstrate increased random events in 90Y acquisitions compared with 18F at same positron emission rate whereas true and scatter events stay approximately the same. 90Y random events were seen to increase from background acquisition, where no activity was present besides natural 176Lu found in LSO crystals. 18F random events were not seen to have a significant increase beyond background LSO counts because of the low activity needed to match 90Y positron emission rate.
A histogram of detected ray-sum values, after net acquisition from the highest-activity phantom, demonstrated that 46.8% of nonzero values were negative (Fig. 4). Phantom net acquisition images with real-time DRCC subtraction had radionuclide quantities measured across the FOV that exceeded the total radionuclide quantity placed in the syringes, with percentage errors in the range of 273%–747% observed during the first 5 d of imaging (Table 1; Fig. 5A). The range dropped to −0.6%–26% when the delayed window was smoothed with the prompt/random acquisition, with the 3 highest-activity images having less than 10% error (Fig. 5B).
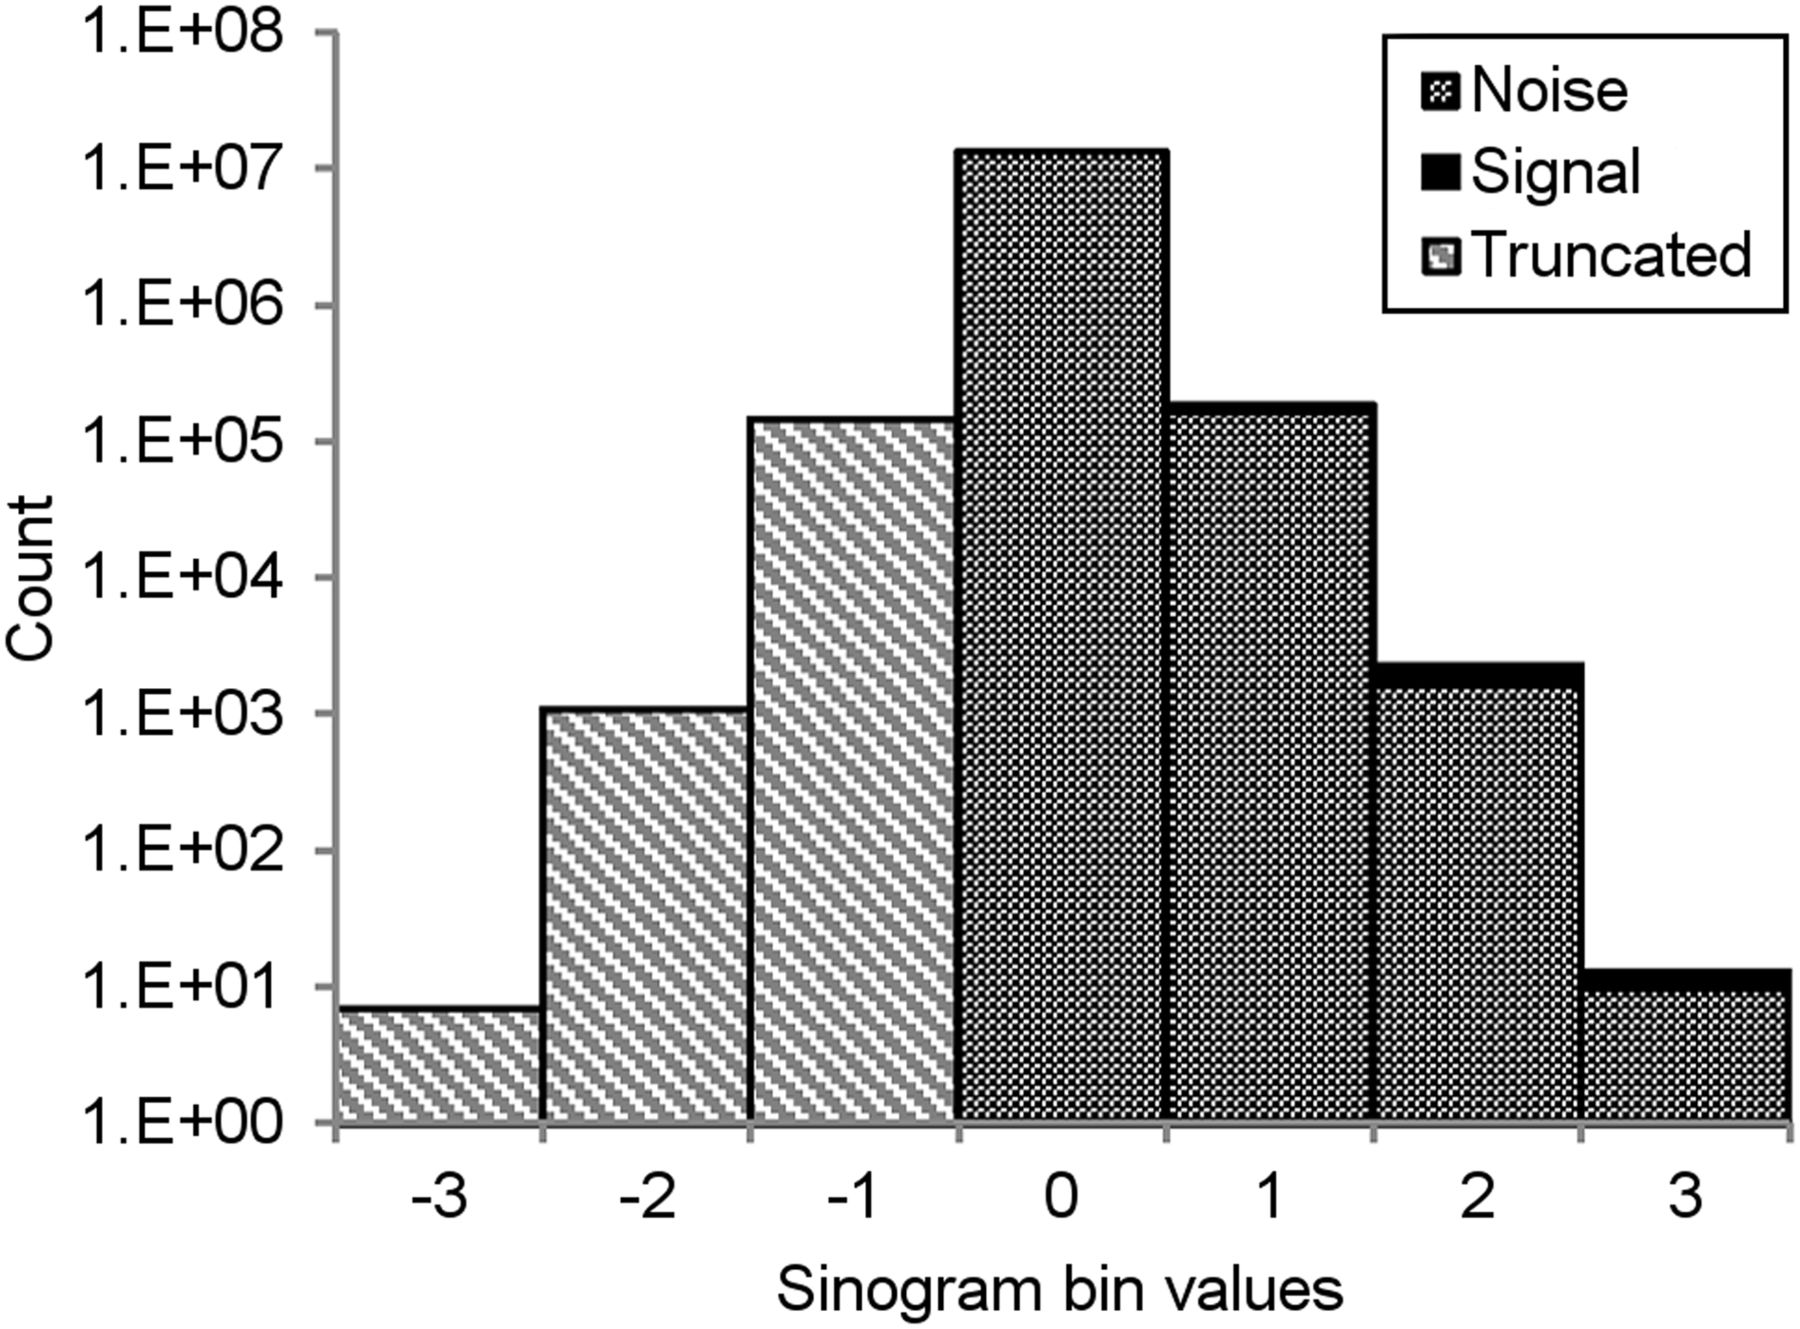
Histogram of phantom-acquisition sinogram ray-bin values after online DRCC subtraction demonstrates that significant negative bins are created in 90Y PET images. Truncation of these negative values before reconstruction leaves only positive noise.
Total Phantom FOV Calculated Activity After Different Reconstruction and Acquisition Approaches

Reconstructed images from net (A) and prompt/random (B) acquisitions of phantom. In each case, random coincidence corrections were applied. Images demonstrate that diffuse bias in background decreases after smoothing of random sinogram before DRCC in prompt/random acquisition mode.
Additionally, positive bias was not observed in any images after net acquisition using diFT reconstruction. Positive bias was observed after this reconstruction when the net acquisition sinogram was truncated before reconstruction.
Quantitative Accuracy
The 90Y MDC for the phantom study was found to be 1 MBq/mL. Quantity and dose measurements from the 16 syringes containing activity above the MDC matched expected values within 10% (Fig. 6; Table 2). VOI measurements in the 9 syringes with concentrations below the MDC were higher than expected. The positive bias observed in the syringe VOIs with concentrations below the MDC produced absolute errors that were greater than the absolute errors observed for VOI measurements in syringes with concentrations above the MDC (P < 0.0003).
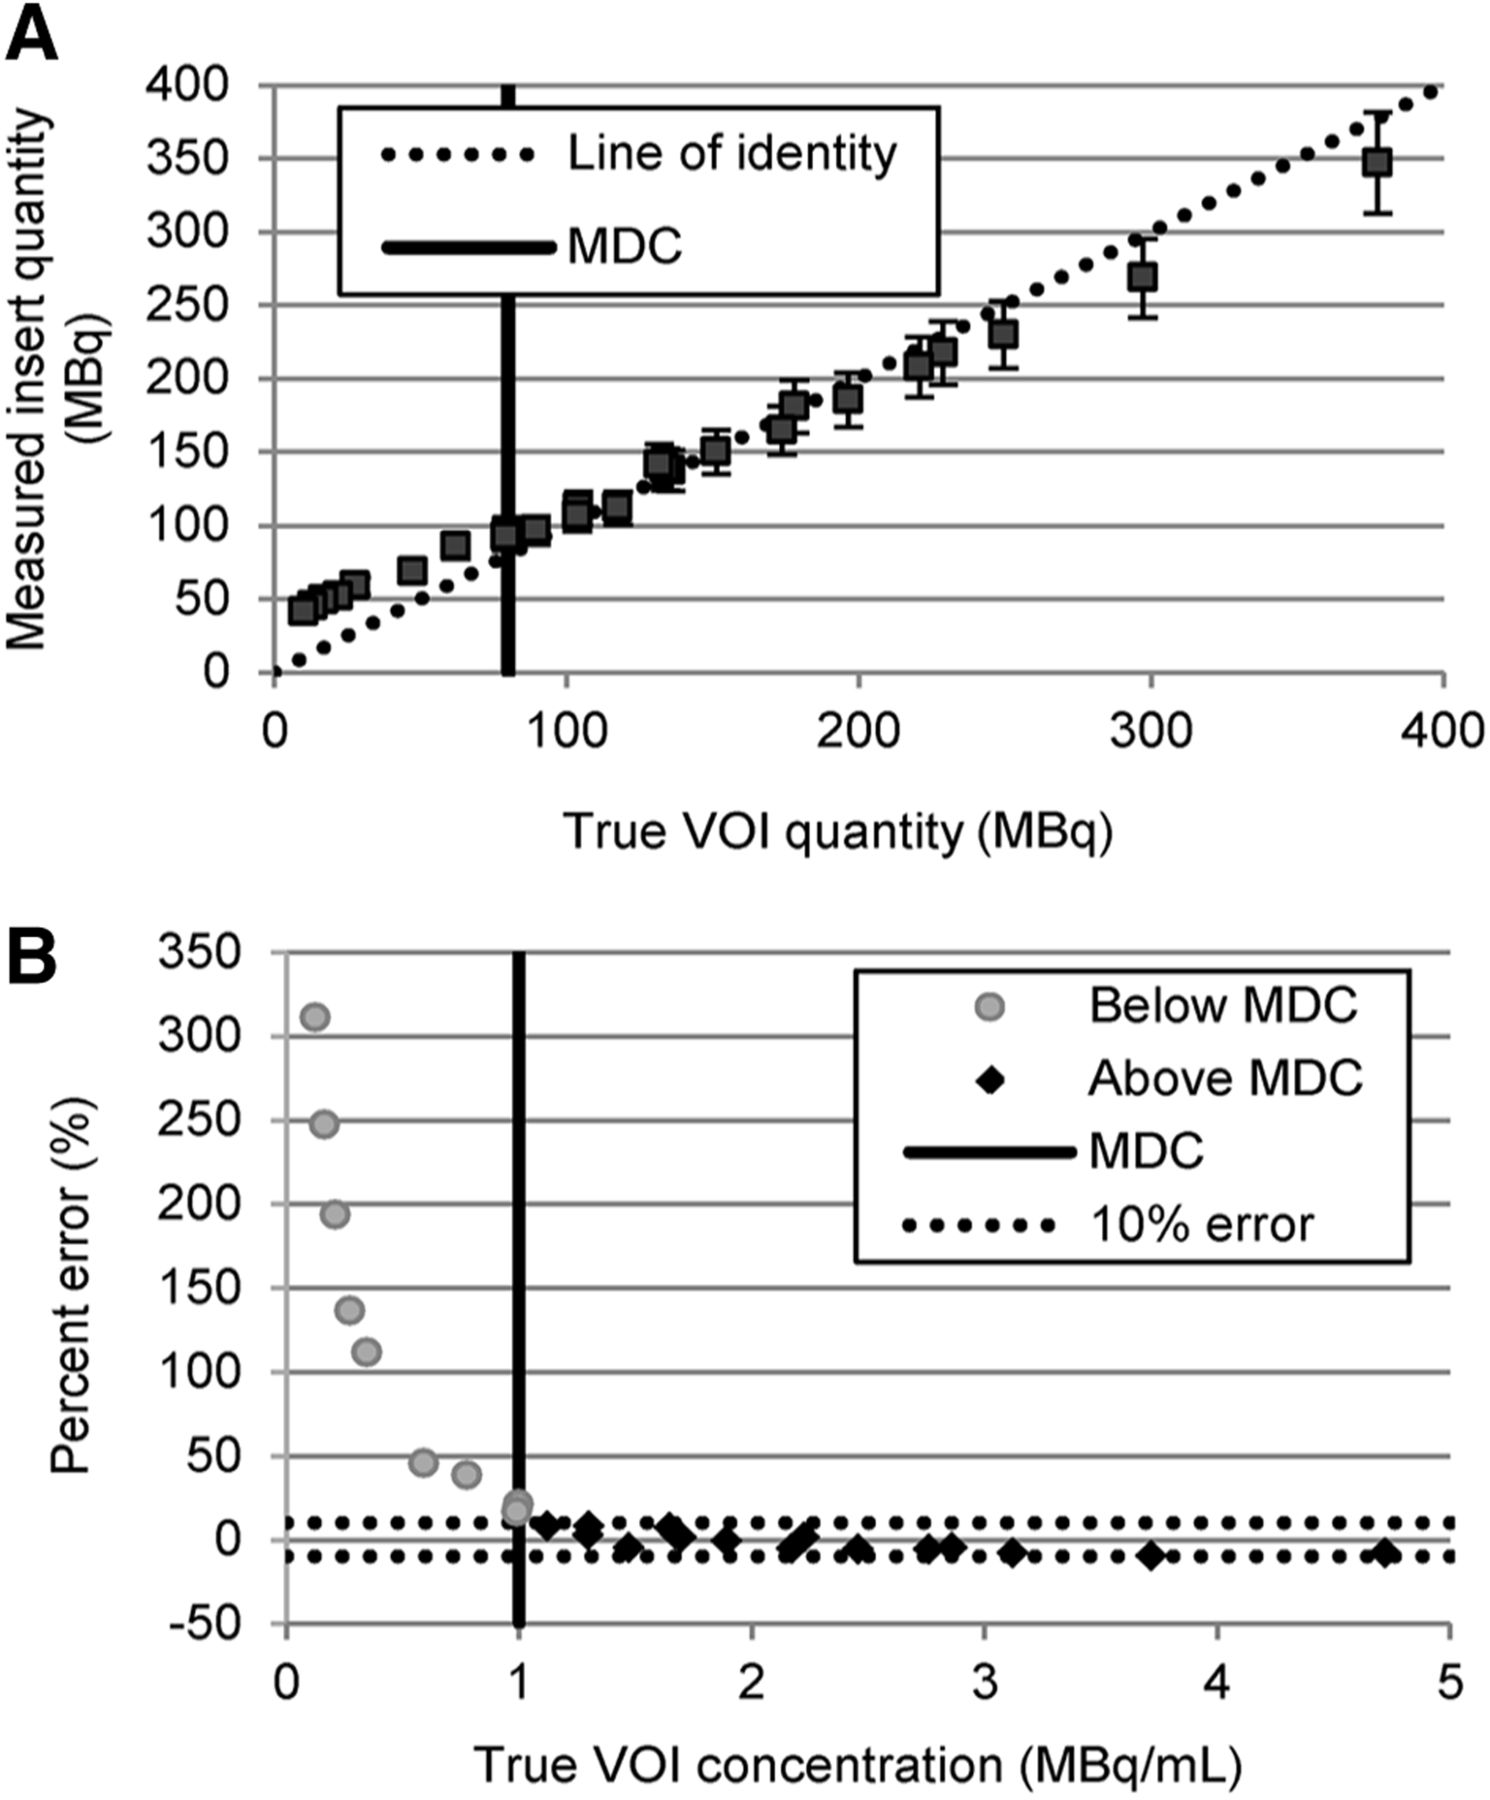
Phantom-insert VOI measurements from images reconstructed using TrueX after net acquisition were found to have accuracy within 10% at concentrations above MDC of 1 MBq/mL (A), with percentage error increasing to above 10% for VOI with concentrations below MDC (B).
Phantom Image Activity and Dose Estimated from TrueX Reconstruction of Data Collected Using Net Acquisition Mode
Patient Results
From the 65 studies, the treated-lobe concentration based on expected liver activity assuming a uniform distribution was greater than the MDC (range, 1.03–3.64 MBq/mL). However, visual observation confirmed that 90Y was heterogeneously distributed, resulting in an average treated-lobe volume with 90Y concentration below the MDC of 277.4 ± 204.1 mL, with a range of 25.9 to 1,353.7 mL. Because of increased uptake in the tumor, most of this volume was found in the parenchyma, with an average of 247.8 ± 149.0 mL, corresponding to an average of 27.3% ± 16.9% of the total parenchyma (Fig. 7A). The mean total quantity measured in the treated-parenchyma volume with 90Y concentrations below the MDC was 170.1 ± 99.4 MBq. This resulted in a mean potential bias of 8.9 ± 4.9 Gy, compared with the mean calculated dose of 97.1 ± 22.1 Gy (Fig. 7B).

Heterogeneous 90Y microsphere distribution led to 31.3% ± 25.7% (mean ± SD) of treated lobe volume having measured concentration below MDC. (A) Because of preferential delivery to tumor, volume below MDC was larger in parenchyma in 63 of 65 studies. (B and C) Quantity measured in these volumes led to greater than 10% potential dose bias in parenchyma for 42% (27/65) of studies (B) and 9% (10/115) of tumors (C). Dose maps showed poor preferential 90Y deposition, with calculated dose being less than 100 Gy in all 10 tumors that had greater than 10% potential dose bias.
The volume with 90Y concentration below the MDC in the 115 identified tumors was 16.7 ± 75.8 mL, corresponding to 12.2% ± 23.1% of lesion volume, resulting in an average total measured quantity of 15.8 ± 55.3 MBq. This resulted in a mean potential bias of 3.3 ± 6.4 Gy, compared with the mean measured viable tumor dose of 183.6 ± 156.5 Gy (Fig. 7C).
DISCUSSION
A large positive bias in the total radionuclide quantity in patient 90Y PET/CT images was observed when negative sinogram values were truncated before iterative reconstruction. Based on the phantom study, the positive bias was found to be restricted to regions where 90Y concentrations fell below the MDC. The study demonstrated that the 90Y PET/CT–measured radionuclide concentration was quantitatively accurate, even in the presence of significant positive bias within the image volume, in areas found to contain 90Y concentrations above the MDC.
In the setting of very low coincidence-detection rates and high single-event rates (as observed in our 90Y PET studies), a large number of the sinogram elements are negative after online DRCC because of the stochastic nature of the random coincidence events detected in both the prompt and the delayed coincidence windows. Truncation of negative values leaves only the positive values of the background noise distribution in the sinogram. Reconstruction of sinograms in which negative values have been truncated artificially generates radionuclide concentrations in regions of the image that have low radionuclide concentrations while having minimal impact on the reconstructed value in regions of the image with high radionuclide concentrations. Our phantom studies with and without sinogram truncation when the direct inversion Fourier transformation reconstruction algorithm is used provide a nice demonstration of the impact of truncation in PET studies with a low coincidence rate and a high single-event rate. Our study also demonstrated that smoothing the delayed-window random coincidence rates before subtraction reduced the observed bias. This type of positive bias is well documented for PET images reconstructed using iterative algorithms with truncated sinograms in the setting of low signal-to-noise ratios (15–17).
Past studies have suggested that at a low signal, natural radioactive decay of 176Lu, found in LSO PET crystals, can cause most of the random events leading to the positive bias (11). However, the experimental findings from the 90Y point-source study showed an increase in random coincidences for the 90Y source as compared with background or an equivalent rate of positron emission from an 18F source. The increase is due to bremsstrahlung photons, produced by the 90Y 2.28-MeV maximum-energy β−particle, contributing a significant rise in random events. Truncation of negative sinogram values produced by the correction for these random events creates a mean excess of 8.4 GBq across the FOV for a 1-bed-position study. In comparison, the 1-bed-position study of the cold phantom produced an excess of 2.6 GBq. Therefore, the biased background signal observed in regions below the MDC is due to both bremsstrahlung and natural radioactivity in LSO crystals.
Even with the large positive bias observed when the radionuclide levels throughout the imaging FOV were quantified, the phantom study demonstrated quantitative accuracy for concentrations above the MDC, confirming previous literature findings that 90Y PET images are accurate at high concentrations (6,11). Through use of voxel MIRD methodology, these images also provided accurate dose results for each of these VOIs. As expected, bias was observed in VOIs with concentrations less than the MDC, resulting in an overestimation of both radionuclide concentration and radiation dose.
Overestimation of the quantity of 90Y in the liver volume was evident in all 65 patient studies, even when one considers a 10% uncertainty in the original 90Y assay. Positive bias is expected to have influenced the dose results for all patients in this study because of areas with a concentration below the MDC of 1 MBq. However, because of preferential uptake of 90Y microspheres in tumors, most tumors had a small volume with a concentration below the MDC. This favorably results in minimal positive bias within the tumor volume. Thus, the potential for error in 90Y concentration estimates from the bias in most tumors was relatively small. Ninety-one percent (105/115) of identified tumors had a potential bias of less than 10 Gy. The 10 tumors that had a potential bias greater than 10 Gy all had calculated doses of less than 100 Gy because of low 90Y deposition. In these 10 tumors, the calculated dose is still known to be less than 100 Gy because the bias was positive.
Unfortunately, the nonuniform distribution caused a large portion of the parenchymal volume to be below the MDC. The result was an average potential bias of 8.9 Gy, with 40% (26/65) of studies having a potential bias greater than 10 Gy because of the image reconstruction bias. This observation demonstrates that great care must be taken in trying to assess radiation dose to normal liver parenchyma based on 90Y PET images when reconstruction algorithms that truncate negative sinogram values are used.
CONCLUSION
Because of low positron signal compared with noise from LSO and bremsstrahlung photons, a large number of sinogram ray-sum values are negative after DRCC subtraction, leading to position bias when truncated in iterative reconstruction algorithms. Even in the presence of this positive bias, quantitative accuracy was good in areas where the concentration was above the MDC, enabling accurate estimation of 90Y PET/CT tumor dosimetry after radioembolization. A large positive bias was observed in regions with low 90Y concentrations, such as are found in large areas of the parenchyma in many studies, when sinogram truncation with iterative reconstruction is used. Therefore, care must be taken in the selection of a reconstruction algorithm for estimation of radionuclide concentration and dosimetry in low-uptake regions of the image such as the liver parenchyma.
DISCLOSURE
The costs of publication of this article were defrayed in part by the payment of page charges. Therefore, and solely to indicate this fact, this article is hereby marked “advertisement” in accordance with 18 USC section 1734. Dr. Johnson reported a grant and personal fees from Nordion (formerly part of MDC Nordion, recently purchased by BTG) outside the submitted work. The grant was related to research support for his site’s participation in 2 multicenter randomized trials. The personal fees were consulting fees for serving on the BTG medical advisory board and payment for serving as a preceptor answering radioembolization-related questions from other physicians. Dr. Hutchins reported a departmental research partnership with Siemens Medical Systems outside the submitted work. No other potential conflict of interest relevant to this article was reported.
Footnotes
Published online Jun. 30, 2014.
- © 2014 by the Society of Nuclear Medicine and Molecular Imaging, Inc.
REFERENCES
- Received for publication December 6, 2013.
- Accepted for publication June 2, 2014.


Jump to section
Related Articles
Cited By...
- Optimization of Image Reconstruction for 90Y Selective Internal Radiotherapy on a Lutetium Yttrium Orthosilicate PET/CT System Using a Bayesian Penalized Likelihood Reconstruction Algorithm
- Beyond 18F-FDG: Characterization of PET/CT and PET/MR Scanners for a Comprehensive Set of Positron Emitters of Growing Application--18F, 11C, 89Zr, 124I, 68Ga, and 90Y
- The Impact of Image Reconstruction Bias on PET/CT 90Y Dosimetry After Radioembolization