
Main menu

  • Home
  • Content
    • Current
    • Ahead of print
    • Past Issues
    • JNM Supplement
    • SNMMI Annual Meeting Abstracts
    • Continuing Education
    • JNM Podcasts
  • Subscriptions
    • Subscribers
    • Institutional and Non-member
    • Rates
    • Journal Claims
    • Corporate & Special Sales
  • Authors
    • Submit to JNM
    • Information for Authors
    • Assignment of Copyright
    • AQARA requirements
  • Info
    • Reviewers
    • Permissions
    • Advertisers
  • About
    • About Us
    • Editorial Board
    • Contact Information
  • More
    • Alerts
    • Feedback
    • Help
    • SNMMI Journals
  • SNMMI
    • JNM
    • JNMT
    • SNMMI Journals
    • SNMMI

User menu

  • Subscribe
  • My alerts
  • Log in
  • My Cart

Search

  • Advanced search
Journal of Nuclear Medicine
  • SNMMI
    • JNM
    • JNMT
    • SNMMI Journals
    • SNMMI
  • Subscribe
  • My alerts
  • Log in
  • My Cart
Journal of Nuclear Medicine

Advanced Search

  • Home
  • Content
    • Current
    • Ahead of print
    • Past Issues
    • JNM Supplement
    • SNMMI Annual Meeting Abstracts
    • Continuing Education
    • JNM Podcasts
  • Subscriptions
    • Subscribers
    • Institutional and Non-member
    • Rates
    • Journal Claims
    • Corporate & Special Sales
  • Authors
    • Submit to JNM
    • Information for Authors
    • Assignment of Copyright
    • AQARA requirements
  • Info
    • Reviewers
    • Permissions
    • Advertisers
  • About
    • About Us
    • Editorial Board
    • Contact Information
  • More
    • Alerts
    • Feedback
    • Help
    • SNMMI Journals
  • View or Listen to JNM Podcast
  • Visit JNM on Facebook
  • Join JNM on LinkedIn
  • Follow JNM on Twitter
  • Subscribe to our RSS feeds
OtherBasic Science Investigations

Correction Methods for Random Coincidences in Fully 3D Whole-Body PET: Impact on Data and Image Quality

David Brasse, Paul E. Kinahan, Carole Lartizien, Claude Comtat, Mike Casey and Christian Michel
Journal of Nuclear Medicine May 2005, 46 (5) 859-867;
David Brasse
  • Find this author on Google Scholar
  • Find this author on PubMed
  • Search for this author on this site
Paul E. Kinahan
  • Find this author on Google Scholar
  • Find this author on PubMed
  • Search for this author on this site
Carole Lartizien
  • Find this author on Google Scholar
  • Find this author on PubMed
  • Search for this author on this site
Claude Comtat
  • Find this author on Google Scholar
  • Find this author on PubMed
  • Search for this author on this site
Mike Casey
  • Find this author on Google Scholar
  • Find this author on PubMed
  • Search for this author on this site
Christian Michel
  • Find this author on Google Scholar
  • Find this author on PubMed
  • Search for this author on this site
  • Article
  • Figures & Data
  • Info & Metrics
  • PDF
Loading

Article Figures & Data

Figures

  • Tables
  • FIGURE 1.
    • Download figure
    • Open in new tab
    • Download powerpoint
    FIGURE 1.

    Illustrative axial cross-section of cylindric scanner with and without slice-defining septa. Removing septa increases sensitivity by allowing detection of true coincidences that are not perpendicular to scanner axis but also increases FOV for activity that can generate random coincidences. 2D = 2-dimensional.
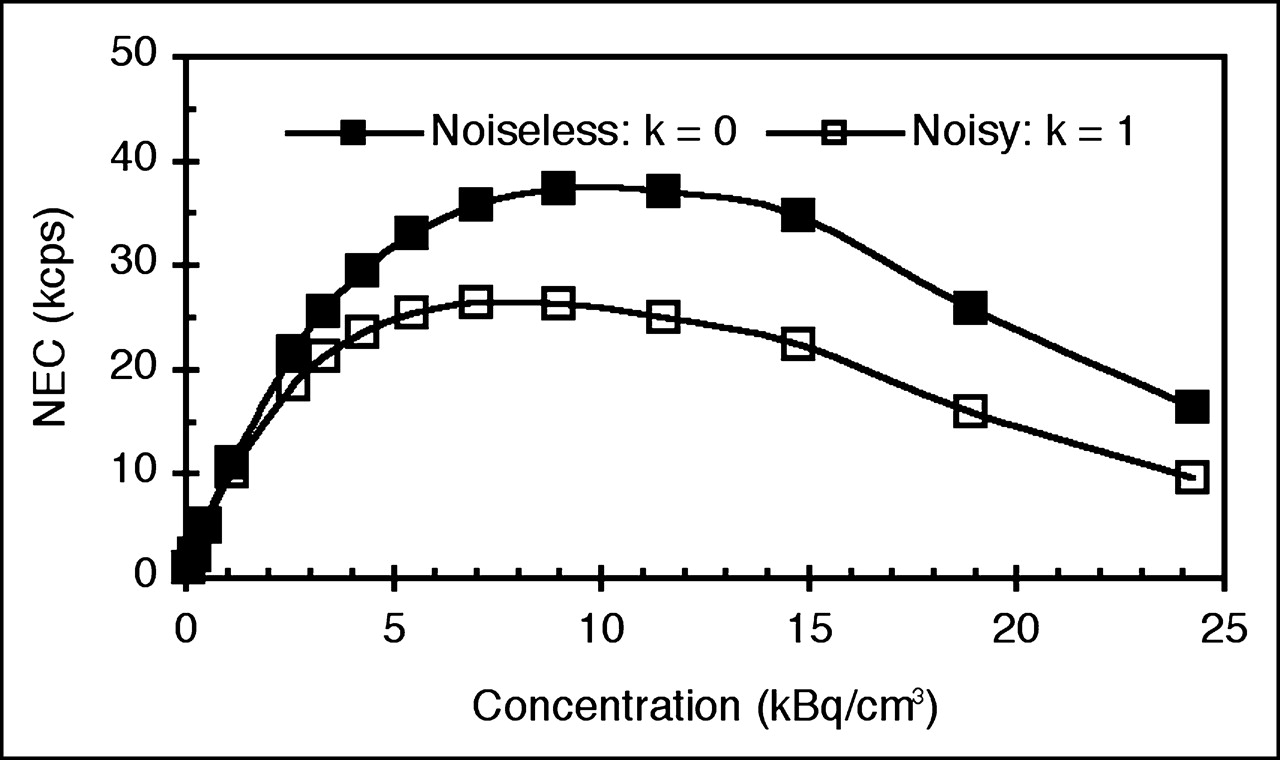
  • FIGURE 2.
    • Download figure
    • Open in new tab
    • Download powerpoint
    FIGURE 2.

    Estimated sinogram NEC rates (7) for a fully 3D patient scan centered over liver for ECAT HR+ scanner show increase in NEC rates by using a noiseless random coincidence estimation method (k = 0) relative to subtraction of delayed coincidences (k = 1).
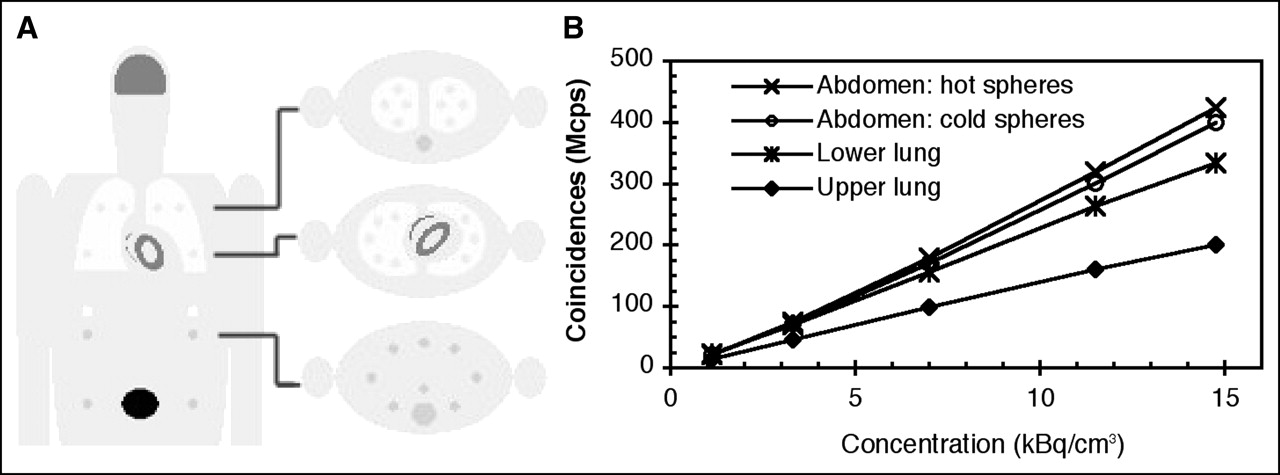
  • FIGURE 3.
    • Download figure
    • Open in new tab
    • Download powerpoint
    FIGURE 3.

    Test phantom. (A) Coronal and 3 of 5 transverse planes of test phantom containing hot and cold test targets. (B) Representative total number of coincidences (T + S + R) used for 4 of the bed positions in simulations as a function of the activity level at scan start.
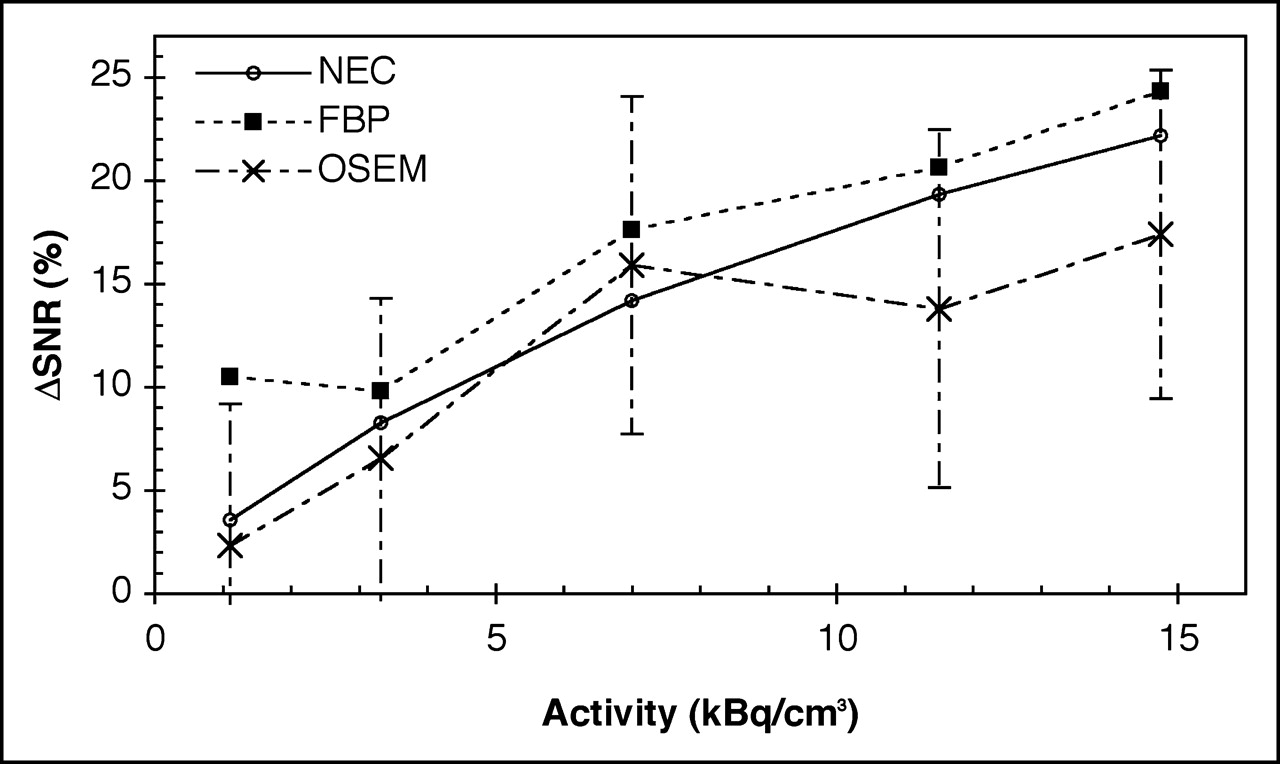
  • FIGURE 4.
    • Download figure
    • Open in new tab
    • Download powerpoint
    FIGURE 4.

    SNRI measured from simulation study as a function of activity concentration.

  • FIGURE 5.
    • Download figure
    • Open in new tab
    • Download powerpoint
    FIGURE 5.

    Improvement in SNR using a noiseless correction relative to an online correction. Improvement in SNR is measured in sinogram using global NEC rate (Eq. 1) and locally in image, as measured by detection of small targets.
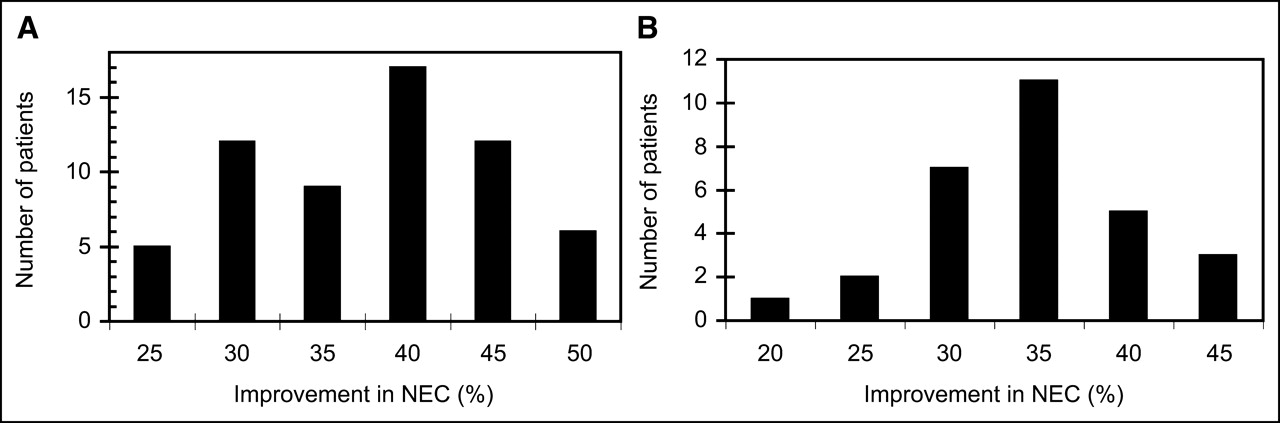
  • FIGURE 6.
    • Download figure
    • Open in new tab
    • Download powerpoint
    FIGURE 6.

    Expected percent improvement in NEC by using singles-based estimation of random coincidences. (A) ECAT ART scanner: 61 patient studies. (B) ECAT HR+ scanner: 23 patient studies.

Tables

  • Figures
    • View popup
    TABLE 1

    Methods for Estimating Random Coincidences

    MethodComments
    Delayed coincidencesAccurate. Higher noise (Eq. 1). Lowest processing requirements.
    Smoothed delayed coincidencesAccurate. Lower noise (0 ≤ k ≪ 1, Eq. 1). Higher processing requirements.
    Calculated from single photon ratesPotential for bias if scanner is not properly calibrated. Lower noise (0 ≤ k ≪ 1, Eq. 1). Low processing requirements.
    • View popup
    TABLE 2

    Count Rates Used to Simulate 5 Whole-Body Acquisitions with Different Activity Concentrations

    Injected dose (MBq)Activity (kBq/cm3)Mcps
    TrueScatteredRandom
    741.18.19.93.5
    1853.321.526.224.7
    3707.037.045.090.0
    55511.547.758.3197.7
    77714.751.763.2283.4
    • Count levels were based on the estimated patient rates (7).

    • View popup
    TABLE 3

    Comparison of Smoothed Delayed Coincidences and Singles-Based Random Coincidence Estimations Averaged over All Sphere Diameters

    Parameter% improvement in SNR compared with delayed coincidences
    Smoothed delayed coincidencesSingles-based estimation
    Background mean2.31.3
    Background SNRI8.37.4
    Hot spheres SNRI17.415.4
    Hot spheres CNR9.43.5
    Cold spheres SNRI23.923.0
    Cold spheres CNR12.613.5
    • Results are expressed as the percent difference from nonsmoothed delayed coincidences.

PreviousNext
Back to top

In this issue

Journal of Nuclear Medicine: 46 (5)
Journal of Nuclear Medicine
Vol. 46, Issue 5
May 1, 2005
  • Table of Contents
  • About the Cover
  • Index by author
Print
Download PDF
Article Alerts
Sign In to Email Alerts with your Email Address
Email Article

Thank you for your interest in spreading the word on Journal of Nuclear Medicine.

NOTE: We only request your email address so that the person you are recommending the page to knows that you wanted them to see it, and that it is not junk mail. We do not capture any email address.

Enter multiple addresses on separate lines or separate them with commas.
Correction Methods for Random Coincidences in Fully 3D Whole-Body PET: Impact on Data and Image Quality
(Your Name) has sent you a message from Journal of Nuclear Medicine
(Your Name) thought you would like to see the Journal of Nuclear Medicine web site.
Citation Tools
Correction Methods for Random Coincidences in Fully 3D Whole-Body PET: Impact on Data and Image Quality
David Brasse, Paul E. Kinahan, Carole Lartizien, Claude Comtat, Mike Casey, Christian Michel
Journal of Nuclear Medicine May 2005, 46 (5) 859-867;

Citation Manager Formats

  • BibTeX
  • Bookends
  • EasyBib
  • EndNote (tagged)
  • EndNote 8 (xml)
  • Medlars
  • Mendeley
  • Papers
  • RefWorks Tagged
  • Ref Manager
  • RIS
  • Zotero
Share
Correction Methods for Random Coincidences in Fully 3D Whole-Body PET: Impact on Data and Image Quality
David Brasse, Paul E. Kinahan, Carole Lartizien, Claude Comtat, Mike Casey, Christian Michel
Journal of Nuclear Medicine May 2005, 46 (5) 859-867;
Twitter logo Facebook logo LinkedIn logo Mendeley logo
  • Tweet Widget
  • Facebook Like
  • Google Plus One
Bookmark this article

Jump to section

  • Article
    • Abstract
    • MATERIALS AND METHODS
    • RESULTS
    • DISCUSSION
    • CONCLUSION
    • APPENDIX
    • Acknowledgments
    • Footnotes
    • REFERENCES
  • Figures & Data
  • Info & Metrics
  • PDF

Related Articles

  • THIS MONTH IN JNM
  • PubMed
  • Google Scholar

Cited By...

  • The Impact of Image Reconstruction Bias on PET/CT 90Y Dosimetry After Radioembolization
  • Google Scholar

More in this TOC Section

  • How Sensitive Is the Upper Gastrointestinal Tract to 90Y Radioembolization? A Histologic and Dosimetric Analysis in a Porcine Model
  • 11C-Methionine PET of Myocardial Inflammation in a Rat Model of Experimental Autoimmune Myocarditis
  • Counting Rate Characteristics and Image Distortion in Preclinical PET Imaging During Radiopharmaceutical Therapy
Show more Basic Science Investigations

Similar Articles

SNMMI

© 2025 SNMMI

Powered by HighWire