


Abstract
Brain κ-opioid receptors (ORs) may be involved in several pathologic conditions, such as addiction, psychosis, and seizures. (±)-4-Methoxycarbonyl-2-[(1-pyrrolidinylmethyl]-1-[(3,4-dichlorophenyl)acetyl]-piperidine (GR89696) is a potent and selective κ-OR agonist. The (−)-isomer, GR103545, is the active enantiomer of GR89696. The aim of this study was to characterize the potential of 11C-GR103545 to image κ-OR in vivo with PET. Methods: Brain uptake of 11C-GR103545 was studied in baboons under control conditions and after blockade by naloxone (1 mg/kg intravenously). Uptake of the racemic 11C-GR89696 and of the inactive enantiomer (+)-11C-GR89696 was also evaluated. Regional total distribution volumes were derived using the arterial input function and a 2-tissue-compartment model. Results: 11C-GR103545 showed excellent brain penetration and uptake kinetics, with significant washout observed within the time frame of the PET experiment. Naloxone pretreatment did not affect cerebellar total distribution volume and reduced total distribution volume in other regions to a level comparable to that in the cerebellum. The regional pattern of 11C-GR103545 binding potential was consistent with the distribution of κ-OR in primate brain, with highest levels observed in anterior cortical regions (prefrontal cortex and cingulate cortex) and striatum. In most regions, the specific-to-nonspecific equilibrium partition coefficient (V3″) ranged from 1 to 2, predicting reliable quantification. 11C-GR103545 V3″ values were approximately double the 11C-GR89696 V3″ values, whereas (+)-11C-GR89696 V3″ values were negligible, demonstrating the enantiomeric selectivity of the binding and the advantage of using the pure active enantiomer for PET studies. Conclusion: 11C-GR103545 is a promising PET radiotracer for imaging the κ-OR.
- κ-opioid receptor
- (−)- 11C-4-methoxycarbonyl-2-[(1-pyrrolidinylmethyl]-1-[(3,4-dichlorophenyl)acetyl]-piperidine
- PET
- baboon
Opioid receptors (ORs) belong to the superfamily of G-protein–coupled receptors and are generally classified into at least 3 subtypes: ∂ (enkephalin-preferring), κ (dynorphin-preferring), and μ (morphine-preferring; β-endorphin may be a major endogenous ligand at this receptor) (1). These different receptor subtypes have been isolated, cloned, and pharmacologically characterized (2). In general, agonists at the μ- and ∂-receptor sites are rewarding and reinforcing, whereas agonists at the κ-receptor site are aversive.
In humans, the κ-OR is the most abundant brain OR and is widely distributed in forebrain, midbrain, and brain stem structures. Its protein and messenger RNA are concentrated in deeper layers of the neocortex (particularly temporal, parietal, and frontal cortices), striatum, and thalamus, with lower levels in amygdala, hippocampus, occipital cortex, and cerebellum (3–5). A similar distribution is seen in the nonhuman primate brain (6,7).
One gene coding for the κ-OR has been identified in humans (3). However, radioligand binding studies have suggested the existence of κ-OR subtypes with different ligand binding and anatomic distribution profiles. Thus, κ1- and κ2-binding sites have been described in rodents, nonhuman primates, and humans (8–10). The cloned human κ-OR appears pharmacologically similar to the κ1-subtype (11), but κ1-receptors appear to compose the minority of κ-OR in primates (9). The κ2-receptor, which is the predominant subtype in primates (8), may represent the heterodimerization of 2 fully functional ORs (κ and ∂), resulting in a new receptor that exhibits ligand binding and functional properties distinct from those of either receptor (12). Other lines of evidence suggest that these different binding subtypes may, in fact, represent different affinity states of the same receptor (13,14).
The κ-OR has been implicated in several clinical brain disorders, including substance (particularly psychostimulant) abuse (15), epilepsy (16), Tourette’s syndrome (17), and Alzheimer’s disease (18). Of additional possible clinical significance is the observation that certain κ-OR agonists are extremely potent hallucinogens (19) and a report that hallucinations in chronic schizophrenia are ameliorated by high-dose naloxone, a relatively nonselective opiate receptor antagonist that antagonizes κ-OR at higher doses (20). In addition, κ-OR agonism promotes (and antagonism reduces) neurodegeneration in models of central nervous system injury and ischemia (21). Thus, the ability to image κ-OR would be important in characterizing the involvement of κ-transmission in these conditions.
Several OR radiotracers are currently available for PET in humans, including 11C-carfentanil (22), 11C-diprenorphine (23), 11C-buprenorphine (24), 18F-cyclofoxy (25), and 11C-naltrindole (26), but none is selective for the κ-OR.
(±)-4-Methoxycarbonyl-2-[(1-pyrrolidinylmethyl]-1-[(3,4-dichlorophenyl)acetyl]-piperidine (GR89696) is a novel, highly potent, and selective κ-OR agonist (27). The (−)-isomer, (−)-4-methoxycarbonyl-2-[(1-pyrrolidinylmethyl]-1-[(3,4-dichlorophenyl)acetyl]-piperidine, also known as GR103545, is the more potent optical isomer of GR89696. GR89696 is centrally penetrating, with a log P value of 3.14 (28), and has potent antinociceptive, sedative, and diuretic effects (28–31). Ki values for GR89696 κ1- and κ2-receptor binding are in the low nanomolar or subnanomolar range. GR89696 displaces 3H-bremazocine binding (representing both κ1- and κ2-receptors) with a Ki of 2.3 nmol/L in the guinea pig (32) and 1.15 nmol/L in the rhesus monkey (33). Ki values at the κ1- and κ2-receptors selectively were 0.5 nmol/L and 6.3 nmol/L, respectively (32).
In 1999, Ravert et al. (34) reported the radiolabeling of the racemic 11C-GR89696. Studies in mice supported the potential of this radiotracer for PET imaging of κ-OR. More recently, Ravert et al. (35) reported the 11C-labeling and in vivo evaluation of both optical isomers of GR89696 in mice. Uptake of the active isomer, 11C-GR103545, correlated with the known distribution of κ-OR. On the other hand, the inactive isomer, (+)-GR89696, showed a homogeneous brain uptake.
The present study was undertaken to further evaluate the potential of the active isomer, 11C-GR103545, as a PET radiotracer to image and quantify κ-OR. PET studies were performed on baboons (Papio anubis) to characterize the kinetics and distribution of 11C-GR103545 in the primate brain. Studies were performed under both control and blocked conditions to demonstrate the specificity of the uptake. Kinetic analyses using the arterial input function were developed to quantify in vivo κ-OR availability. The distribution of 11C-GR103545 in the baboon brain was compared with the distribution of the racemic 11C-GR89696 and of the inactive enantiomer (+)-11C-GR89696, to demonstrate enantiomeric selectivity. The distribution of 11C-GR103545 in the baboon brain was also compared with the distribution of the selective μ-OR agonist radiotracer 11C-carfentanil.
MATERIALS AND METHODS
General
The chiral high-performance liquid chromatography (HPLC) column was a Chiralcel-OD (4.6 × 250 mm; Daicel). The analytic HPLC system was equipped with a Rheodyne injector (Alltech) with a 2-mL sample loop, an ODS-3 column (5 μm, 250 × 4.6 mm; Phenomenex), a PDA detector (Waters), and a flow-cell γ-detector (Bioscan). The semipreparative HPLC system comprised an ODS-Prep column (10 μm, 250 × 10 mm; Phenomenex), an ultraviolet detector (model 450; Alltech), and a pin diode γ-detector (Bioscan). For metabolite analysis, a ODS-Prep column (10-μm, 250 × 4.6 mm; Phenomenex), a flow-cell γ-detector (Bioscan), and a fraction collector (Spectra/Chrom CF-1; Fisher Scientific) were used.
1H-nuclear magnetic resonance (NMR) spectra were recorded on DRX300 or DRX400 NMR instruments (Bruker). Optical rotations were measured using a P-1010 digital polarimeter with a halogen lamp and a 1-cm sample cell (Jasco Inc.).
Chemistry
Numbered compounds refer to the numbering scheme in Figure 1. GR103545 (compound 8) and its optically pure precursor, (−)-7, were prepared from d-serine according to a modification of a published procedure (31). The reaction conditions are shown in Figure 1. The most critical step of the synthesis is the preparation of the optically pure (−)-6, which involves the formation of an intermediate aldehyde from compound 5, followed by a reductive amination reaction. To avoid the undesired racemization, a solution of anhydrous HCl in methanol was used to adjust the pH of the reaction mixture to 6. The optical purity of (−)-6 was further confirmed after its conversion to the optically pure GR103545.
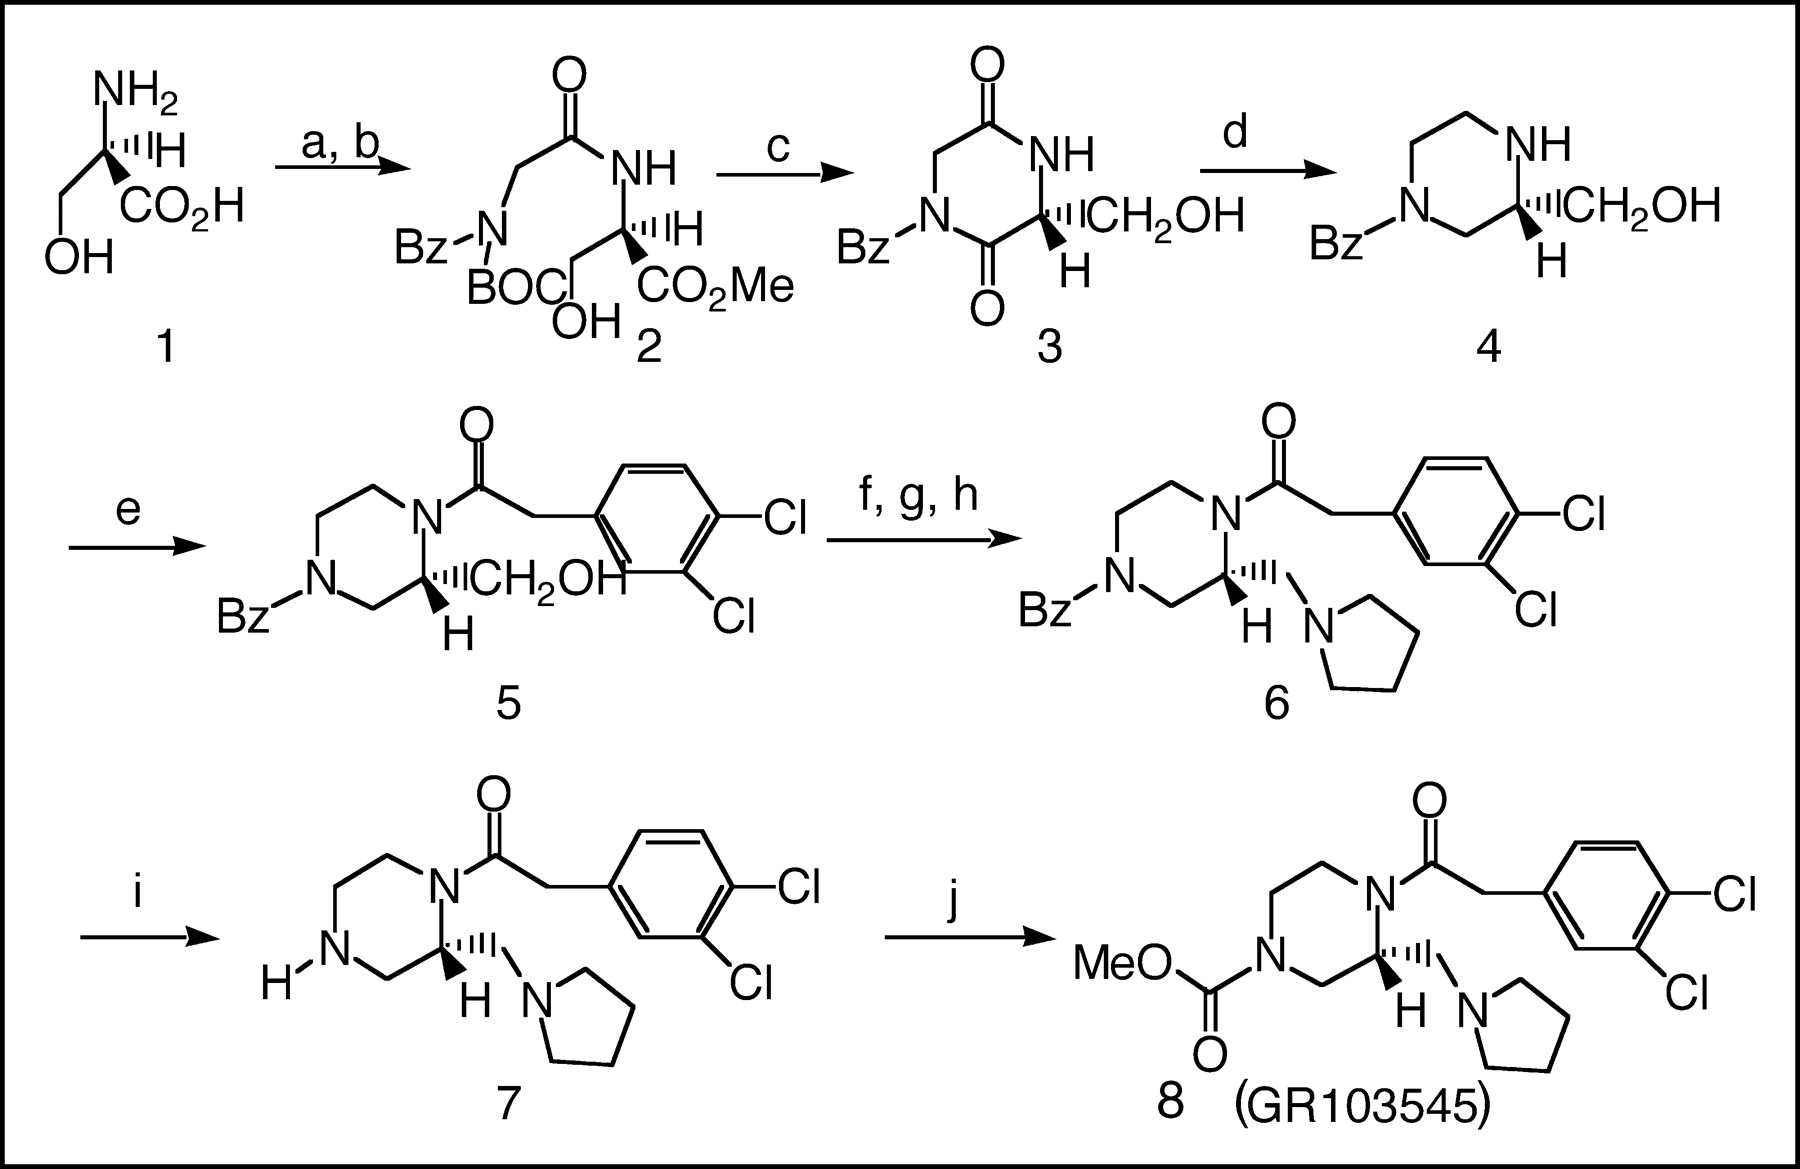
Preparation of GR103545 and the chiral precursor 7. Reaction conditions: (a) thionyl chloride (SOCl2), methanol; (b) N-Boc-N-Bz-NBz-glycine, N,N-dicyclohexylcarbodiimide; (c) SOCl2; (d) lithium aluminum hydride; (e) 3,4-dichlorophenylacetyl chloride; (f) dimethyl sulfoxide, oxalyl chloride, morpholine; (g) pyrrolidine, HCl/methanol, pH 6; (h) sodium cyanoboronhydride3; (i) H2/Pd/C; (j) methyl chloroformate.
The optical purity of the synthetically obtained GR103545 and its chiral precursor, (−)-7, were confirmed by both optical rotation measurements and chiral HPLC analysis (Fig. 2). Our measured optical rotations of GR103545 agreed with those reported in the literature (31,35).

(A) Chiral HPLC separation of optical isomers of compound 7, showing R-(+)-isomer of 7, S-(−)-isomer of 7, and racemic (±) isomers of 7. HPLC conditions: column, Chiralcel OD (250 × 4.6 mm); solvent, 25%:75%:0.01% isopropanol:hexane:diethylamine; flow rate, 2 mL/min. (B) Chiral HPLC separation of optical isomers of GR89695, showing GR103545 (the (−)-isomer) and GR89695 (the racemic isomers). HPLC conditions: column, Chiralcel OD (250 × 4.6 mm); solvent, 20%:80%:0.01% isopropanol:hexane:diethylamine; flow rate, 2 mL/min.
The chiral HPLC procedure was that used by Ravert et al. (35) for the separation of GR103545 from GR89695. A similar procedure was used for the verification of the enantiomeric purities of the synthetically prepared GR103545 and compound 7. Figure 2A shows the baseline separation of both optical isomers of (±)-7. The first peak of the chiral HPLC corresponds to that of (−)-7 isomer. The same conditions were used to isolate the less active enantiomer, (+)-7, from the racemic (±)-7.
Similarly, the 2 optical isomers of GR89695 can be detected by the chiral HPLC method (Fig. 2B). The synthesized GR103545 showed a single peak with a retention time of 6.1 min (top line), indicating the high optical purity of the authentic GR103545.
Synthesis of (−)-1-[(3,4-Dichlorophenyl)Acetyl]-2-[(1-Pyrrolidinyl)Methyl]-Piperidine, (−)-7.
A solution of (−)-1-[(3,4-dichlorophenyl)acetyl]-4-(phenylmethyl)-2-[(1-pyrrolidinyl)methyl]piperidine (0.293 g, 0.521 mmol), compound 6, in 8 mL of tetrahydrofuran:water (1:1) and 0.7 mL of concentrated HCl was hydrogenated (hydrogen balloon) over 10% palladium over charcoal (Pd/C) (0.14 g) at room temperature for 6 h. The solution was filtered through celite, and the filtrate was concentrated in vacuo. The residue was mixed with water (20 mL) and basified with sodium bicarbonate. The mixture was extracted twice with methylene chloride. The organic extracts were combined, dried over sodium carbonate, and concentrated in vacuo. The residue was purified by flash column chromatography on silica gel (100:5:1 methylene chloride:methanol:ammonium hydroxide) to give a colorless oil (0.16 g, 86%). 1H-NMR (deuterated chloroform): 7.4 (br s, 2H), 7.15 (m, 1H), 4.4–4.8 (m, 1H), 3.4–3.9 (m, 3H), 2.4–3.3 (m, 12H), 1.5–2 (br s, 4H + water). [α]25 = −39.86° (c = 0.01756 g/mL, CHCl3). Chiral HPLC (20:80:0.01 isopropanol:hexane:diethylamine, 2 mL/min) showed the presence of only 1 isomer, with a retention time of 3.4 min.
Synthesis of (±)-1-[(3,4-Dichlorophenyl)Acetyl]-2-[(1-Pyrrolidinyl)Methyl]-Piperidine, (±)-7.
(±)-1-[(3,4-dichlorophenyl)acetyl]-4-(phenylmethyl)-2-[(1-pyrrolidinyl)-methyl]piperidine (0.4 g, 0.712 mmol), concentrated HCl (0.85 mL), and Pd/C (0.15 g) in 22 mL of tetrahydrofuran:H2O (1:1) were hydrogenated according to the procedure described above to give (±)-7 (0.24 g, 95%).
Isolation of (+)-1-[(3,4-Dichlorophenyl)Acetyl]-2-[(1-Pyrrolidinyl)Methyl]-Piperidine, (+)-7.
(+)-7 was isolated by chiral HPLC using an analytic Chiralcel-OD and a solvent mixture of 25% isopropanol and 75% hexane with 0.01% diethylamine at a flow rate of 2 mL/min. The retention times for (−)- and (+)-7 were 3.4 and 6 min, respectively. (+)-7: [α]25 = +20.8° (c = 0.0048 g/mL, CHCl3).
Synthesis of GR103545, (−)-8.
To a solution of (−)-7 (1.28 g, 3.596 mmol) and triethylamine (0.51 mL, 3.66 mmol) in methylene chloride at −10°C was added methyl chloroformate (0.278 mL, 3.598 mmol). The solution was stirred at −10°C for 50 min. A solution of aqueous sodium carbonate was added. The mixture was extracted with methylene chloride. The organic extracts were dried and concentrated in vacuo. The residue was purified by flash column chromatography on silica gel (100:5:0.5 methylene chloride:methanol:ammonium hydroxide) to give a colorless oil. Chiral HPLC (10:90:0.01 isopropanol:hexane:diethylamine, Chiralcel-OD, 2 mL/min) showed the presence of only 1 isomer, with a retention time of 6 min. 1H-NMR (deuterated chloroform): 7.4 (m, 2H), 7.15 (m, 1H), 4.4–4.9 (m, 1H), 4–4.2 (m, 2H), 3.7–3.9 (m plus a strong s at 3.75, 4H), 2.4–3.6 (m, 10H), 1.7–1.9 (br s, 4 H).
The oil was dissolved in methanol, and an equal molar amount of fumaric acid (0.192 g) was added. The solution was warmed in a water bath, and ethyl acetate was added to make the solution cloudy. After cooling, the salt was collected by filtration. Melting point = 184°C[b]−185°C, [α]25 = −24.4° (c = 0.0023 g/mL, H2O).
Synthesis of GR89696, (±)-8.
GR89696 was prepared from (±)-7 (0.2 g) according to the procedure described for the preparation of (−)-8. The colorless oil of the free base was converted to the HCl salt. Melting point = 171°C–175°C.
Radiochemistry.
11CO2 was produced via the 14N(p,α) 11C nuclear reaction on a gas target (filled with 1% O2 in N2, 200 psi) using the Columbia University RDS112 negative ion cyclotron (CTI). 11CO2 was delivered into a 0.15-mL solution of lithium aluminum hydride (20 mg) in tetrahydrofuran (5 mL) at room temperature. After trapping, the solution was heated with a heat gun under a stream of argon to remove tetrahydrofuran. A 1% solution of water in diethyleneglycol butyl ether (1 mL) was added to the residue, and the mixture was heated with a heat gun under a stream of argon (25–30 cm 3/min) to distill 11C-methanol into methylene chloride (0.3 mL) in an ice bath. After the distillation, a solution of 20% phosgene in toluene (5 μL) was introduced. The solution was left at room temperature for 5 min, and a solution of (−)-7, the desmethylcarbonyl GR103545 (3 mg), and triethylamine (5 μL) in methylene chloride (0.3 mL) was introduced. The solution was heated at 50°C for 5 min and then evaporated to dryness. The residue was dissolved in 1 mL of acetonitrile and purified by semipreparative HPLC (25% acetonitrile and 75% 0.1 mol/L ammonium formate) at a flow rate of 8 mL/min. The desired tracer had a retention time of 11 min. The product fraction was mixed with 100 mL of water and passed through a C18 Sep-Pak (Waters). After washing with 10 mL of water, the Sep-Pak was eluted with 1 mL of ethanol to recover the tracer. A small portion of the solution was removed for determination of specific activity. The rest of the solution was mixed with 9 mL of saline and passed through a sterile 0.2-μm filter and collected in a vented sterile vial. The specific activity and radiochemical purity were determined by analytic HPLC (30% acetonitrile and 70% 0.1 mol/L ammonium formate, 2 mL/min).
11C-GR89696 (the racemic tracer) and the 11C-labeled inactive enantiomer, (+)11C-GR89696, were similarly prepared starting from (±)-7 (the racemic precursor) and (+)-7 (the inactive isomer), respectively.
Baboon PET Studies
General Design.
Three adult male baboons (baboons A, B, and C; 24, 13, and 14 kg, respectively) were studied in 10 separate PET experiments. The first aim was to characterize the brain uptake of 11C-GR103545 under control and blocked conditions. Each baboon was studied in 2 PET experiments (i.e., 6 scans). The first experiment was a baseline scan with 11C-GR103545 to establish the regional distribution of its specific binding. After this, the nonselective opiate receptor antagonist naloxone was administered in a dose of 1 mg/kg intravenously, to block specific binding of the tracer. This was followed by a second scan with 11C-GR103545. The second aim was to evaluate the enantiomeric selectivity of the uptake. For this purpose, baboon A was studied in 4 PET experiments, the first with 11C-GR89696, that is, the racemic tracer; the second with 11C-GR89696 after pretreatment with naloxone, 1 mg/kg intravenously; the third with 11C-GR103545, that is, the active optical isomer; and the fourth with (+)- 11C-GR89696, that is, the inactive isomer.
PET Experimental Procedures.
Experiments were performed according to protocols approved by the Columbia Presbyterian Medical Center Institutional Animal Care and Use Committee and previously described (36). In summary, unfed animals were immobilized with ketamine (10 mg/kg intramuscularly) and anesthetized with 1%–2% isoflurane in O2 via an endotracheal tube. A catheter was inserted in a femoral artery for arterial blood sampling. PET was performed with the ECAT EXACT HR+ scanner (Siemens/CTI) in 3-dimensional mode. A 10-min transmission scan was obtained before radiotracer injection for attenuation correction. Radiotracers were administered by intravenous bolus injection over 30 s. Emission data were collected in 3-dimensional mode for 121 min as 24 successive frames of increasing duration (6 × 10 s, 2 × 1 min, 4 × 2 min, 2 × 5 min, 10 × 10 min).
Input Function Measurement.
Procedures associated with measurement of the input function have previously been described in detail (36). In summary, arterial samples were collected every 10 s for the first 2 min and every 20 s from 2 to 4 min using an automated blood-sampling system and drawn manually thereafter at various intervals to a total of 30 samples. Six samples (collected at 2, 4, 12, 30, 60, and 90 min) were analyzed by HPLC to determine the fraction of plasma activity representing unmetabolized parent tracer. A biexponential function was fitted to the 6 measured parent fractions and used to interpolate values between and after the measurements. The input function was then calculated as the product of total counts and interpolated parent fraction at each time point. The measured input function values were fitted to a sum of 3 exponentials and the fitted values were used as input for the kinetic analyses. The clearance of the parent tracer (L/h) was calculated as the ratio of the injected dose to the area under the curve of the input function. The initial distribution volume (Vbol, in L) was calculated as the ratio of the injected dose to peak plasma concentration. The plasma free fraction (f1) was determined by ultrafiltration of triplicate 0.2-mL aliquots of plasma. The amount of radioactivity in the filter unit and the filtrate was counted. The f1 was calculated as the ratio of the concentration (radioactivity/mL) of the filtrate to that of the total.
Image Analysis.
An MR image of each baboon’s brain was obtained to identify the regions of interest (ROIs), as previously described (36). The following regions were drawn on the MR images: cerebellum; brain stem; thalamus; striatum; medial temporal lobe; and temporal, cingulate, frontal, parietal, and occipital cortices.
PET emission data were attenuation corrected using the transmission scan, and frames were reconstructed using a Shepp filter (cutoff frequency of 0.5 cycles per projection ray). Reconstructed image files were then processed by MEDx image analysis software (Sensor System). Each baboon’s PET images were coregistered with the corresponding MR image as previously described (36). ROI boundaries were transferred from the MR image to the individual registered PET frames, and time–activity curves were measured and decay corrected. Right and left regions were averaged. For a given animal, the same regions were used for all radiotracers.
Brain Uptake.
Total brain uptake was expressed as the percentage of the injected dose per gram of tissue in a region encompassing the entire brain. Regional peak times were defined as the mid time of the frame associated with the highest activity value. To estimate the degree of washout from the brain captured during the scan (121 min), the decrease in activity from the peak to that recorded during the last frame of acquisition was calculated and expressed as a percentage of the peak activity.
Derivation of VT.
Regional total distribution volumes (VT, in mL/g) were derived by kinetic analysis of the regional time–activity curves, using the metabolite-corrected arterial plasma concentrations as the input function, according to a 1- or 2-tissue-compartment model. Kinetic parameters (K1 and k2 for the 1-tissue-compartment model; K1–k4 for the 2-tissue-compartment model) were derived by nonlinear regression using a Levenberg-Marquart least-squares minimization procedure implemented in MATLAB (The Math Works, Inc.). In the 1-tissue-compartment model, K1 (mL/g/min) and k2 (per min) are the rate constants governing the transfer of the ligands into and out of the brain, respectively. In the 2-tissue-compartment model, K1 and k2 are the rate constants governing the transfer of the ligands into and out of the nondisplaceable compartment (free and nonspecific binding), whereas k3 (per min) and k4 (per min) describe the respective rates of association to and dissociation from the receptors.
VT was derived from kinetic parameters as:
 Eq. 1 in the 1-tissue-compartment model, and as:
 Eq. 2 in the 2-tissue-compartment model.
Analysis of the first 6 PET experiments showed that, using an unconstrained 2-tissue-compartment model, the Levenberg-Marquart algorithm failed for almost all regions in half the experiments, as some kinetic parameters assumed a negative value. Therefore, a constrained (k > 0) sequential quadratic programming algorithm (also implemented in MATLAB) was used. Given the unequal sampling over time (increasing frame acquisition time from the beginning to the end of the study), the least-squares minimization procedures were weighted by frame duration.
Derivation of κ-OR Parameters.
Cerebellar VT (VT CER) was used as an estimate of the nondisplaceable distribution volume (including free and nonspecific binding) in the ROIs. The binding potential (BP, in mL/g) was derived as the difference between VT in the ROI (VT ROI) and VT CER. BP is related to receptor parameters by:
 Eq. 3 where Bmax is the concentration of available sites (nmol/L/g of tissue) and KD is the in vivo equilibrium dissociation constant of the radiotracer (nmol/L/ml of brain water) (37).
The main outcome measure of interest was the specific-to-nonspecific equilibrium partition coefficient (V3″). V3″ was calculated as the ratio of BP to VT CER and related to receptor parameters by:
 Eq. 4 where f2 is the free fraction in the nonspecific distribution volume of the brain (f2 = f1/VT CER) (37).
Statistical Analysis.
Values are given as mean ± SD. Dependant variables were analyzed using a paired t test, ANOVA, or repeated-measures ANOVA, when appropriate. Post hoc tests were performed using the Fisher test of protected least-significant difference. A 2-tailed probability value of 0.05 was selected as the significance level. Goodness of fit of models with different levels of complexity was compared using the Akaike information criterion and the F test. The SE of the parameters was given by the diagonal of the covariance matrix and expressed as a percentage of the parameters (coefficient of variation). Primary references have been published by Laruelle et al. (37).
RESULTS
Radiochemistry
The synthesis time for 11C-GR103545 was about 50 min. Radiochemical yield (based on the amount of 11CO2) at end of synthesis (EOS) was about 2%. Chemical purity was more than 95% and radiochemical purity was more than 98%.
PET Experiments
Injected Doses.
Mean ± SD and ranges of injected doses, specific activities at time of injections, and injected masses for the 11C-GR103545 and 11C-GR89696 scans (n = 10) were 107.3 ± 40.7 MBq (37.0–177.6 MBq), 9,916 ± 5,069 GBq/mmol (3,700–18,315 GBq/mmol), and 0.00025 ± 0.00011 mg/kg (0.00016–0.00051 mg/kg). Masses below 0.0003 mg/kg were generally without significant effects on blood pressure, heart rate, respiratory rate, or recovery from anesthesia. Masses higher than 0.0003 mg/kg were limited to 2 scans blocked with naloxone, when potential physiologic side effects from κ-OR agonism were prevented.
Plasma Analysis.
Plasma metabolite analysis after the injection of 11C-GR103545 revealed no lipophilic metabolites. The fraction of total plasma activity corresponding to the parent compound at 2, 4, 12, 30, 60, and 90 min after injection of 11C-GR103545 (n = 4 experiments) was 91% ± 10%, 83% ± 14%, 55% ± 12%, 35% ± 7%, 25% ± 5%, and 28% ± 9%, respectively. Initial distribution volume (Vbal) clearance, and f1 for 11C-GR103545 were 1.9 ± 0.5 L, 23.3 ± 8.6 L/h, and 24% ± 9%, respectively (n = 4 experiments).
Control Experiments.
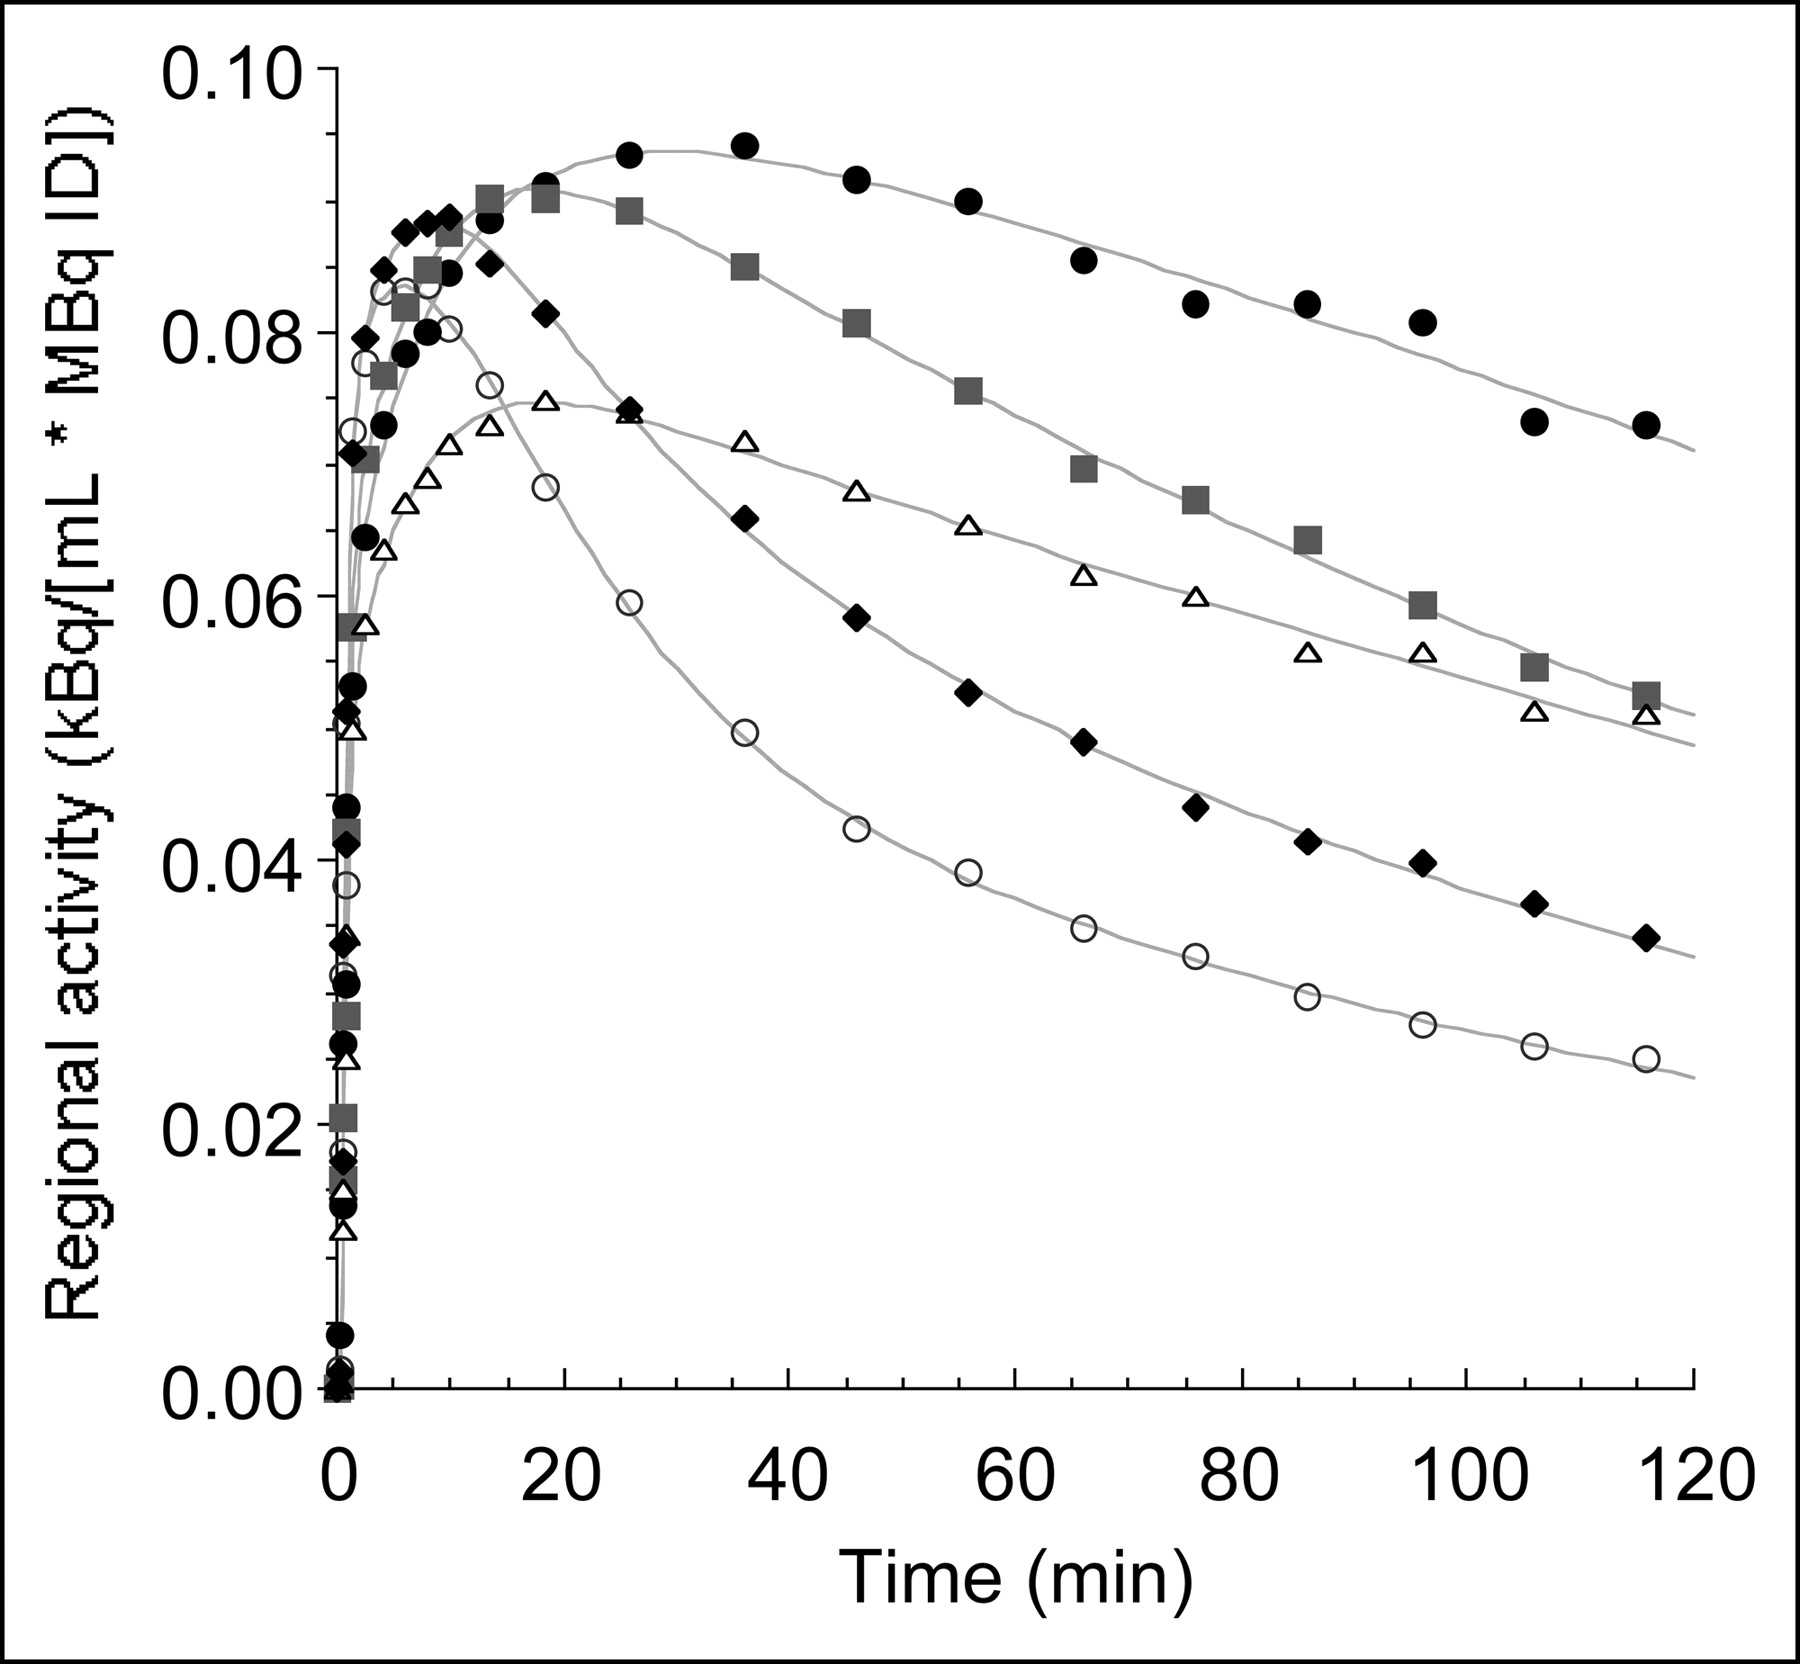
11C-GR103545 showed excellent brain penetration, with peak total brain uptake of 0.010% ± 0.004% injected dose per gram at 16 ± 3 min (n = 4 experiments). Over time, activity became concentrated in regions with high κ-OR densities, that is, cingulate cortex, striatum, frontal cortex, temporal cortex, and parietal cortex. Intermediate levels were found in thalamus and medial temporal lobe, and low levels in brain stem and occipital cortex. Lowest levels were found in cerebellum (Fig. 3A). Figure 4 displays time–activity curves for a subset of representative brain regions (cerebellum, occipital cortex, frontal cortex, parietal cortex, and cingulate cortex) after administration of 11C-GR103545. Good separation was seen between activities in different regions. In regions with lowest activity, initial uptake was rapid, with an early and sharp peak, followed by rapid washout. In regions with higher activity, uptake was slower, with smoother peaks, followed by moderate washout. Regional mean peak uptake times are presented in Table 1. Regional rank order for 11C-GR103545 peak uptake time was cerebellum < occipital cortex < brain stem < thalamus = medial temporal lobe < temporal cortex < frontal cortex = parietal cortex < striatum < cingulate cortex. Rank order for the mean regional washout of 11C-GR103545 (relative decrease from peak time to the last frame; Table 1) was cerebellum > occipital cortex > brain stem > temporal cortex > parietal cortex > thalamus = medial temporal lobe > frontal cortex > cingulate cortex = striatum.
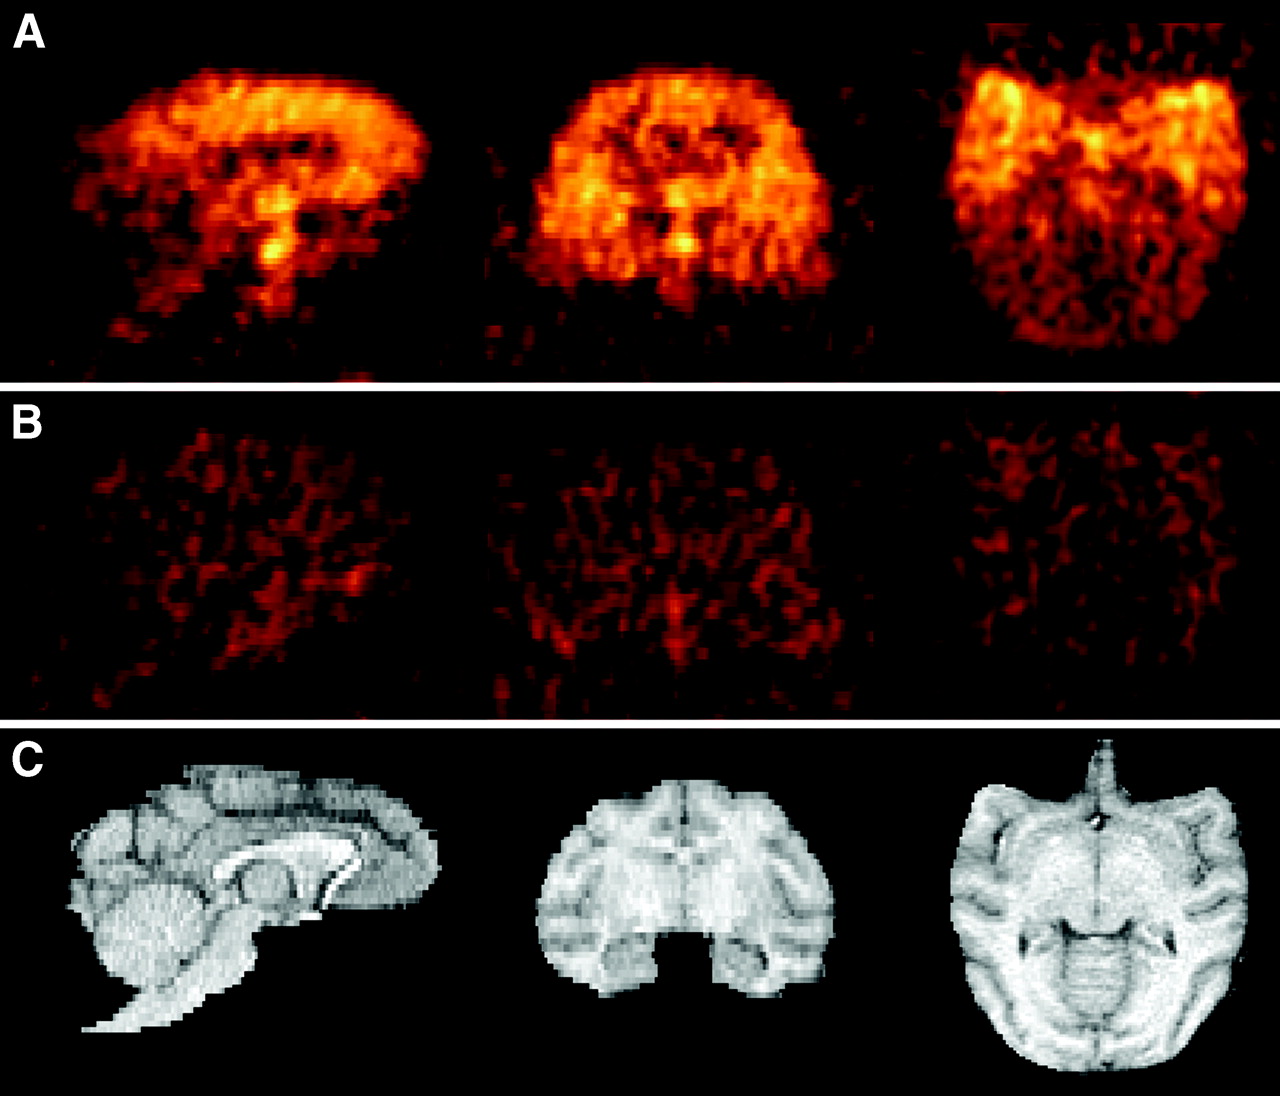
(A) Sagittal (left), coronal (middle), and transverse (right) slices of representative baboon PET scan acquired from 40 to 80 min after injection of 11C-GR103545. Activity is concentrated in cingulate, frontal, temporal, and parietal cortices; medial temporal lobe; and striatum. Little activity is seen in brain stem and occipital cortex. Cerebellar uptake appears close to background level. (B) 11C-GR103545 scans (same slices in same baboon over same interval) after pretreatment with naloxone, 1 mg/kg intravenously. Images in A and B are normalized to their respective injected doses of activity and displayed with same intensity range. (C) Coregistered MR images of same baboon.

Time–activity curves in selected brain regions from single, representative study after bolus injection of 11C-GR103545: cerebellar (○), occipital (♦), frontal (▵), parietal (▪), and cingulate (•). Points are measured values; lines are values fitted to a 2-tissue-compartment model. ID = injected dose.
Regional Peak Uptake Times and Activity Washout for 11C-GR103545
The 4 11C-GR103545 baseline scans were chosen to assess the best model for kinetic analysis. In all regions, VT was larger when calculated with a 2-tissue-compartment model than when calculated with a 1-tissue-compartment model, and this difference was statistically significant (repeated-measures ANOVA, effect of model P ≤ 0.0001). There was no significant difference in the SE of VT (percentage coefficient of variation) between the 2 models (repeated-measures ANOVA, effect of model P = 0.07). However, the goodness of fit to the data, as indicated by the Akaike information criterion, was significantly better for the 2-tissue-compartment model (repeated-measures ANOVA, effect of model P ≤ 0.0001). Similarly, the F test indicated a significantly better fit (P ≤ 0.05) for the 2-tissue-compartment model in all 4 studies for 6 of the 10 regions and in 3 of the 4 studies for the remaining 4 regions (Table 2). Moreover, mean regional F values were significantly different from unity (i.e., the null hypothesis of no difference in goodness of fit between 2-tissue-compartment model and 1-tissue-compartment model) by paired t test (P = 0.02). In view of the significant difference in calculated VT between the 2 models, and the significantly better fit to the data (Akaike information criterion and F test) of the 2-tissue-compartment model, the 2-tissue-compartment model was selected as the best model for the kinetic analysis of all ROIs, including the reference region (cerebellum).
Comparison of Compartment Models for 11C-GR103545 Kinetic Analysis
Table 3 (baseline columns) displays the regional VT, BP, and V3″ values for 11C-GR103545. The rank order for specific binding was cingulate cortex > striatum > frontal cortex > temporal cortex > parietal cortex > medial temporal lobe > thalamus > brain stem > occipital cortex. Values of V3″ were above 0.5 for all regions except brain stem and occipital cortex. Specific binding was blocked by pretreatment with naloxone.
11C-GR103545 Binding Parameters at Baseline and After Naloxone
Blocking Experiments.
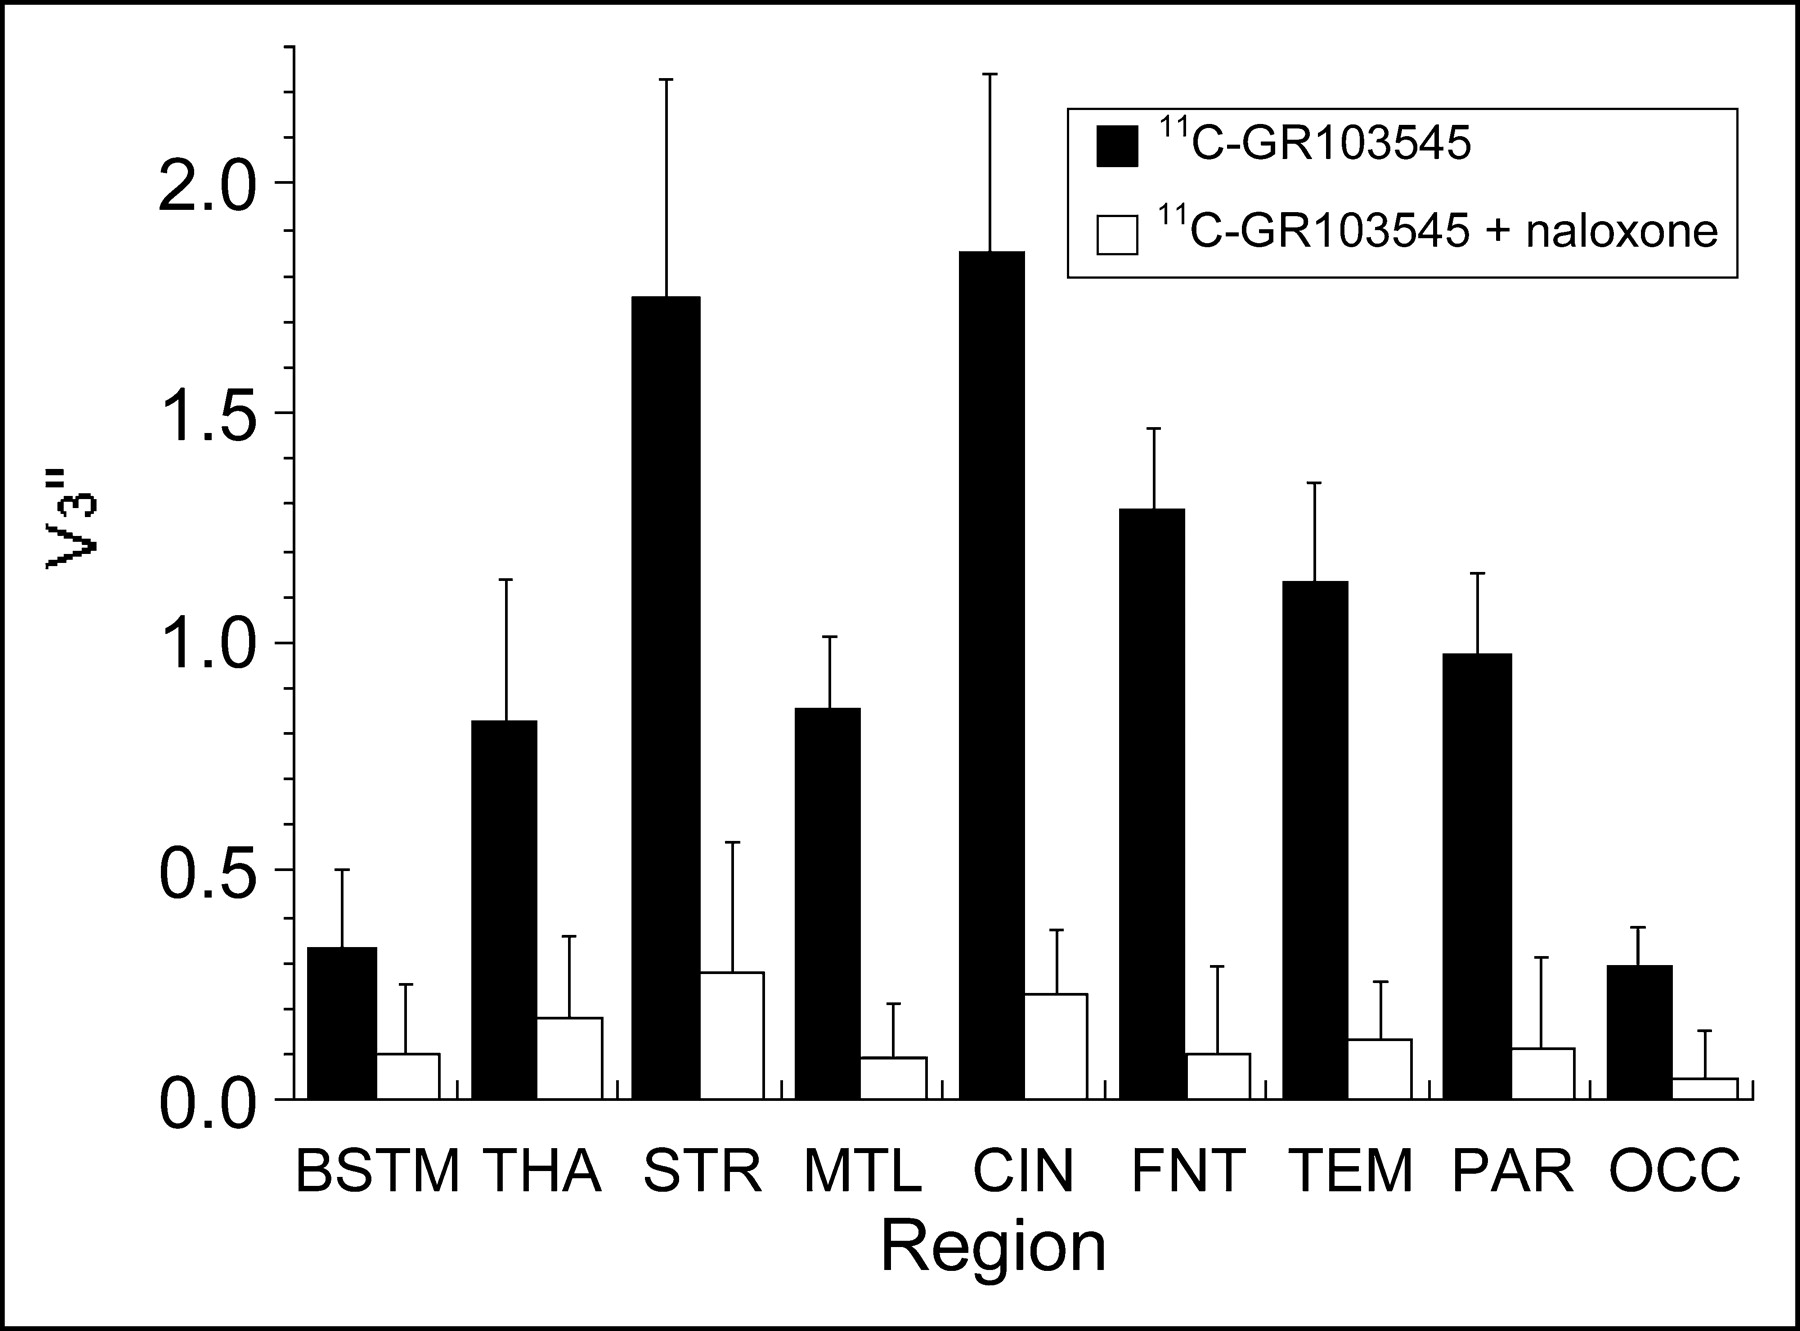
After naloxone, 1 mg/kg intravenously (Table 3, after-naloxone columns, and Fig. 5), values of BP and V3″ fell significantly (repeated-measures ANOVA, P < 0.001) across all regions to fairly homogeneous low-to-negligible levels. The change in VT CER after naloxone was not significant (from 3.7 to 3.4 mL/g; P = 0.77), supporting the absence of significant specific binding in that region.

Mean regional V3″ values for 11C-GR103545 at baseline and after pretreatment with naloxone, 1 mg/kg intravenously (n = 3). Error bars = SD. After naloxone, regional V3″ values are significantly reduced (repeated-measures ANOVA, P < 0.001) and approach homogeneous low-to-negligible levels. BSTM = brain stem; THA = thalamus; STR = striatum; MTL = medial temporal lobe; CIN = cingulate cortex; FNT = frontal cortex; TEM = temporal cortex; PAR = parietal cortex; OCC = occipital cortex.
Assessment of Enantiomeric Selectivity.
Figure 6 displays brain time–activity curves for a subset of representative brain regions (cerebellum, occipital cortex, frontal cortex, parietal cortex, and cingulate cortex) for the 4 experiments performed on baboon A to compare the imaging properties of the racemic compound 11C-GR89696 and its active (11C-GR103545) and inactive ((+)-11C-GR89696) enantiomers. To facilitate comparison, activities displayed in Figure 6 are normalized to injected doses, and scales of the axes have been kept constant. All 3 compounds showed good brain penetration. Racemic 11C-GR89696 (Fig. 6A) showed moderate separation between activities in different regions. Initial uptake was rapid, with fairly early and sharp peaks, followed by moderate washout. After pretreatment with naloxone, 11C-GR89696 activity (Fig. 6B) peaked more rapidly, was followed by rapid washout, and showed little separation between regions. In comparison with the racemic 11C-GR89696, 11C-GR103545 (Fig. 6C) showed similar initial uptake, but more rapid washout in the region of reference (cerebellum). There was greater separation between regions, as well as smoother, more protracted peaks and slower washout in regions with highest activity, potentially predicting higher specific binding. In contrast, the inactive enantiomer (+)-11C-GR89696 (Fig. 6D) showed sharp peaks, rapid washout, and minimal separation between regions. The time–activity curves were similar in appearance to those measured when the specific binding of 11C-GR89696 was blocked by naloxone (Fig. 6B).
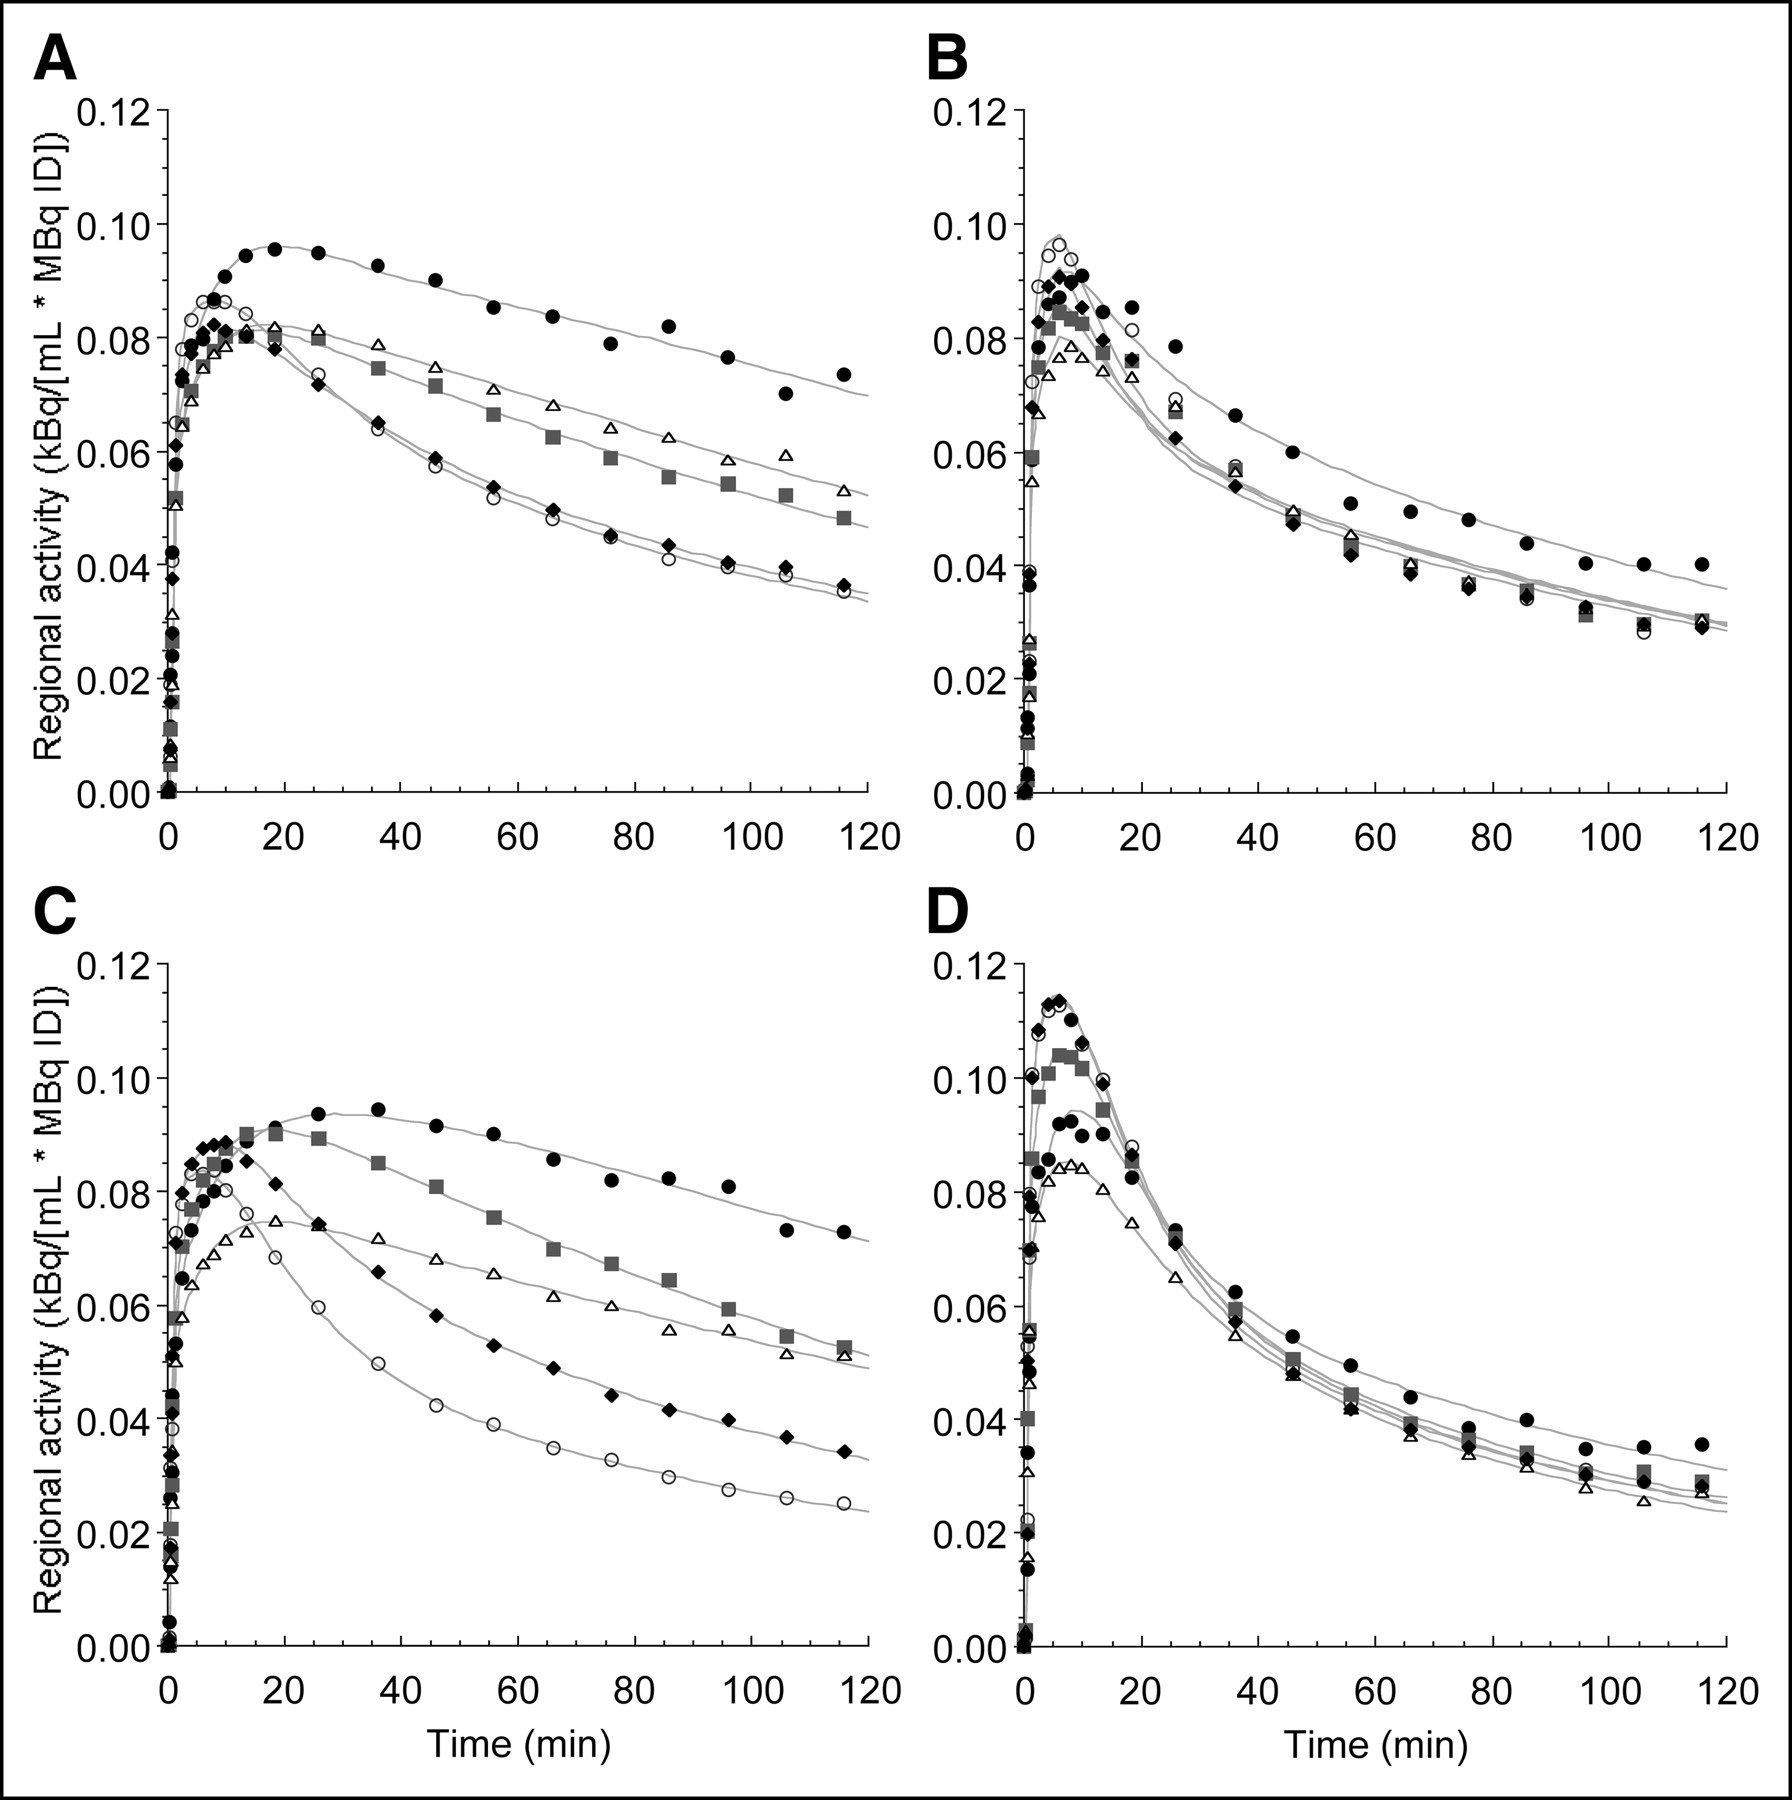
Time–activity curves in selected brain regions from 4 experiments performed on baboon A: cerebellar (○), occipital (♦), frontal (▵), parietal (▪), and cingulate (•). (A) Racemic 11C-GR89696. (B) 11C-GR89696 after pretreatment with naloxone. (C) The active enantiomer 11C-GR103545. (D) The inactive enantiomer (+)- 11C-GR89696. Points are measured values; lines are values fitted to a 2-tissue-compartment model. ID = injected dose.
Regional V3″ values are shown in Table 4 for each of the 4 conditions. As predicted, V3″ values were higher in all regions (by approximately 56%–200%) for 11C-GR103545 than for 11C-GR89696. For 11C-GR89696, V3″ values were low or moderate across regions, with the highest value (cingulate cortex) not exceeding 1.0. This specific binding was almost entirely blocked by pretreatment with naloxone, 1 mg/kg intravenously, as indicated by values of V3″ homogeneously close to zero. Similarly, (+)-11C-GR89696 had only homogeneous, nonspecific uptake.
Assessment of Enantiomeric Selectivity
DISCUSSION
This paper has characterized 11C-GR103545, a novel radiotracer for imaging κ-OR with PET. 11C-GR103545 demonstrated the favorable characteristics required of a useful PET radiotracer (38).
The synthesis method reported here resulted in optical purity of the synthetically obtained GR103545 and its chiral precursor, (–)-7, and our measured optical rotations of GR103545 agreed with those reported in the literature (31,35). The radiosyntheses of 11C-GR103545, 11C-GR89695, and (+)-11C-GR89695 previously reported used 11C-methyl chloroformate and the corresponding precursors (34). Using this method, we found that the specific activities of all 3 tracers were relatively low (ranged from approximately 5,550 to 18,315 GBq/mmol EOS) in comparison to those achieved using 11C-methyl iodide in our center (55.5–148.0 TBq/mmol EOS). A high specific activity will be important for human studies, as GR103545 is a potent κ-OR agonist. No pharmacologic effects of 11C-GR103545 were detected in the studies reported here.
Plasma metabolite analysis revealed no lipophilic metabolites having a propensity to diffuse into the brain. The metabolic rate was moderate, with 27% of unmetabolized parent remaining at 60 min after injection. f1 was high enough (24%) to be measurable with conventional ultracentrifugation techniques. Thus, the input function could appropriately be characterized.
As predicted by its lipophilicity (log P = 3.14), 11C-GR103545 shows excellent brain penetration. However, the nonspecific binding was relatively low, with a VT CER value of 3.7 mL/g. Given an f1 of 24%, a nonspecific distribution volume of 3.7 mL/g indicates that the free fraction in the nondisplaceable compartment is 6.4%, which is acceptable. The washout from the brain was fast enough to permit a practical scan duration (120 min in our experiments). The peak uptake of 11C-GR103545 in the highest uptake region (cingulate cortex) was achieved in about 40 min and showed 23% washout by the end of the scan (Table 1).
The regional uptake was amenable to quantitative analysis using compartmental modeling. Regional VT was derived by kinetic analysis of the regional time–activity curves, using the metabolite-corrected arterial plasma concentrations as the input function, according to a 1-tissue-compartment model and a 2-tissue-compartment model. VT was significantly larger when calculated with a 2-tissue-compartment model, and a 2-tissue-compartment model provided a significantly better fit to the data as indicated by both the Akaike information criterion and the F test (Table 2). The 2-tissue-compartment model was therefore selected as the best model for kinetic analysis of all ROIs, including the reference region (cerebellum). Using this model, regional VT values were derived with appropriate confidence (percentage coefficient of variation < 3%; Table 2). The fact that a 2-tissue-compartment model was found to be superior in both receptor-rich and reference (cerebellum) regions does not necessarily imply the presence of a significant specific binding compartment in the cerebellum, as model order determination is not always based strictly on the presence or absence of receptors in a region. However, it may have implications for alternative methods for deriving receptor parameters. If the reference region is not parsimoniously fitted by a 1-tissue-compartment model, then fitting procedures based on this assumption and using reference tissue (as opposed to plasma) inputs may be prone to error (39).
The derivation of receptor parameters requires determination of the specific and nonspecific components of the regional distribution volume. The most practical method to derive these contributions is to use VT in a region of reference (i.e., a region devoid of significant receptor density) as an estimate of the nonspecific distribution volume. Despite the fact that low density of κ-OR has been reported in the cerebellum (6,40), its use as a region of reference was validated in this study. First, blocking the κ-OR with naloxone failed to significantly affect 11C-GR103545 VT CER, indicating that the contribution of saturable binding to 11C-GR103545 VT CER was negligible. Second, under blocking conditions, VT ROI values were comparable to VT CER (Table 3 and Fig. 5).
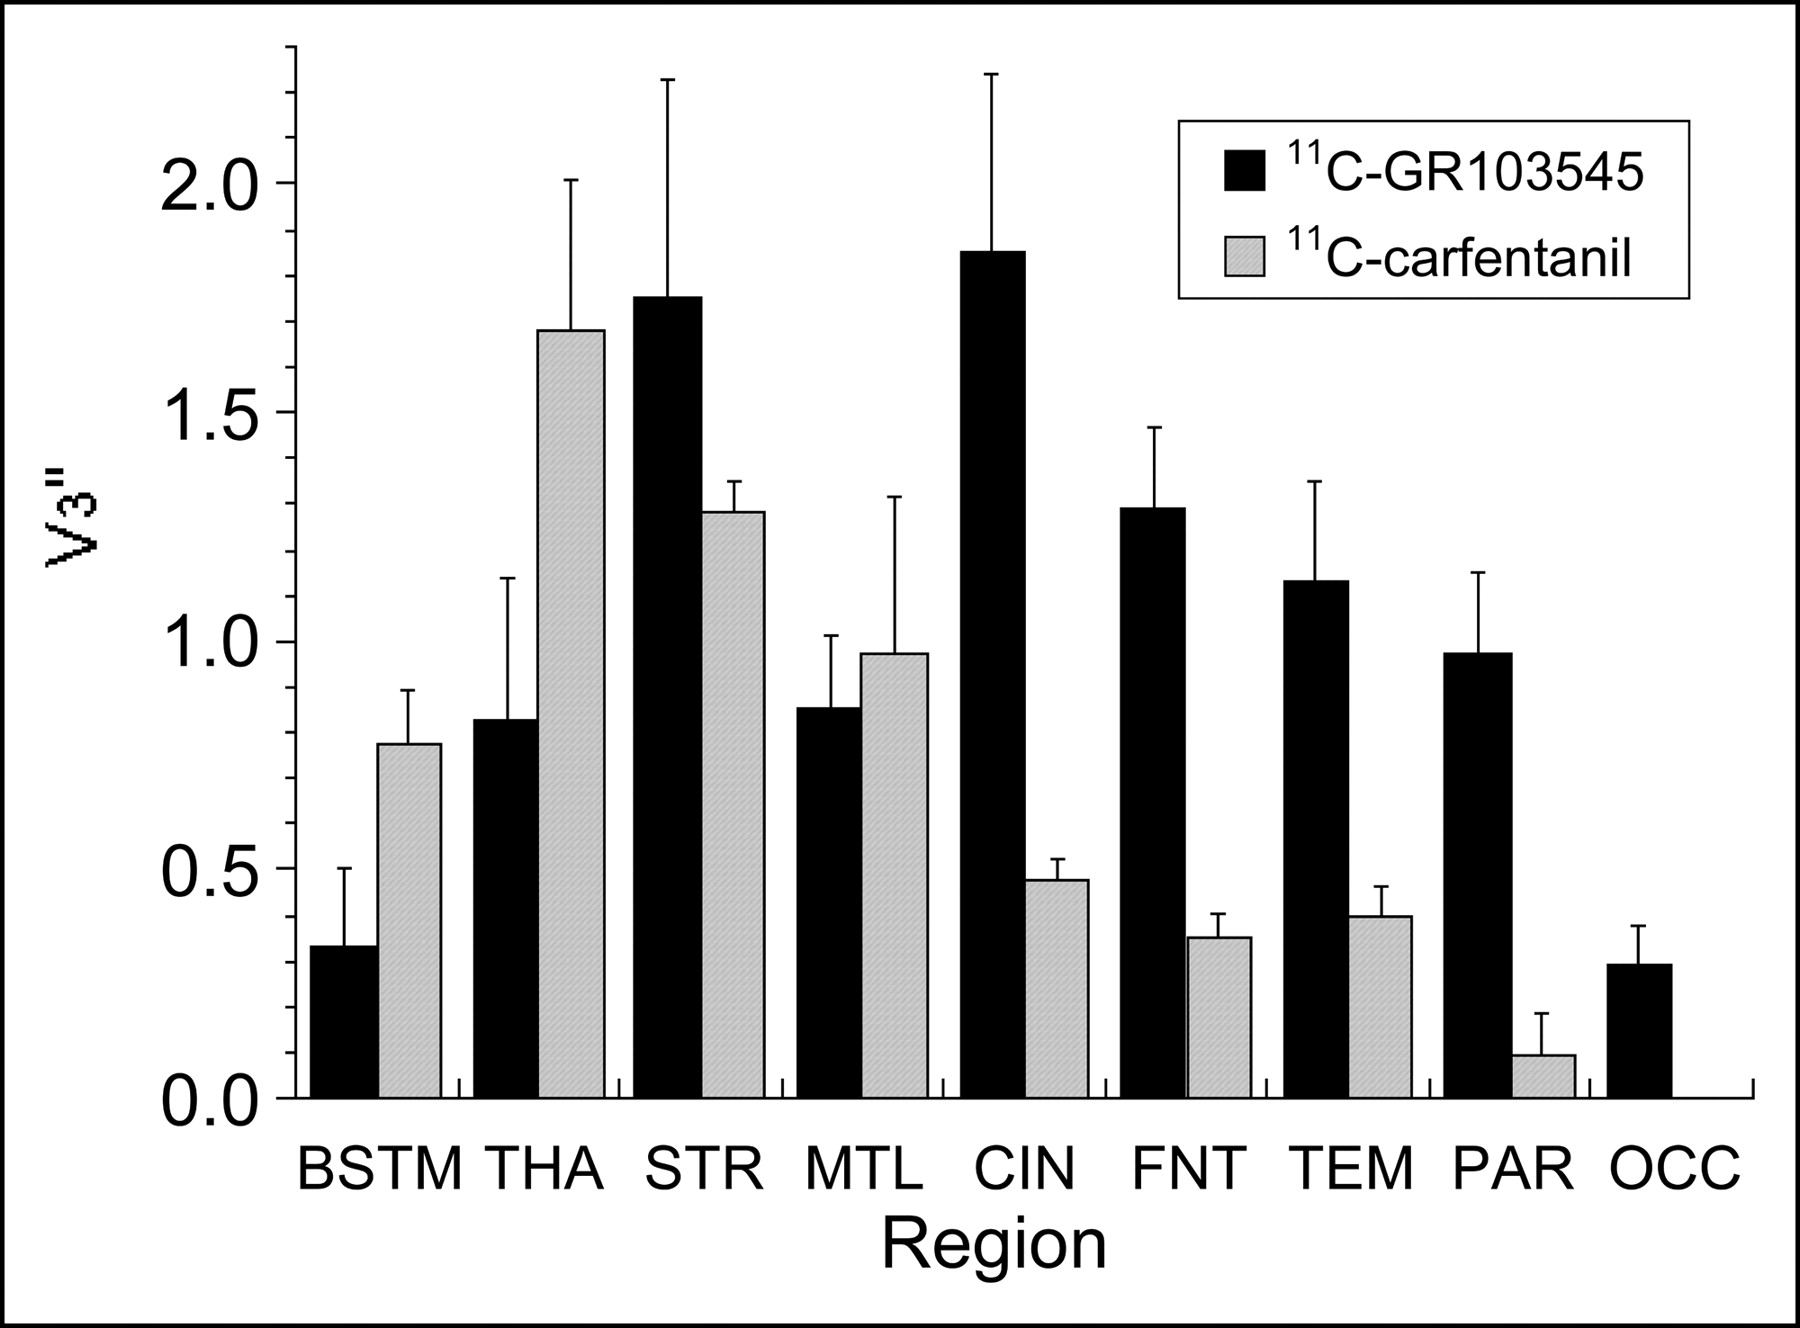
The regional pattern of 11C-GR103545 specific binding found in baboons in this study agrees strongly with the regional distribution of κ-OR demonstrated in the nonhuman primate brain in in vitro and autoradiography studies (6,7), supporting the κ-OR–selective profile of 11C-GR103545 as a radiotracer. Thus, 11C-GR103545 specific binding was highest in cingulate cortex, striatum, frontal cortex, temporal cortex, and parietal cortex; intermediate levels were found in thalamus and medial temporal lobe; and low levels in brain stem and occipital cortex. In addition, the regional pattern of 11C-GR103545 specific binding is quite different from that of 11C-carfentanil, a μ-OR–selective radiotracer, again supporting a non–μ-OR profile for 11C-GR103545. Figure 7 compares regional baseline V3″ values for 11C-GR103545 (n = 4) with regional V3″ values for 11C-carfentanil (n = 9) acquired in our laboratory in the same baboons and using the same ROIs. For 11C-carfentanil, V3″ values are highest in thalamus and striatum; moderate in medial temporal lobe and brain stem; and low in cingulate cortex, frontal cortex, temporal cortex, and parietal cortex. Specific binding is negligible in occipital cortex, which is commonly used as a region of reference for this tracer. Thus, regions with high or moderate 11C-GR103545 V3″ values (e.g., cingulate cortex, frontal cortex, temporal cortex, and parietal cortex) have low 11C-carfentanil V3″ values. Conversely, the region with highest 11C-carfentanil V3″ (thalamus) has only moderate 11C-GR103545 specific binding. Additional competition experiments, using κ-selective agents, are required to further establish the in vivo selectivity of the specific binding of 11C-GR103545 for κ-OR. However, to date, in vivo pharmacology studies in rhesus monkeys have revealed only potent κ-OR–mediated agonist effects of GR89696 in behavioral, respiratory, and neuroendocrine assays (33).

Comparison between 11C-GR103545 (n = 3) and 11C-carfentanil (n = 9) regional V3″ values in same baboons. BSTM = brain stem; THA = thalamus; STR = striatum; MTL = medial temporal lobe; CIN = cingulate cortex; FNT = frontal cortex; TEM = temporal cortex; PAR = parietal cortex; OCC = occipital cortex.
The 11C-GR103545 BP values derived in this study are consistent with expectations derived from the literature. For example, the Bmax of κ-OR in human cortex is approximately 50 fmol/mg (cingulate gyrus, 68 fmol/mg; inferior, medial, and superior temporal gyri, 50 fmol/mg; superior parietal cortex, 35 fmol/mg; inferior, medial, and superior frontal gyri, 51 fmol/mg) (4). Taking these literature Bmax values, the mean values of 11C-GR103545 BP in the corresponding regions in our study (cingulate cortex, 7.2 mL/g; temporal cortex, 4.4 mL/g; parietal cortex, 3.7 mL/g; frontal cortex, 4.8 mL/g; Table 3), and the f1 value of 24%, the equation BP = f1 × Bmax/KD estimates in vivo KD values from each of the 4 regions. The estimated KD values derived from cingulate cortex, temporal cortex, parietal cortex, and frontal cortex are 2.3, 2.3, 2.55, and 2.7 nmol/L, respectively, giving a mean 11C-GR103545 KD value of 2.5 nmol/L in vivo in the baboon. This value is relatively consistent with the in vitro values: racemic GR89696 displaces 3H-bremazocine binding with a Ki of 2.3 nmol/L in the guinea pig (32) and 1.15 nmol/L in the rhesus monkey (33). Experiments conducted at low specific activities would be required to formally derive the in vivo KD of 11C-GR103545. These experiments were not conducted, because of concerns about the potent κ-OR agonist effect of the compound.
The specific-to-nonspecific partition coefficient at equilibrium, V3″, is an important parameter in the initial evaluation of a potential radiotracer, as it provides a measure of the signal-to-noise ratio associated with derivation of receptor parameters. Generally, V3″ equal to or greater than 0.5 is desirable for reliable quantification (38). 11C-GR103545 achieved a V3″ higher than 0.5 in all regions examined, with the exception of brain stem and occipital cortex, where the density of κ-OR may be too low to be measured reliably with this tracer. The improvement in V3″ achieved by using the pure active enantiomer rather than the racemic mixture was significant. For 11C-GR89696, V3″ values were low or moderate across regions, with only the cingulate cortex and striatum being much above 0.5 and the highest value (cingulate cortex) not exceeding 1.0 (Table 4). Thus, compared with 11C-GR89696, 11C-GR103545 provided an enhanced signal-to-noise ratio that should significantly improve the reliability of the measurements.
CONCLUSION
11C-GR103545 was shown to be a promising radioligand for imaging κ-OR with PET. The rate of metabolism was moderate and the free fraction was relatively high, both of which are important factors for the measurement of input function. Brain uptake displayed appropriate kinetics, with significant washout observed within the time frame of the PET experiment. Brain uptake was significantly reduced under blocking conditions. Regional VT values could be derived with appropriate confidence using a 2-tissue-compartment model. The use of VT CER as an estimate of the nondisplaceable distribution volume was validated. The magnitude and regional distribution of BP were consistent with expectations from the literature. V3″ values were predictive of reliable quantification in most ROIs. Thus, 11C-GR103545 satisfies several important criteria for further development and evaluation in humans.
Acknowledgments
The authors thank Harry Acosta, Mohammed Ali, John Castrillon, Elizabeth Hackett, Van Phan, Nurat Quadri, and Lyudmilla Savenkova for their excellent technical assistance. This study was supported by the Public Health Service (1 R21MH/DA66505-01, 1-K02-MH01603-01) and the Lieber Center for Schizophrenia Research at Columbia University.
Footnotes
Received May 18, 2004; revision accepted Aug. 12, 2004.
For correspondence or reprints contact: Peter S. Talbot, MD, Division of Functional Brain Mapping, New York State Psychiatric Institute, Unit 31, 1051 Riverside Dr., New York, NY 10032.
E-mail: pst2001{at}columbia.edu
REFERENCES
In this issue


Jump to section
Related Articles
Cited By...
- Mapping Kappa Opioid Receptor Binding in Titi Monkeys with 11C-GR103545 PET
- Development and In Vivo Evaluation of a {kappa}-Opioid Receptor Agonist as a PET Radiotracer with Superior Imaging Characteristics
- Novel 18F-Labeled {kappa}-Opioid Receptor Antagonist as PET Radiotracer: Synthesis and In Vivo Evaluation of 18F-LY2459989 in Nonhuman Primates
- Test-Retest Reproducibility of Binding Parameters in Humans with 11C-LY2795050, an Antagonist PET Radiotracer for the {kappa} Opioid Receptor
- An Improved Antagonist Radiotracer for the {kappa}-Opioid Receptor: Synthesis and Characterization of 11C-LY2459989
- Determination of the In Vivo Selectivity of a New {kappa}-Opioid Receptor Antagonist PET Tracer 11C-LY2795050 in the Rhesus Monkey
- Determination of In Vivo Bmax and Kd for 11C-GR103545, an Agonist PET Tracer for {kappa}-Opioid Receptors: A Study in Nonhuman Primates
- Synthesis and Evaluation of 11C-LY2795050 as a {kappa}-Opioid Receptor Antagonist Radiotracer for PET Imaging
- Pharmacological Characterization of 2-Methyl-N-((2'-(pyrrolidin-1-ylsulfonyl)biphenyl-4-yl)methyl)propan-1-amine (PF-04455242), a High-Affinity Antagonist Selective for {kappa}-Opioid Receptors
- Radioligands for Brain Imaging of the {kappa}-Opioid System