


Abstract
Correction of scatter and attenuation is essential for quantitative SPECT. In this work, we evaluated the accuracy gained from a method of transmission-dependent convolution subtraction (TDCS) in the quantitation of activity that is highly concentrated in the striatum (STR). Methods: SPECT data were acquired from an 123I-containing phantom with a constant activity in the STR but differing background (BKG) activities, so as to simulate various STR/BKG ratios (19.7:1, 9.7:1, 4.8:1, 1.9:1, and 1:1). In a study of healthy humans (n = 6), a transmission scan followed by an emission scan was performed 24 h after injection of 123I-2β-carbomethoxy-3β-(4-iodophenyl)-tropane (123I-β-CIT). All SPECT data was reconstructed with ordered-subset expectation maximization. TDCS was applied for scatter correction. Values of activity in the STR and occipital lobe (for BKG) were used to calculate binding potential V3″ (= [STR - BKG]/BKG). The effect of SPECT collimator dependency on scatter correction was also evaluated for 6 collimators from 3 different SPECT cameras in the phantom experiment. Results: Scatter correction in the phantom experiment increased the measured values of STR activity (36.2%), resulting in a substantial increase in V3″ (66.1%). Scatter and attenuation corrections with recovery correction showed an overall bias of −7.3% for the STR, −4.0% for BKG activity, and −7.8% for V3″. TDCS corrections of phantom activities were relatively uniform for the 6 different collimators, with variabilities of <5.5% for the STR and <3.0% for BKG activities. TDCS correction of human 123I-β-CIT images was of a similar, although slightly larger, magnitude than for the phantom data, with increased V3″ values of 9.4 ± 2.3 and 4.9 ± 0.6, with and without scatter correction, respectively. Conclusion: The TDSC method significantly improved the accuracy of SPECT images with a nonuniform distribution of activity highly concentrated in central regions. The value of V3″ was significantly increased in phantom and human data, with most of the improvement derived from an increase in STR activity. This scatter correction method was approximately equally useful with data from the 6 different collimators and is recommended for more accurate quantitation of nonuniformly distributed brain activities.
- SPECT
- 123I-2β-carbomethoxy-3β-(4-iodophenyl)-tropane
- scatter correction
- attenuation correction
- binding potential
A useful tool for the in vivo noninvasive evaluation of physiologic functions and pathophysiologic activity in neuropsychiatric disorders is SPECT. For example, SPECT imaging of the dopamine transporter has been shown to provide diagnostic information in Parkinson’s disease, is a useful biomarker of disease progression, and has been approved for clinical use (1–10).
123I-2β-Carbomethoxy-3β-(4-iodophenyl)-tropane (123I-β-CIT) is a potent cocaine analog for the dopamine transporter in striatum (STR) and for the serotonin transporter in hypothalamus and brain stem (2–4). Owing to its property of high uptake in STR regions, 123I-β-CIT has been used in many studies for the qualitative and quantitative evaluation of neuropsychiatric diseases (5–10).
Quantitation of such SPECT dopamine transporter images is typically calculated as (STR - BKG)/BKG (where BKG is background), which is identical to the image contrast between the STR and BKG regions. This measure of binding potential (V3″) is simple and noninvasive and has been used with SPECT tracers such as 123I-β-CIT (5,9). Thus, quantitation of V3″ requires accurate measurement of activities in both STR and BKG regions of the brain.
The accurate compensation of scatter and attenuation in SPECT is a prerequisite for quantitative image analysis. To date, many studies on quantitative brain SPECT using corrections for both scatter and attenuation have been presented (11–20).
Among these, some have shown the importance of scatter and attenuation compensation in brain SPECT using 123I for the quantitation and visualization of functional parameters (17–20). Rajeevan et al. (17) have shown that a nonuniform attenuation correction can improve the accuracy of the measurement of activity in the STR and BKG and provides a better quantitation of V3″ in a 123I-β-CIT SPECT study. In a study on patients and phantoms using 123I-β-CIT SPECT, Hashimoto et al. (18) demonstrated that scatter correction can increase the value of V3″. Although they have shown the necessity of a correction of attenuation and scatter in the evaluation of V3″ with 123I-β-CIT SPECT, the contribution of the scatter component in each of the target (STR) and BKG regions has not been studied so far.
Recently, Ito et al. (19) and Iida et al. (20) showed that scatter correction by the transmission-dependent convolution subtraction (TDCS) method improved the quantitative accuracy of the measurement of regional cerebral blood flow (rCBF) in an 123I-iodoamphetamine (123I-IMP) SPECT study, which was compared with the true value of rCBF obtained by H215O PET. Although TDCS provided enough accuracy for 123I-IMP SPECT images showing a relatively homogeneous distribution over the entire brain region, the accuracy obtained by TDCS in a nonhomogeneous tracer distribution, with a stronger activity in a local region and a lower activity in the BKG, has not been well examined yet.
Using an image with activity highly concentrated in the central STR region, we evaluated the accuracy resulting from TDCS in a SPECT study and investigated the contribution of scatter and attenuation to quantitative brain SPECT studies using dopaminergic radioligands.
MATERIALS AND METHODS
STR Brain Phantom and Human Subjects
We used a STR brain phantom (RS-900T; Radiology Support Devices Inc., Long Beach, CA), which included the left and the right striata, the brain shell, and the skull bone. Several emission datasets of the phantom were acquired to simulate various STR/BKG activity ratios.
Six healthy human control subjects (5 males, 1 female; mean age, 40.0 ± 6.2 y [these and subsequent data expressed as mean ± SD]) participated in the SPECT acquisition with the injection of 123I-β-CIT. All subjects gave written informed consent after they received a complete explanation of the risks of the study. The subjects received 0.6 g of potassium iodide (saturated solution of KI) before administration of 123I-β-CIT.
SPECT Study
SPECT scans were performed using a 3-head gamma camera (Prism 3000XP; Philips Medical Systems, Cleveland, OH) with a fanbeam low-energy, high-resolution collimator and the acquisition parameters of 120 projection angles over 360° and a radius of rotation of 160 mm. The symmetric primary energy window of 123I was set to 159 keV ± 10% for emission acquisition.
For phantom data acquisition, we obtained several emission data with different BKG activities but the same activity in both STR structures. The STR structures were filled with an 123I solution (168 kBq/mL), and 30-min emission data were acquired sequentially with increasing activity in the BKG cavity to achieve several STR/BKG ratios (zero BKG, 19.7:1, 9.7:1, 4.8:1, 1.9:1, and 1:1). A blank scan (5 min) and the transmission scan (15 min) using a 57Co line source (peak energy, 122 keV) were acquired before the emission scans. The emission data for a single structure and both structures of the STR in air were also acquired before measuring STR emission with zero BKG to obtain the resolution recovery coefficient. In all data acquisitions, the activities of the 123I solutions in STR and BKG structures were measured with a well counter (model 1282 Compugamma CS; Wallac Oy, Turku, Finland).
In the human study, the transmission (15 min) and emission (24 min) data were acquired at 24 h after injection of 123I-β-CIT (224 ± 3.4 MBq).
Attenuation Map Generation
The transmission scan was performed using the same equipment as described (17). Because of the acquisition protocol, the emission source was present in all human subjects and the phantom before the transmission scans. The transmission acquisitions performed with the 57Co primary window (122 keV ± 7.5%) caused a small contamination of 123I emission photons in the transmission data of head 3 by photons emitted from 123I. To remove this contamination in the transmission, the 123I emission photons detected in the 57Co window for head 1 and head 2 were averaged and smoothed using a gaussian filter (kernel size, 9 pixels) to reduce noise that may cause an additional error in the central region of the brain in transmission reconstruction and then were subtracted from the transmission projection of head 3.
The contamination-corrected transmission projection of head 3 was normalized by blank projection, smoothed again with the gaussian filter (kernel size, 3 pixels) to obtain less noisy transmission data, and reconstructed using the ordered-subset expectation maximization (OSEM) algorithm (21) to generate the attenuation map of narrow μ for 57Co. The attenuation map for 57Co was converted to that of narrow μ for 99mTc by multiplying it with a scaling factor of 0.962 (= 0.155/0.161) and then scaled again by a factor of 0.960 (20) to provide values appropriate for the 123I photon energy from a 99mTc transmission source. Narrow μ can be applied to compensate attenuation of photon for narrow-beam geometry, which allows, in theory, the detection of only primary photons (22). In practice, however, a general SPECT system has broad-beam geometry, because the collimator has an acceptance angle that allows the acquisition of not only the primary photons but also Compton-scattered photons. Therefore, the use of narrow μ without scatter correction overcompensates for photon absorption with a buildup factor caused by the broad-beam condition. To prevent this overcompensation, the attenuation map of broad μ for reconstruction without the scatter correction was obtained by multiplying a scaling factor to the attenuation map of narrow μ for 99mTc (23). The scaling factor for converting a narrow attenuation map to a broad attenuation map was set to a value (65% of narrow μ) that yields an even horizontal profile across the transverse plane of the calibration phantom and minimizes the difference between the mean values in the central area of the emission images reconstructed with or without scatter correction. The attenuation maps of narrow and broad μ for 99mTc were used in the reconstruction procedures with or without scatter correction because neither the scatter-uncorrected reconstruction using narrow μ nor the image without attenuation correction could provide a uniform transverse plane.
Cross-Calibration
SPECT images of the brain phantom with uniform activity in the entire intracranial cavity were used to calculate a cross-calibration factor for the relative sensitivity of the SPECT scanner and the well counter. Three acquisitions were performed on different days with a well-mixed 123I solution of uniform activity (12.6 ± 0.1 kBq/mL). The cross-calibration factor values were determined for reconstruction with or without scatter correction, but using broad μ, respectively.
Scatter Correction
For the scatter correction in both the phantom and the human studies, we used a TDCS method that is fundamentally analogous to that described in previous studies (20,24–27). TDCS is a technique for estimating the scatter component using the value of the pixel-by-pixel scatter fraction k(x,y) calculated from the transmission data. The formula to calculate the scatter fraction in TDCS was modified to include septal penetration. Scatter in the collimator due to high-energy photons (≥500 keV) emitted from 123I (22) was calculated as follows:
 Eq. 1 where A = 2.3069, B = A − 1, β = 0.2926, and ko = 0.2203 are parameters determined from the previous experiment (26). The parameter t(x,y) is an attenuation factor for pixel (x,y) derived from the transmission data. In Equation 1, ko corresponds to the septal penetration fraction and is included to account for both septal penetration and scatter in the collimator due to 123I.
Using Equation 1, the scatter-corrected projection g(x,y) can be estimated by:
 Eq. 2 where gobs(x) is the observed emission projection and ⊗ is the convolution operator. The scatter distribution function s is given as a monoexponential function. The set of TDCS parameters was the mean values determined in the previous experiment (26) with 6 commonly used collimators: LEHR (low-energy, high-resolution) and LEGP (low-energy, general-purpose) collimators of GCA 901 (Toshiba, Tokyo, Japan); LEGAP (low-energy, general all-purpose) and LEUHR (low-energy, ultra-high-resolution) collimators of Prism 3000 (Philips Medical Systems); and LEHR and VXGP (Vertex general-purpose) collimators of Vertex (ADAC Laboratories, Milpitas, CA).
Image Reconstruction
All projections from the phantom and the human subjects were rebinned into parallel projections before any further processing (20) and reduced to the matrix size of 64 × 64 pixels (pixel size = 4.14 mm) from 128 × 128 pixels (pixel size = 2.07 mm) to increase the count statistics per pixel. All emission projections were reconstructed by the OSEM algorithm with or without scatter correction. The number of iterations and subsets for reconstruction without scatter correction was set to 3 and 12, respectively. The number of 3 for iterations was the minimum condition for reconstruction with 12 subsets to provide uniform ratios between the STR and BKG of 5 STR phantom datasets. In the reconstruction with scatter correction, because scatter correction induces the change of spatial resolution (18), we tried to find the parameter to minimize the spatial resolution difference and set the number to 2 for iterations and 6 for subsets, respectively. The reconstructed resolutions were 12.1 and 12.3 mm with and without scatter correction, respectively.
Data Analysis
In the phantom study, the identical regions of interest (ROIs) were positioned over the STR (50 pixels) and BKG (188 pixels) for all reconstructed images of the brain phantom (Fig. 1). The resolution recovery coefficient (RC) to compensate the partial-volume effect (PVE) was determined from the ratio of the true to observed activities of a single STR structure in air. Using the resolution recovery coefficient, the activity of the STR and BKG were estimated as follows (28):

 Eq. 3 where ASTR and ABKG are the PVE-corrected and ASTR-obs and ABKG-obs are the observed activities of the STR and BKG, respectively.

ROIs drawn for STR and BKG in phantom (A and C) and human subject (B and D) studies. (A) Emission image. (C) Attenuation maps of phantom. (B) Slices of emission image with highest STR activity. (D) Corresponding attenuation maps for human subjects.
The value of V3″ was calculated from the equation:
 Eq. 4
Eq. 4
The activities in the STR and BKG, as well as the V3″ with scatter correction using the 6 TDCS parameter sets, were compared with each other to evaluate the dependency of scatter compensation on the collimator design in SPECT imaging with dopaminergic radioligands.
In the human images, ROIs were placed over the STR (111 pixels) and the occipital (OCC) lobe, which served as the BKG (594 pixels), from the 3 slices with the highest STR activity in each dataset (Fig. 1). The mean ROI value was used in the analysis. In the V3″ calculation, Equation 4 was used with ASTR-obs and ABKG-obs, which are the activities without PVE correction, rather than ASTR and ABKG, which are the activities with PVE correction, respectively.
RESULTS
The mean value of narrow μ values for 99mTc obtained from the brain phantom were 0.155 ± 0.001 cm−1 and 0.196 ± 0.002 cm−1 in areas of water and bone, respectively. These values were realistic because the mean value of narrow μ values in the human subjects were 0.155 ± 0.002 cm−1 in cerebral tissue and 0.197 ± 0.010 cm−1 in bone.
The activity in a single STR in air after the correction of both attenuation and scatter was not significantly changed (Δ = 0.9%) even after filling the other STR structure with an 123I solution. The resolution recovery coefficient was set to 0.577 from the activity ratio of a single STR structure in air and its true value (= 96.9/168.0 kBq/mL). This resolution recovery coefficient was applied to the entire phantom image reconstructed with or without scatter correction.
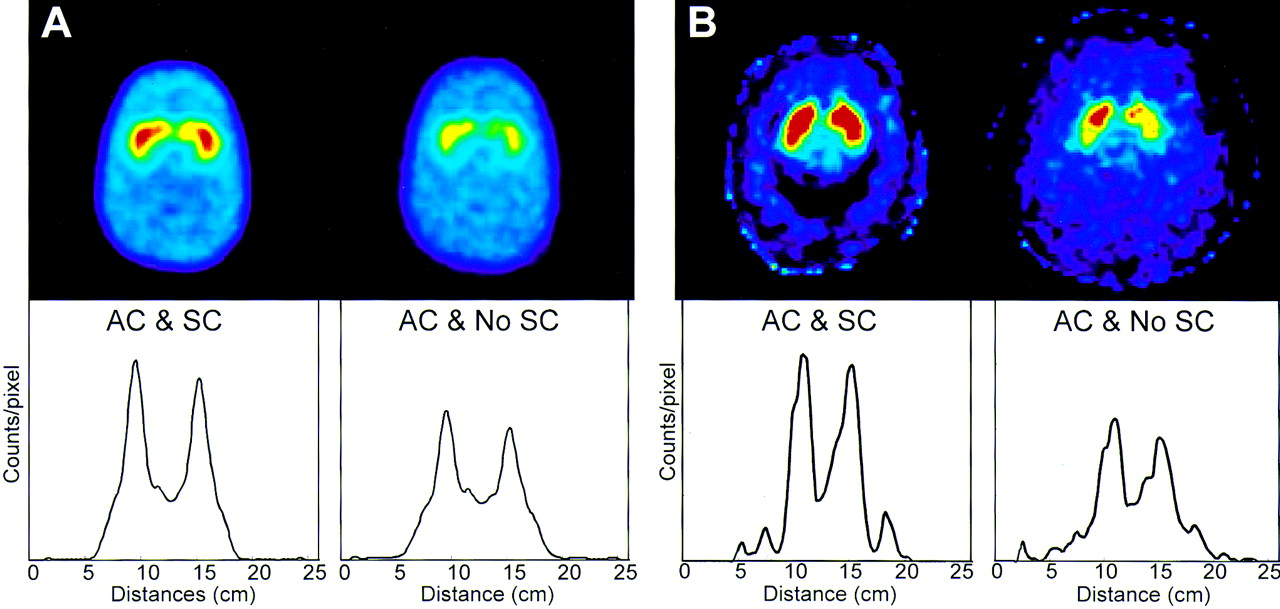
The effect of scatter compensation is displayed in Figure 2. Scatter correction improved the image quality with a more clearly defined STR shape and suppressed BKG counts in both the phantom and the human images. The profiles in the lower panels of Figure 2 demonstrate that the improved contrast between STR and BKG regions achieved with scatter correction was caused by an increase in STR counts and the decrease in BKG counts.

Typical reconstructed images (top panels) with scatter correction (SC) and without scatter correction (No SC) and corresponding transverse profiles (bottom panels) in phantom (with STR:BKG = 5:1) and human subject. In both phantom (A) and human subject (B), image contrast was improved with SC (A and B, AC & SC [AC = attenuation correction]) compared with that without SC (A and B, AC & No SC).
Activities in the STR and BKG estimated from the reconstructed images after the resolution recovery correction are summarized in Table 1. Activities in the STR and BKG with scatter correction were in good agreement with the true activities (mean bias of 7.3% ± 4.5% for the STR and 3.2% ± 2.1% for the BKG over the whole STR/BKG ratios), although the activity was slightly underestimated with the increase in total activity by the addition of BKG activity. The value of STR activity was increased significantly with the scatter correction (36.2%), whereas the value of BKG activity showed a small change after scatter correction (0.1%). The higher the STR/BKG ratio, the higher was the value of STR activity restored by scatter correction. In BKG regions, the activities measured on the images with higher STR/BKG ratios (from 5:1 to 20:1) were slightly reduced after scatter correction. However, the images with lower ratios (2:1 and 1:1) showed no actual changes in the activities before and after scatter correction.
Change of STR and BKG Activity with Attenuation and Scatter Correction in Phantom Experiment
Figure 3 illustrates the changes in V3″, with or without scatter correction and without attenuation correction, in the phantom experiment. Scatter correction resulted in an overall bias of the order of −7.8% ± 1.9% (y = 0.95x − 0.20). Without scatter correction, V3″ was underestimated by −45.2% ± 23.4% (y = 0.57x − 0.06) with attenuation correction using broad μ and by −47.5% ± 22.3% (y = 0.55x + 0.004) without attenuation correction. The higher the STR/BKG ratio, the greater was the increased level in V3″ achieved with scatter corrections.

Variation of V3″ with attenuation correction (AC) and scatter correction (SC) in phantom experiment. AC plus SC (AC & SC) increased measured V3″ values close to line of identity (dashed line), whereas AC by itself had modest effects (AC and No SC).
In the phantom study without scatter correction, V3″ values calculated using a broad and a narrow μ were almost identical (y = 1.04x − 0.03) over the entire STR/BKG ratio range (Fig. 4), although there was a slight discrepancy due to the overestimation of STR activity with a narrow μ.

Comparison of V3″ calculated using broad and narrow μ in reconstruction without scatter correction. Both values of V3″ were essentially the same and overlay line of identity (dashed line).
The differences in the activities using 6 TDCS parameter sets are shown in Figure 5. Compared with the results obtained using a mean parameter value, the activities in the STR and BKG showed only small differences when 6 different TDCS parameter sets were used (<5.5% for STR and <3.0% for BKG). Differences in STR activity were reduced with decreased STR/BKG ratios because of the addition of BKG activity, which provided improved count statistics. The maximal difference in STR activity was 9.6% between the LEUHR collimator of the Prism 3000 camera and the LEGP collimator of the GCA 901 camera. The value of BKG activity, however, showed a relatively uniform difference among the 6 collimators (<3%). The difference in V3″ between the 6 collimators was within 12%. There was no significant difference of STR and BKG activities and V3″ value when using different TDCS parameter sets (P > 0.05).

Difference in STR (A) and BKG (B) activities in phantom experiments due to various TDCS parameter sets for 6 collimators. Difference between measured and true activities is expressed as percentage of true values (x-axis).
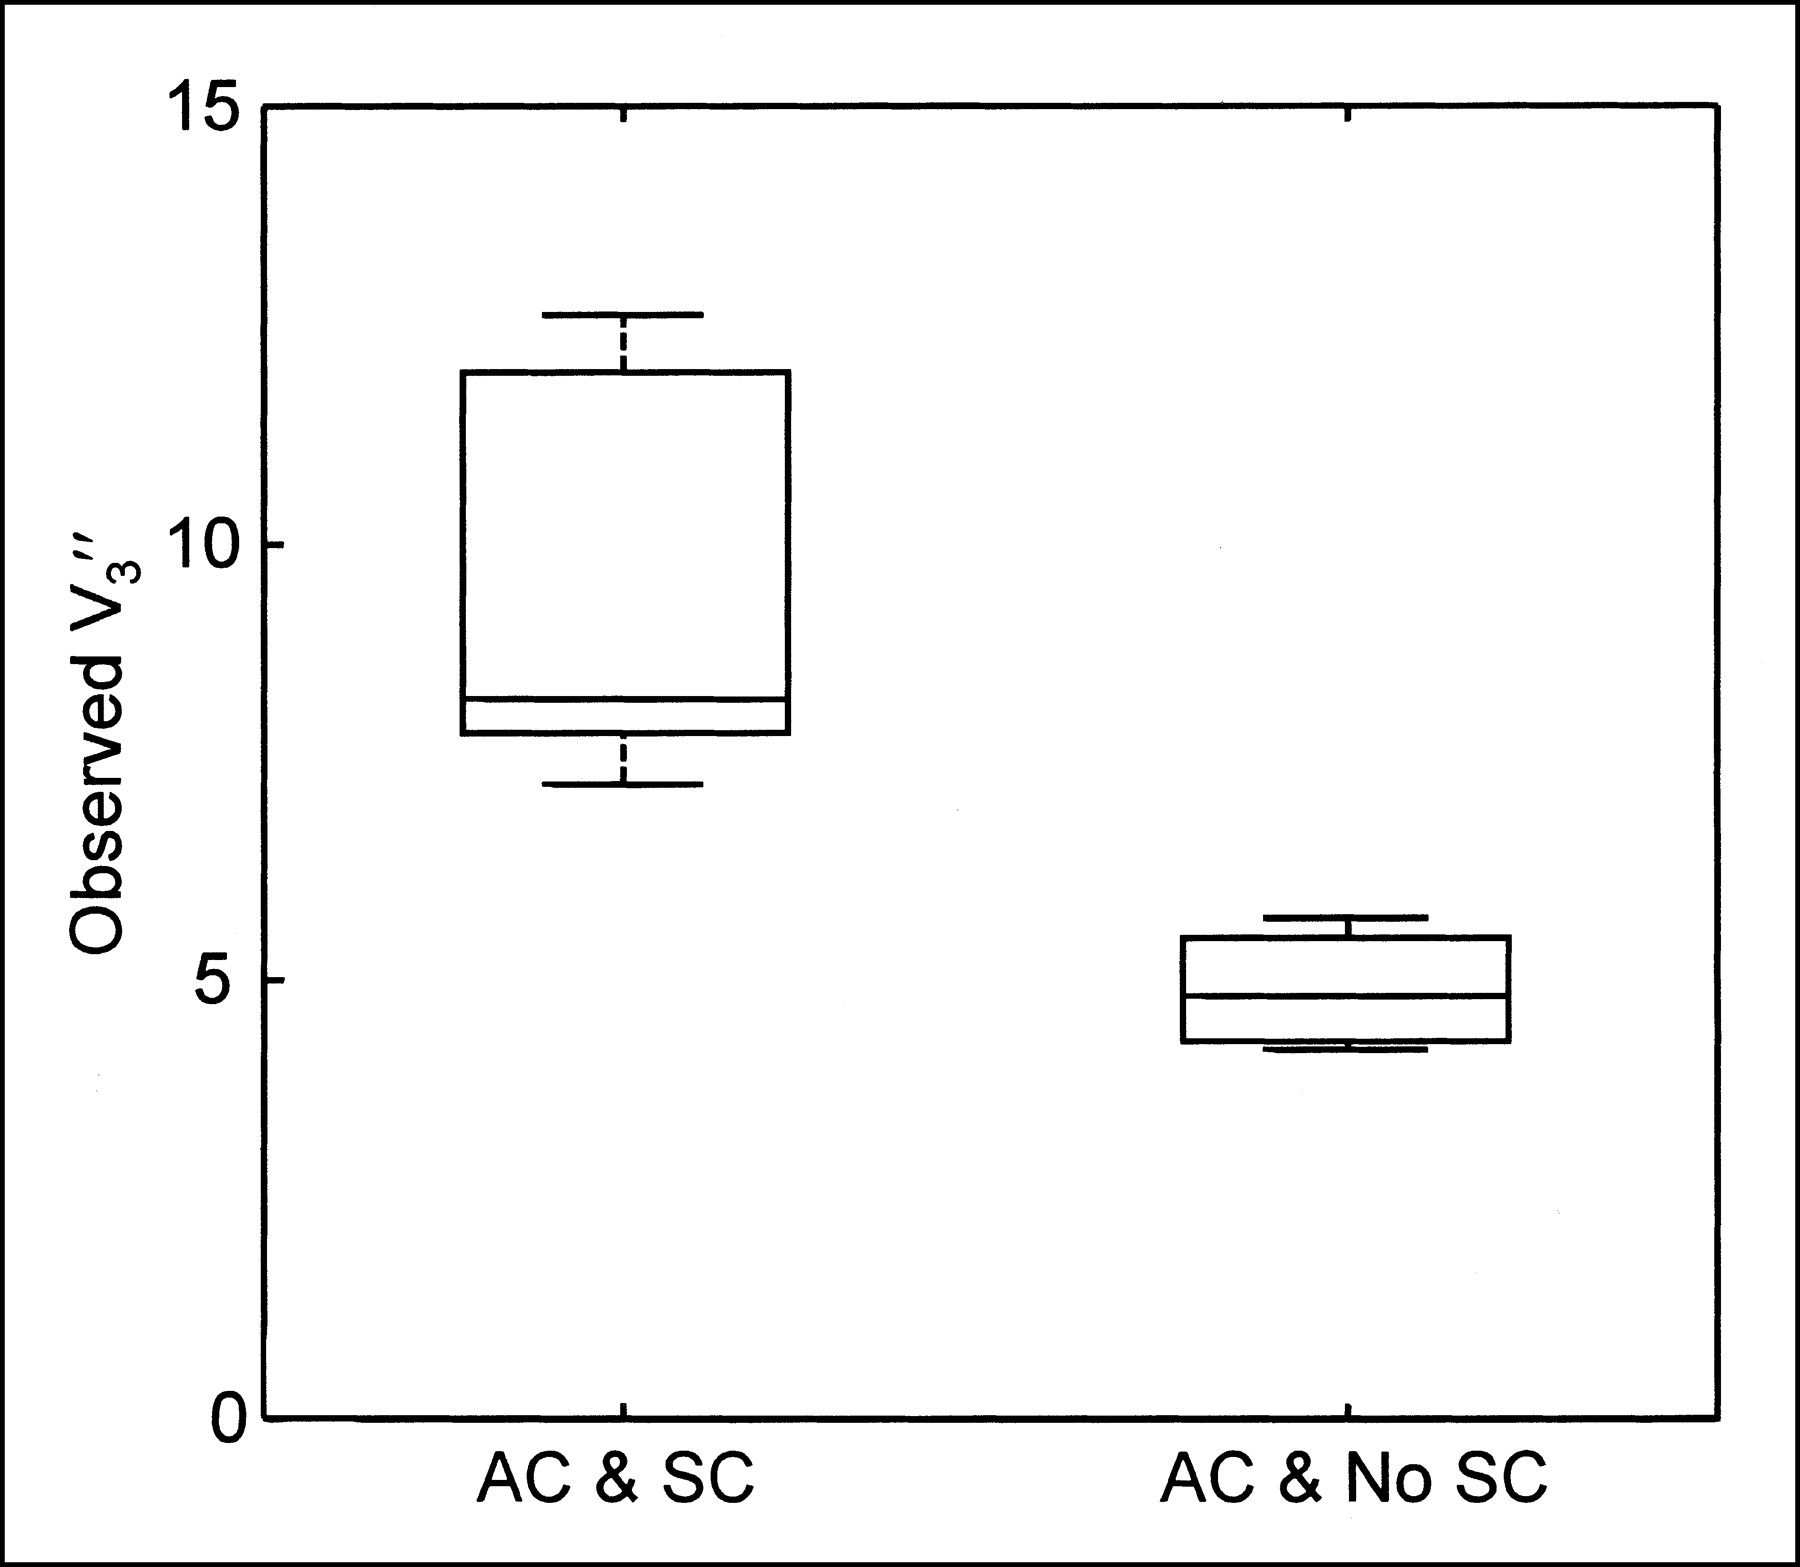
Table 2 summarizes the results obtained from the 6 human subjects. Scatter correction increased STR activities by 40.4% and decreased OCC activities by 17.8%. V3″ showed an even greater change due to scatter correction: 9.4 ± 2.3 and 4.9 ± 0.6, with and without scatter correction, respectively (Fig. 6). Thus, the increase of V3″ due to scatter correction was 90.6%.

Comparison of V3″ obtained with scatter correction (AC & SC) and without scatter correction (AC & No SC) in 6 human subjects. SC significantly increased observed V3″ values from 4.9 ± 0.6 to 9.4 ± 2.3. In these whisker plots, mean value (horizontal bar) is surrounded by box indicating 95% confidence limits.
Change of STR and OCC Lobe Activity in Image by Scatter Correction in Human Subjects
DISCUSSION
In this study, we found that (a) the TDCS method provided reasonable accuracy with a minimal error overall in the estimation of scatter components of SPECT images with high STR activities; (b) scatter correction induced a greater increase in STR activity and a smaller decrease in BKG activity, which resulted in a significant increase in V3″; and (c) the effect of different collimator designs was relatively small in the estimation of target and BKG activities.
Correction of scatter and attenuation is essential for quantitative SPECT studies. Although many brain SPECT studies with scatter correction have been reported, there have been only few studies that have investigated the effect of scatter and attenuation correction in 123I brain SPECT. 123I is a radioisotope that is widely used for labeling dopaminergic radiopharmaceutical compounds for SPECT. In contrast to 99mTc, 123I contains a small amount of high-energy photons that induces septal penetration in the SPECT collimator. For an accurate estimation of activity from SPECT images, this septal penetration of 123I should be considered together with scatter correction. Iida et al. (20) introduced a modified TDCS scatter correction method that included a term for septal penetration and demonstrated that this scatter correction method improved rCBF quantitation in 123I brain SPECT images. In this study, we used the TDCS method for scatter compensation. Iida et al. (20) also showed in their study with a blood flow tracer that scatter correction increased gray matter activity and decreased white matter activity, which improved both image contrast and the quantitative value of rCBF images. However, the impact of scatter correction has not been well studied in brain SPECT imaging with a nonhomogeneously distributed tracer such as 123I-β-CIT. Hashimoto et al. (18) showed that the image contrast between the STR and BKG of 123I-β-CIT SPECT images was increased by scatter correction because of a small decrease in the striatal counts and a greater decrease in the OCC counts. However, the contribution of scatter correction to the estimation of activity in each of the STR and BKG regions was not thoroughly addressed.
Scatter correction contributed to a significant increase in STR activity and a minor decrease in BKG activity. Accordingly, it improved the image contrast between STR and BKG regions in comparison with images reconstructed without scatter correction and using a broad μ (Table 1). With scatter correction, we obtained activity concentrations that were close to the true values in both STR and BKG regions in the phantom experiment. Reconstructed images without scatter correction severely underestimated STR activity (Table 1) and degraded image contrast (Fig. 2).
Scatter correction dramatically increased V3″ values compared with those without scatter correction, mainly because of a greater increase in STR activity. The improvement of V3″ with scatter correction increased with the STR/BKG ratio (37.2% for 5:1 and 61.2% for 20:1), which was due to different contributions of scattered activity from BKG to the STR regions. This improvement indicates that scatter correction should be used for the accurate quantitation of images with high STR/BKG ratios. Moreover, for images with low STR/BKG ratios, scatter correction should also be used for a better discrimination of small differences between V3″ values.
Attenuation correction resulted in a slight improvement of V3″ values over the entire range STR/BKG ratios (Fig. 3), which was consistent with the previous results of Rajeevan et al. (17). To estimate V3″ without scatter correction, we used the broad μ value because the scatter-uncorrected reconstruction with a narrow μ value resulted in overestimation of the central activity of the phantom, from which we could not obtain a suitable factor for cross-calibration between the well counter and the SPECT system. Furthermore, in the examination for contribution of attenuation correction in phantom experiments without scatter correction, V3″ values with a narrow μ map were not significantly different from those with a broad μ map, although there was a slight increase in V3″, which may depend on the location and the size of ROI drawn in the BKG region (Fig. 4). Therefore, we did not use the narrow μ map in the analysis of human subjects without scatter correction.
In human subjects, we also found a significant contribution of scatter correction on the estimation of STR activity and, therefore, on the determination of V3″. The increase in the value of STR activity (40.4%) with scatter correction demonstrates a good agreement with the PVE uncorrected results from the phantom experiment (39.8% and 52.3% for STR/BKG ratios of 10:1 and 20:1, respectively). The decrease in BKG activity in human subjects was greater than that in the phantom, possibly because of differences in either the uniformity of BKG activities or count statistics in both datasets (Fig. 2). The V3″ value calculated by the way it was used in this study is dependent on the BKG activity as well as the STR activity. Also, the V3″ could be more sensitive to BKG activity. Therefore, the poorer count statistics in the BKG region with scatter correction than without scatter correction gives rise to increased deviation of V3″. However, despite this deviation, the V3″ value with scatter correction was significantly increased compared with those without scatter correction.
123I is an isotope that is as frequently used as 99mTc for a radiopharmaceutical. In contrast to 99mTc, 123I has a small amount of photons with high energy (≥500 keV). In a previous study (26), we found septal penetration that cannot be ignored is induced by the high-energy photon of 123I not only in the field-of-view region but also out of the field of view, and this septal penetration could be corrected accurately by TDCS incorporating a term accounting for septal penetration. From these findings, TDCS could have an advantage of more relevant correction of the scatter component in the study with other radiopharmaceuticals that have a biodistribution of a higher amount of radioactivity in the patient’s body—such as the lungs, which are closer to the camera head—than that of 123I-β-CIT.
In the same study (26), we showed that scatter correction for 99mTc and even 123I was independent of collimator design and that the use of the mean values of the TDCS parameter sets from 6 collimators could provide sufficient scatter compensation, despite empirically small differences between the collimators. According to these results, we used the mean values of the TDCS parameter sets for scatter correction. Similar to the previous phantom experiment, in which the scatter compensation was slightly affected by the collimator design because of septal penetration of high-energy photons emitted by 123I, the activities with scatter correction in the phantom experiment also varied with different collimators (Fig. 5). However, the variation in the measured STR and BKG activities was small, and the maximum variation in the values of STR activity and V3″ was smaller than the change before and after scatter correction was performed. Therefore, in scatter correction of theses striatal images, this TDCS method can be used regardless of the commonly available collimator design.
The TDCS method provided an acceptable accuracy in the estimation of the activity concentrations in the STR and BKG. The deviation increased with the decrease in the STR/BKG ratio (Table 1). This error could be caused by the use of the mean values obtained from the TDCS parameter set and a monoexponential function in the TDCS method. Narita et al. (27) showed that a monoexponential function resulted in overestimation of the scatter component with the increase of total counts in the data. However, the combination of a gaussian and a monoexponential function as a scatter distribution function of 123I is practically not easily accessible by experiments or simulations. Therefore, further study using a more optimized scatter distribution function is needed for a more accurate estimation of scatter.
CONCLUSION
Scatter correction significantly improved both the quantitative analysis and the visual assessment of SPECT images with a nonuniform distribution of activity. In these striatal images, the contrast was increased because of a significant increase in STR activity and a modest decrease in BKG activity. With scatter correction, we obtained values for both activity and binding potential that were close to the directly measured values. Therefore, scatter correction is required for the quantitative estimation of binding potential. TDCS provides an acceptable accuracy in the estimation of the activity in the STR and BKG. Moreover, the scatter correction in 123I striatal SPECT images shows empirically minimal differences among various collimators, demonstrating that the scatter in 123I SPECT data can be estimated accurately with a single set of mean TDCS parameters.
Acknowledgments
We thank Sami Zoghbi, PhD, for expert help in the phantom experiment. This work was supported by the Japan Cardiovascular Research Foundation.
Footnotes
Received Feb. 8, 2002; revision accepted Oct. 15, 2002.
For correspondence or reprints contact: Hidehiro Iida, DSc, PhD, Department of Investigative Radiology, National Cardiovascular Center Research Institute, 5-7-1 Fujishiro-dai, Suita City, Osaka, 565-8565, Japan.
E-mail: iida{at}ri.ncvc.go.jp
REFERENCES
In this issue


Jump to section
Related Articles
Cited By...
- An Evidence-Based Review of Quantitative SPECT Imaging and Potential Clinical Applications
- Assessment of Clinical Impact in the Application of Chang Attenuation Correction to Lung Ventilation/Perfusion SPECT
- 123I-5-IA-85380 SPECT Measurement of Nicotinic Acetylcholine Receptors in Human Brain by the Constant Infusion Paradigm: Feasibility and Reproducibility