


Abstract
With antiangiogenic agents, tumor shrinkage may be absent, despite survival benefit. The present study assessed the predictive value of molecular imaging for the identification of survival benefit during antiangiogenic treatment with bevacizumab and erlotinib in patients with advanced non–small cell lung cancer. Methods: Patients were evaluated using an imaging protocol including CT, 18F-FDG PET, H215O PET, and dynamic contrast-enhanced MRI to derive measurements on tumor size, glucose metabolism, perfusion, and microvascular permeability. The percentage change in imaging parameters after 3 wk of treatment as compared with baseline was calculated and correlated with progression-free survival (PFS). Results: Forty-four patients were included, and 40 underwent CT and 18F-FDG PET at both time points. Complete datasets, containing all imaging modalities, were available for 14 patients. Bevacizumab and erlotinib treatment resulted in decreased metabolism, perfusion, and tumor size. A decrease in standardized uptake value or tumor perfusion of more than 20% at week 3 was associated with longer PFS (9.7 vs. 2.8 mo, P = 0.01, and 12.5 vs. 2.9 mo, P = 0.009, respectively). Whole-tumor Ktrans (the endothelial transfer constant) was not associated with PFS, but patients with an increase of more than 15% in the SD of tumor Ktrans values—that is, an increase in regions with low or high Ktrans values—after 3 wk had shorter PFS (2.3 vs. 7.0 mo, P = 0.008). A partial response, according to the response evaluation criteria in solid tumors (RECIST), at week 3 was also associated with prolonged PFS (4.6 vs. 2.9 mo, P = 0.017). However, 40% of patients with a partial response as their best RECIST response still had stable disease at week 3. In these cases tumor perfusion was already decreased and Ktrans heterogeneity showed no increase, indicating that the latter parameters seem to be more discriminative than RECIST at the 3-wk time point. Conclusion: PET and dynamic contrast-enhanced MRI were able to identify patients who benefit from bevacizumab and erlotinib treatment. Molecular imaging seems to allow earlier response evaluation than CT.
Response monitoring in advanced non–small cell lung cancer (NSCLC) is complex. Tumor shrinkage usually does not occur until several cycles of chemotherapy and is difficult to evaluate because of inter- and intraobserver variation (1). With targeted agents, volumetric change might not happen at all, despite survival benefit (2–5). Also, the association between response and survival is weak at best (6). Therefore, alternative criteria for response assessment are warranted. Monitoring tumor biology during therapy offers an interesting alternative and might add to size-based criteria.
PET and dynamic contrast-enhanced (DCE) MRI allow for the noninvasive quantification of aspects of tumor biology, depending on tracer characteristics (7). 18F-FDG, the most frequently and widely used tracer in the clinical setting, enables the quantification of glucose metabolism. Tumor perfusion can be measured with the short-lived PET tracer H215O (radiolabeled water), which is a freely diffusible and accurate perfusion tracer. DCE MRI uses a paramagnetic gadolinium-based contrast agent to measure tumor perfusion by a combination of microvascular flow, permeability, and surface area. Particularly DCE MRI, and to a lesser extent H215O PET, have been studied in clinical trials evaluating antiangiogenic drugs (8–10), but few included patients with NSCLC.
The drug combination used in the present study, bevacizumab and erlotinib (BE), targets the vascular network of tumors. Erlotinib inhibits the function of the epidermal growth factor receptor, and bevacizumab targets circulating vascular endothelial growth factor. Their supposed effects are a decrease in vascular permeability, microvascular density, and cell density (11,12). These effects may eventually result in tumor necrosis. This ultimate goal would result in a decrease in tumor size (measured by CT). However, antiangiogenic drug therapy often results in consolidation rather than mass regression. Despite the absence of size change, such therapy could result in decreased glucose metabolism because of lower 18F-FDG availability (by antivascular effects) or a lower metabolic rate of glucose in tumor tissue. More subtle effects on tumor perfusion and permeability can be visualized with H215O PET and DCE MRI.
The aim of the present study was to assess the predictive value of DCE MRI– and PET-derived biomarkers during antiangiogenic treatment in patients with NSCLC. The combined use of DCE MRI, H215O PET, and 18F-FDG PET in this study offers the opportunity to evaluate the individual parameters side by side.
MATERIALS AND METHODS
Study Design and Eligibility Criteria
All subjects included in a prospective multicenter phase II trial evaluating the efficacy of BE treatment in chemonaïve patients with advanced NSCLC were studied using an extensive imaging protocol including CT, DCE MRI, H215O PET, and 18F-FDG PET. Patients were included when at least 2 imaging studies (including CT) were available at baseline. The protocol was approved by the institutional medical ethics review board of each participating center. Written informed consent was obtained from all patients. Inclusion criteria were histo- or cytologically documented stage IIIB (malignant pleural effusion) or IV nonsquamous NSCLC; no prior systemic therapy; measurable disease, as defined by the response evaluation criteria in solid tumors (RECIST); and an Eastern Cooperative Oncology Group performance status of 0–2. Major exclusion criteria were evidence of the tumor invading major blood vessels; the presence of a cavitating lesion; radiotherapy within 28 d before registration; evidence of bleeding diathesis, coagulopathy, or history of grade 2 or greater hemoptysis; and brain metastasis or spinal cord compression, unless previously treated, with evidence of stable disease for at least 2 mo.
Study Treatment
Patients were treated with bevacizumab (15 mg/kg) as an intravenous infusion every 3 wk and erlotinib (150 mg orally) daily. No dose reductions were made for bevacizumab. In the case of severe side effects, the dose of erlotinib was reduced according to the label. Patients remained on treatment until disease progression, unacceptable toxicity, or patient refusal. In the case of documented tumor progression (as assessed by RECIST), patients received further treatment as per investigator decision. Study medication and imaging were discontinued in these cases.
Imaging Schedule and Parameters
Imaging with CT, DCE MRI, H215O PET, and 18F-FDG PET was performed at baseline and after 3 wk of treatment (just before bevacizumab infusion) to derive measures on tumor size, vascular permeability, perfusion, and metabolism. Additional CT scans were made every 6 wk from baseline until disease progression. Size was measured with CT and response defined by RECIST. Perfusion (F) was determined with H215O PET; glucose metabolism (metabolic rate of glucose [MRglu] and the standardized uptake value [SUV]) with 18F-FDG PET; and a combined measure of microvascular flow, permeability, and surface area (the endothelial transfer constant [Ktrans]) with DCE MRI.
Dynamic 18F-FDG and H215O PET studies were performed selectively at 1 center, whereas the other centers applied a static whole-body 18F-FDG PET protocol without perfusion measurements. CT and DCE MRI were available for all centers.
Imaging Acquisition
PET was performed with 4 scanners: 2 Siemens ECAT EXACT HR+ scanners, 1 Philips Gemini TF-64 PET/CT scanner, and 1 Siemens Biograph bismuth germanate PET/CT scanner. Dynamic scans were obtained on a single Siemens ECAT EXACT HR+ scanner and static ones on the other systems. All patients were asked to fast for 6 h before scanning. Patients received a venous injection of 18F-FDG (179–458 MBq), depending on individual patient and scanner characteristics.
Dynamic acquisition started with a 10- to 15-min transmission scan to correct for photon attenuation (13). After a bolus injection of H215O (1,100 MBq), a dynamic emission scan (in 2-dimensional acquisition mode; total duration, 10 min) was started. After an interval of 10 min to allow for decay of H215O, a bolus injection of 18F-FDG (370 MBq) was administered, and a dynamic emission scan (2-dimensional; total duration, 60 min) was started. Data were reconstructed as 128 × 128 matrices using filtered backprojection with a Hanning filter (cutoff, 0.5 cycle/pixel). For volume-of-interest (VOI) definition purposes, the last 3 frames of the 18F-FDG sinograms (45–60 min after injection) were summed. This summed frame was reconstructed using ordered-subset expectation maximization (OSEM) with 2 iterations and 16 subsets, followed by postsmoothing of the reconstructed image using a gaussian filter (5 mm in full width at half maximum) to obtain the same resolution as for the filtered backprojection images.
Static acquisition was performed with the following settings: Siemens HR+: 2-dimensional mode, 4-min emission and 3-min transmission per bed position, and OSEM reconstruction (2 iterations, 16 subsets); Philips Gemini: 3-dimensional mode, 135-s emission per bed position, and time-of-flight OSEM reconstruction using default settings; and Siemens Biograph: 3-dimensional mode, 5-min emission per bed position, and Fourier rebinning plus OSEM reconstruction (4 iterations, 8 subsets). All appropriate corrections for normalization, dead time, random coincidences, scatter, and attenuation were applied. Attenuation correction for the PET/CT systems was based on a low-dose CT scan acquired during tidal breathing and on transmission scans with rotating 68Ge rod sources for the Siemens HR+ system. All reconstructions resulted in an image resolution of 7 mm at the center of the field of view (FOV).
DCE MRI was performed on three 1.5-T clinical MRI systems: 2 Siemens Sonata systems and an Intera Philips system. All DCE MR images were acquired in a transverse plane (5 slices; slice thickness, 10 mm), with the patient using a breath-hold technique. The acquisition protocol included 5 precontrast T1-weighted (3-dimensional spoiled gradient-echo sequences) measurements with different flip angles (35°, 25°, 15°, 10°, 8°, 4°, and 2°) to determine the T1 relaxation time in the blood and tissue before contrast arrival. Next, gadolinium–diethylenetriaminepentaacetic acid (0.1 mmol/kg of body weight) (Magnevist, 0.5 mol/L; Bayer Schering Pharma) was intravenously injected (3.0 mL/s) and flushed with 15 mL of saline. This injection was followed by the DCE series, using the same sequence as the 5 precontrast T1-weighted measurements but with a flip angle of 35°, containing 30–35 scans of 2 s each. Images were acquired with the following parameters: first Siemens scanner: repetition time/echo time, 2.84/1 ms; FOV, 350 mm; and matrix, 263 × 350, and second Siemens scanner: repetition time/echo time, 2.05/0.75 ms; FOV, 350 mm; and matrix, 160 × 256. For the Philips scanner, parameters were repetition time/echo time, 4.5/2 ms; FOV, 350 mm; and matrix, 144 × 256. A fast data acquisition period (interscan interval, 2 s) was started before the bolus arrival, with the patient under breath-hold instructions to minimize motion artifacts during the first passage of the contrast agent.
Data Processing
During the study, clinicians were unaware of the imaging results, and those who analyzed the images were unaware of clinical outcome and the alternative modalities (except for appropriate FOV positioning of initial PET using the baseline CT).
PET
Patients were evaluable only when all scans were obtained on the same scanner, with a consistent protocol with respect to injected 18F-FDG dose, interval from injection to scanning, and acquisition settings (i.e., exclusion of within-patient variability) (14). Because individual medical centers used different PET scanners, only the relative change of imaging parameters was used. In this way, heterogeneity due to the use of multiple scanners was nearly eliminated (15). All images were converted to ECAT 7 format and analyzed using software developed in-house. Threshold-defined VOIs of the primary tumor (41% of the maximum pixel value, with correction for physiologic uptake in the local background) were defined semiautomatically (15,16). For dynamic scans, the 18F-FDG tumor VOIs were applied to both 18F-FDG and H215O dynamic data to generate time–activity curves. An image-derived input function was created by multiple 2-dimensional regions of interest (ROIs) manually drawn over the aortic arch and ascending aorta. Three venous blood samples were taken as a quality control for the image-derived input function (17). ROIs were then applied to all frames to generate an input time–activity curve. Full kinetic analysis to derive values of the MRglu was performed using a 3-compartment model and Patlak graphical analysis (18). For all scans, simplified semiquantitative measures were derived by calculating the mean SUV for primary tumor VOIs (50–60 min after injection for dynamic scans and 80 min after injection for static ones) and corrected for lean body mass. The correlation between simplified (SUV) and full kinetic (MRglu) analysis was explored to validate the use of SUV during this intervention (19). Mean SUV was chosen above maximum because of superior reproducibility (20) and because it allowed the validation of SUV against MRglu, which cannot be done for a single voxel.
Tumor perfusion was estimated using dynamic H215O data and a 1-tissue-compartment model, considering an arterial blood volume component, and an image-derived input function (21,22).
DCE MRI
A single central slice containing the primary tumor was selected, and an ROI was manually drawn around the whole tumor. Before an ROI was drawn, the unenhanced and enhanced images were both viewed so that nontumor tissue and large vessels were avoided. Care was taken to ensure that tumor ROIs of subsequent scans were drawn at the same anatomic position. To obtain an arterial input function in every patient, an ROI was manually drawn in a major blood vessel using 1 transverse plane in the peak arterial enhancement phase of imaging. Unfortunately, it appeared impossible to derive an adequate arterial input function in every patient, mainly because of the anatomic location of some tumors, the absence of a large vessel in the field of view, and strong inflow (signal saturation) effects. Therefore, a standardized arterial input function was used (23). All DCE MRI data were analyzed with software developed in-house. A pharmacokinetic 2-compartment bidirectional exchange model was used to determine Ktrans (24,25). Pharmacokinetic analysis was done on a pixel-per-pixel basis. Ktrans values of individual pixels were collected and tabulated in a Ktrans pixel histogram. The SD was calculated, representing the heterogeneity of tumor Ktrans distribution (Ktrans SD) (25–27). Analysis was performed after ruling out zero values of Ktrans to exclude nonperfused regions, for which the pharmacokinetic model is not valid.
Statistical Analysis
To investigate the agreement of SUV and MRglu measurements at baseline and after 3 wk of treatment, the r2 value was calculated together with the slope of the standardized values of the difference of both paired measurements. The 95% confidence interval (CI) of the slope was obtained using the adjusted bootstrap percentile method. Baseline patient characteristics were compared with ANOVA for continuous variables and with the Fisher exact and χ2 tests where appropriate for qualitative variables.
The predictive value of CT-, DCE MRI–, and PET-derived measures for PFS was assessed using the percentage change from the baseline value (Δ value). PFS was defined as the time from start of treatment to the date of first documented disease progression in terms of RECIST or the date of death. Patients who had not progressed or died at the time of analysis were censored at the date of last contact. Predefined cutoff points were used and curves were compared by log rank testing. On the basis of reproducibility data, a 20% cutoff point was used for PET (i.e., values outside 1.96 × SD) (16,28). For DCE MRI, a 40% cutoff point was used for Ktrans and 15% for Ktrans SD (10,29). Statistical analyses were performed using SPSS (version 15.0; SPSS Inc.). Results are presented with hazard ratios (HRs), including 95% CIs and P values. A P value of less than 0.05 was considered to be significant.
RESULTS
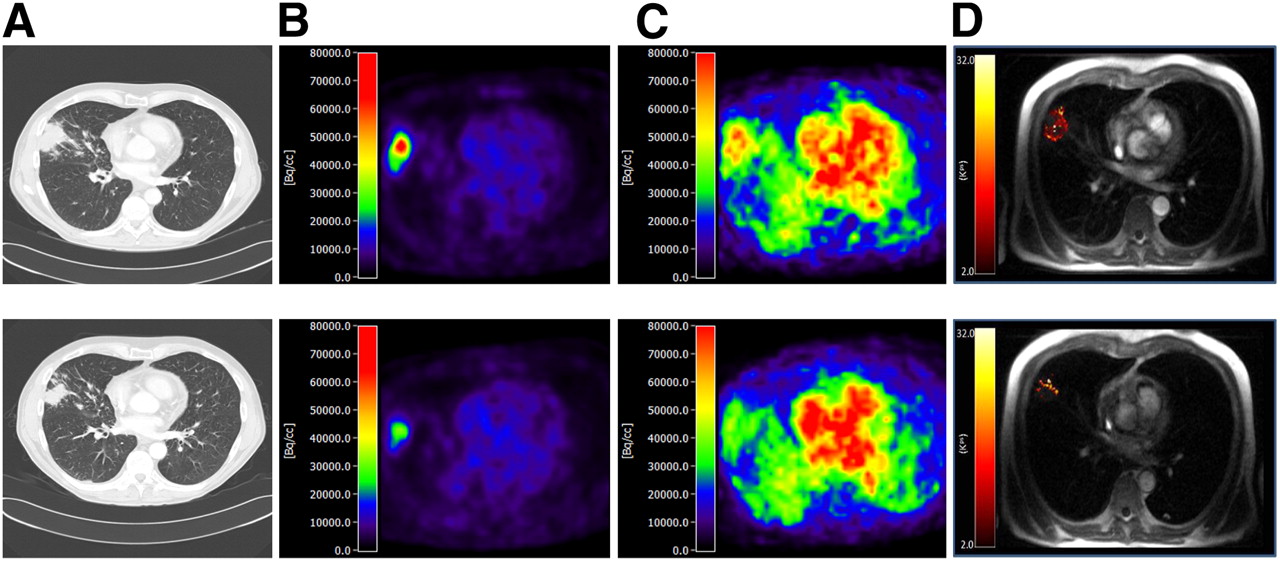
Forty-seven patients were enrolled from 3 centers in The Netherlands. One patient received thoracic radiotherapy, but this was 6 y before inclusion. Three patients were excluded because no PET and MRI scans were available, resulting in the inclusion of 44 patients (Fig. 1). Individual patient results are presented in a supplemental table. As indicated in Figure 1, complete imaging datasets were available for 14 patients, mainly because of the single-center availability of H215O PET and, to a lesser extent, technical failures of DCE MRI. At the time of analysis, 35 patients (80%) had died and 41 (93%) showed disease progression. Median follow-up was 15.6 mo. An example of an imaging profile for a patient with a response on all modalities is shown in Figure 2.

Flow chart of patients. Transparent boxes provide information on scan failure. Baseline and week 3 time points can be found in hatched boxes and shaded boxes, respectively.

Baseline (top) and week 3 (bottom) scans of patient with a response on all modalities: CT (A), 18F-FDG (B), H215O PET (C), and DCE MRI (D).
Predictive Value of CT
The mean change in the sum of diameters for all target lesions after 3 wk of treatment was a decrease of 8% (interquartile range [IQR], −22% to 4%). After 3 wk, RECIST results were as follows: complete response (CR), 0 (0%); partial response (PR), 6 (14%); stable disease, 31 (74%); and progressive disease (PD), 5 (12%). At week 6, 3 patients changed from stable disease to PR (7%) and 5 from stable disease to PD (12%). Best overall response rates at the time of analysis were CR, 1 (2%); PR, 9 (21%); stable disease, 22 (50%); and PD, 12 (27%). Forty percent of patients with PR as their best response on CT had stable disease at week 3. Patients with PR at week 3 had a median PFS of 4.6 mo as compared with 2.9 mo for all other patients (HR, 0.39; 95% CI, 0.18%–0.84%; P = 0.017) (Fig. 3A).

Kaplan–Meier curves (PFS) stratified for response after 3 wk of treatment according to CT (A), 18F-FDG PET (B), H215O PET (C), and DCE MRI (D).
PET: Validation of SUV Against MRglu
The results of 17 patients were available at both baseline and after 3 wk. At both time points, there was a strong correlation between SUV and MRglu (r2 = 0.96). The slope of the actual regression line was 0.98, with a CI (bootstrapped, n = 1,000) of 0.82%–1.05%, indicating that SUV can be safely used as an alternative for the fully quantitative Patlak-derived MRglu during BE treatment.
Predictive Value of Glucose Metabolism (18F-FDG PET)
Forty patients were scanned both at baseline and after 3 wk. Mean SUV decreased by 5% (IQR, −16% to 12%). The median PFS for patients with a metabolic response (SUV decrease > 20%) at week 3 was 9.7 mo as compared with 2.8 for other patients (HR, 0.38; 95% CI, 0.18%–0.79%; P = 0.01) (Fig. 3B). Direct comparison of 18F-FDG PET with CT was available for 40 patients. Although a response according to RECIST was predictive for longer PFS (4.6 vs. 2.9 mo), this was no longer significant (HR, 0.47; 95% CI, 0.2–1.1; P = 0.08).
All patients with PR as their best RECIST score were scanned with 18F-FDG PET, and 7 of 10 showed a significant reduction in tumor metabolism, including 2 patients with stable disease at their week 3 CT scan.
Correlation of SUV and RECIST Response at Week 3
Discrepancy was seen in both directions, but there were no patients with PD using 1 imaging modality and PR with the other. Three of 7 patients with PR using 18F-FDG PET showed stable disease at CT. Median PFS for these patients was 9.7 mo. One patient showed a PR according to RECIST and the absence of a significant metabolic response and had a PFS of 4.6 mo. Remarkably, not all patients with PR using both modalities (n = 4) performed well. Two patients had a relatively short PFS (2.7 and 3.1 mo), as compared with 12 and 14.7 mo for the other 2 patients. One had progression due to brain metastases and the other due to pleural effusion with malignant characteristics.
Predictive Value of Perfusion (H215O PET)
Tumor blood flow was measured for 19 patients both at baseline and after 3 wk. Mean blood flow decreased by 11% (IQR, −20% to −1%). Patient characteristics were not statistically different from the entire cohort (data not shown, P > 0.34). Patients with a greater than 20% decrease in tumor perfusion had a median PFS of 12.5 mo, as compared with 2.9 mo for the others (HR, 0.25; 95% CI, 0.09%–0.70%; P = 0.009) (Fig. 3C). Direct comparison of H215O PET with CT showed that patients with PR on CT had longer PFS (median, 5.8 vs. 4.1 mo), but this lost significance (HR, 0.31; 95% CI, 0.04%–2.49%; P = 0.59).
Five of 10 patients with PR as their best RECIST score were scanned with H215O PET, and all showed a significant flow reduction, including 3 patients with stable disease at their week 3 CT scan.
Predictive Value of DCE MRI
Twenty-eight patients were scanned both at baseline and after 3 wk. Mean Ktrans decreased by 17% (IQR, −55% to −7%). Patient characteristics were not statistically different from the entire cohort (data not shown, P > 0.52). Ktrans was not associated with PFS (40% cutoff point, log rank, P = 0.39). Histogram analysis of tumor Ktrans on a pixel-per-pixel basis by Ktrans SD showed that an increase of 15% in intratumor heterogeneity was predictive for treatment failure (median PFS, 2.3 vs. 7.0 mo; HR, 4.4; 95% CI, 1.5%–13.3%; P = 0.008) (Fig. 3D). Direct comparison with CT revealed that CT was not discriminative in this subset (median PFS, 4.6 vs. 4.2 mo; HR, 0.43; 95% CI, 0.16%–1.16%; P = 0.1).
Seven of 10 patients with PR as their best RECIST score were scanned with DCE MRI, and none showed an increase in Ktrans SD, including 3 patients with stable disease at their week 3 CT scan.
Correlative Studies
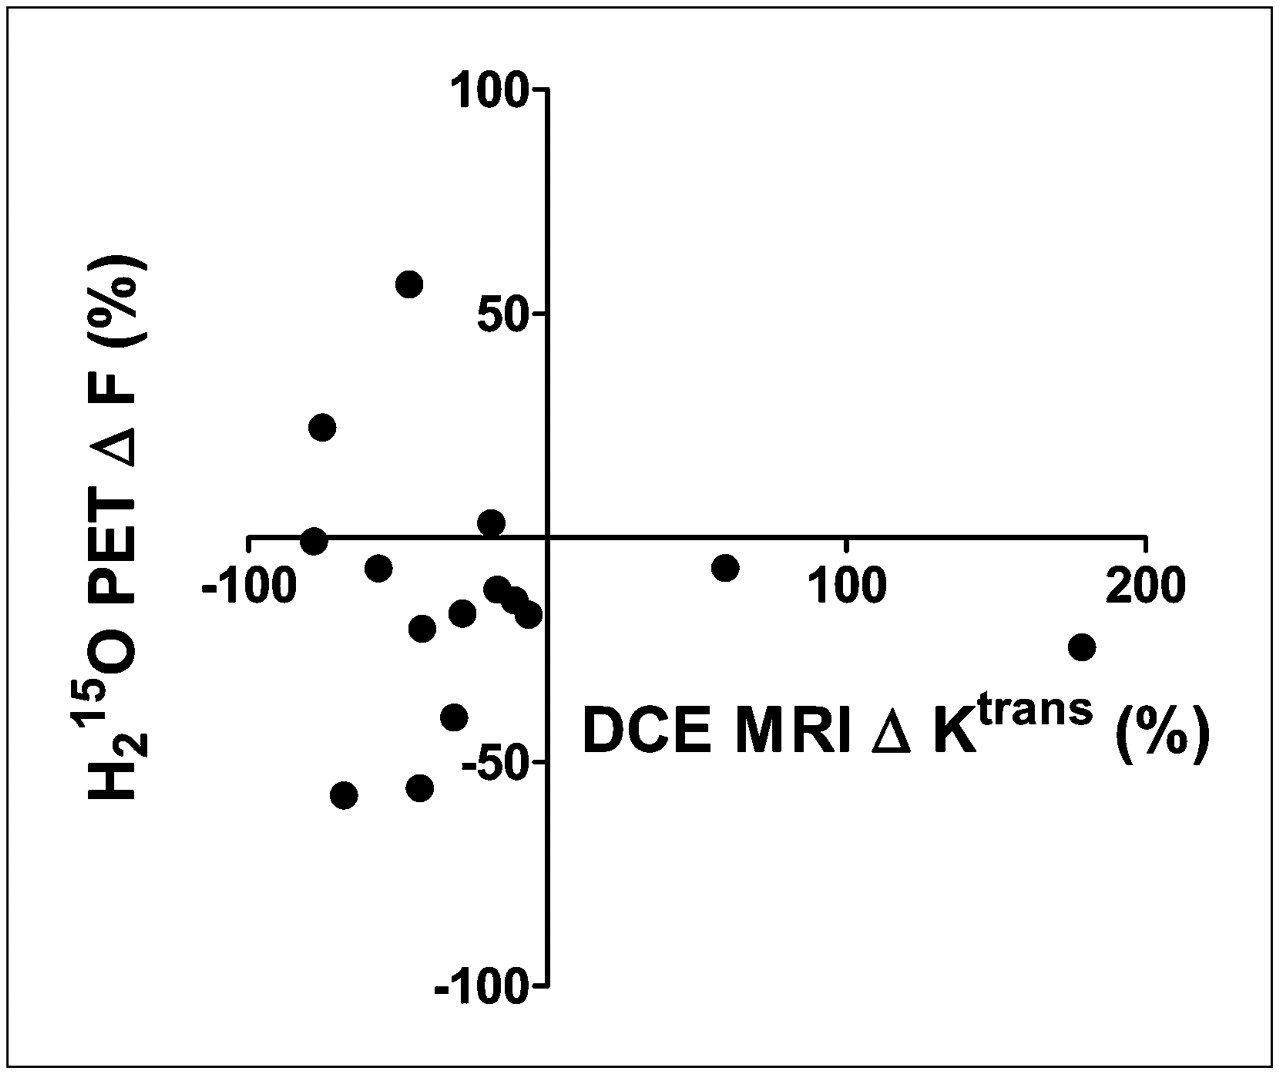
Although both Ktrans and F decreased during treatment, there was no correlation between the change in both parameters (Fig. 4). Also, tumor blood flow was not correlated to glucose metabolism at baseline and after 3 wk of treatment, although a nonsignificant trend toward a positive correlation was observed after 3 wk (Fig. 5). Three patients had a low MRglu-to-F ratio after 3 wk of treatment, of which 2 already had a low baseline MRglu-to-F ratio (Fig. 5). However, PFS for these patients was heterogeneous (range, 2.9–6.9 mo), such that no prognostic value could be attributed to this phenomenon.

Scatter plot of correlation between Δ Ktrans and Δ F.

Scatter plot of correlation between PET-derived tumor perfusion and metabolism at baseline (A) and after 3 wk of treatment (B). Three data points in B with low MRglu:F ratio are marked as triangles.
DISCUSSION
This study shows that molecular imaging allows early response evaluation and seems superior to static imaging with CT in patients with NSCLC treated with combined anti–epidermal growth factor receptor and vascular endothelial growth factor therapy. Size-based response criteria are known for their inconsistent relation with PFS (2). With targeted therapy, tumor consolidation might also represent therapeutic efficacy, resulting in prolonged survival (3–5). However, early after treatment initiation, patients with tumor consolidation form a heterogeneous group because both tumor shrinkage and growth are relatively slow processes. As a result, response and progression can be underestimated when tumor size is used as an early predictive marker. In this study, we explored molecular imaging techniques and used prospectively defined cutoff values that were based on reproducibility data. The latter allow the identification of any biologic effect due to the therapeutic intervention that is outside the area of test–retest variability.
Regardless of whether tumor size changed after 3 wk, patients with a more than 20% reduction in tumor glucose metabolism had a favorable PFS time. These data suggest that response may occur in patients with stable disease at CT and that 18F-FDG PET is able to identify these patients. We used SUV for all patients and validated it against the fully quantitative Patlak method in a subpopulation (19). The data do not show a significant effect of BE treatment on the pharmacokinetics of 18F-FDG PET, and therefore SUV can be safely used as a substitute for the more advanced Patlak method during BE treatment in NSCLC.
Today, most trials rely on size criteria (RECIST) to base decisions on whether to discontinue drug therapy. However, it can be questioned whether this approach is applicable for trials with targeted agents, looking at our and others’ results (2). Early discontinuation of ineffective therapy can prevent harmful adverse events. In addition, patients can deteriorate soon after treatment failure, depriving them of potentially beneficial second-line therapy. Therefore, there is a need for more accurate response evaluation early in the course of treatment. In our study, all imaging modalities were able to show longer PFS for responders than for nonresponders after 1 BE cycle, but head-to-head comparison favored molecular imaging.
Four of 10 patients with PR or CR as their best RECIST result had stable disease at week 3. H215O PET was performed in half these patients, and all showed a major flow reduction, irrespective of size change. DCE MRI was performed in most cases (7/10), and an increase in Ktrans SD, associated with treatment failure, was not seen. SUV decreased in all but 3 patients. One patient had a borderline-insignificant SUV decrease, whereas 2 others had a 10% decrease and relatively low baseline uptake (SUV, 2.9 and 3.0). These 2 patients had stable disease according to RECIST at week 3. Tumor perfusion, however, was strongly reduced in these patients, indicating that blood flow might be a sensitive response predictor.
Blood flow measurements were performed in a subpopulation in this study. A decrease of 20% in tumor perfusion was associated with longer PFS (Fig. 3C). Even though DCE MRI–derived Ktrans was not predictive of PFS, the pixel-by-pixel histogram analysis of tumor Ktrans suggested that the absence of an increase in intratumor Ktrans heterogeneity after 3 wk was associated with a therapy benefit. An increase in heterogeneity indicates a less even distribution of gadolinium contrast extravasation into the extravascular extracellular space, reflecting a pathologic vessel bed with areas of leaky vessels and increased perfusion and areas with severe hypoperfusion and thus absence of normalization.
The potential of combining data on perfusion and metabolism has been evaluated by Mankoff et al. (30) and Tseng et al. (31) in patients with breast cancer. They observed that glucose metabolism and perfusion exhibit a weak positive correlation at baseline, which increases after (conventional) chemotherapy. In addition, patients with high pretherapy MRglu relative to perfusion (MRglu-to-F ratio) were more likely to experience therapy resistance and relapse. We did not observe this in our dataset. A low MRglu:F ratio is caused by a tumor that has low metabolic activity or is highly vascularized. Anti–vascular endothelial growth factor treatment may result in a decrease in microvessel density, vascular permeability, and interstitial fluid pressure (32)—that is, a combination of an overall reduction in tumor perfusion and normalization of the remaining vessel bed—resulting in less hypoxia in remaining tumor tissue. Our results support this hypothesis to some extent because overall tumor blood flow and Ktrans decreased, reflecting a reduction in microvascular flow, permeability, and/or surface area. Ktrans SD showed that an increase in pathologic vessel bed was associated with worse outcome in terms of PFS. Similar results were obtained in rectal cancer 12 d after bevacizumab monotherapy (33).
Our study is the first, to our knowledge, to examine the correlation of blood flow measurement between DCE MRI and PET during targeted anticancer therapy. Although both Ktrans and F decreased during treatment, reflecting a reduction in blood flow and/or vessel permeability, no correlation was found (Fig. 4), possibly reflecting the different nature of the signals. Although F is a selective measure of blood flow, Ktrans is influenced by microvascular flow, permeability, and surface area. At baseline, the extravasation of gadolinium contrast agent is not restricted by the permeability of the numerous leaky blood vessels but is primarily flow-driven. After therapy, the extravasation of gadolinium becomes more restricted by the normalized vessel permeability and surface area. This varying pathophysiologic meaning of Ktrans at baseline and after therapy might explain the difference in Δ F and Δ Ktrans. Another explanation could be the semiquantitative nature of the DCE MRI technique due to the nonlinear relationship between the degree of signal enhancement and gadolinium concentration.
CONCLUSION
This study explored the opportunities of molecular imaging as an early response-evaluation tool. The results show that SUV, F, and Ktrans SD all predict for PFS benefit at a significant level and that these parameters seem to perform better than RECIST, whereas mean Ktrans did not. The study included relatively few patients, and few were eligible for head-to-head comparison of all techniques (only 14 patients were scanned using all imaging modalities at both baseline and after 3 wk, reflecting the intensity of the protocol). Nevertheless, these results should stimulate similar trials, in part to investigate mechanisms of action by integrating data from different imaging modalities (with PET/MRI as the logical modality, provided that such a device would not compromise the quantitative potential of either technique) and in part to explore whether molecular imaging improves patient management or go–no-go decision making in drug development.
Footnotes
↵* Contributed equally to this work.
- © 2011 by Society of Nuclear Medicine
REFERENCES
- Received for publication April 23, 2010.
- Accepted for publication September 30, 2010.


Jump to section
Related Articles
Cited By...
- 11C-Sorafenib and 15O-H2O PET for Early Evaluation of Sorafenib Therapy
- The Predictive Value of Early In-Treatment 18F-FDG PET/CT Response to Chemotherapy in Combination with Bevacizumab in Advanced Nonsquamous Non-Small Cell Lung Cancer
- Prognostic value of early response assessment using (18F)FDG-PET in patients with advanced non-small cell lung cancer treated with tyrosine-kinase inhibitors
- Transient Antiangiogenic Treatment Improves Delivery of Cytotoxic Compounds and Therapeutic Outcome in Lung Cancer
- Multifunctional Profiling of Non-Small Cell Lung Cancer Using 18F-FDG PET/CT and Volume Perfusion CT