


Abstract
The aim of this study was to investigate correlations between glucose metabolism registered by 18F-FDG PET/CT and tumor perfusion quantified by volume perfusion CT and immunohistochemical markers Ki67 and microvessel density (MVD) in patients with non–small cell lung cancer (NSCLC). Methods: Between February 2010 and April 2011, 24 consecutive patients (21 women, 3 men; mean age ± SD, 67.6 ± 6.8 y; age range, 55.6–81.3 y) with histologically proven NSCLC (14 adenocarcinoma, 9 squamous cell lung carcinoma [SCC], and 1 mixed adenocarcinoma and SCC) underwent 18F-FDG PET/CT and additional volume perfusion CT. Maximum standardized uptake value (SUVmax), mean SUV, and the metabolic tumor volume were used for 18F-FDG uptake quantification. Blood flow (BF), blood volume (BV), flow extraction product (Ktrans), and standardized perfusion value (SPV) were determined as CT perfusion parameters. Both perfusion parameters and 18F-FDG uptake values were subsequently related to the histologic subtypes, proliferation marker Ki67, MVD according to CD34 staining, and total tumor volume. Results: Mean SUV, SUVmax, and the metabolic tumor volume (mL) were 5.8, 8.7, and 32.3, respectively, in adenocarcinoma and 8.5, 12.9, and 16.8, respectively, in SCC. Mean BF (mL/100 mL/min), mean BV (mL/100 mL), and Ktrans (mL/100 mL/min) were 35.4, 7.3, and 27.8, respectively, in adenocarcinoma and 35.5, 10.0, and 27.8, respectively, in SCC. Moderate correlations were found between the 18F-FDG PET/CT parameters and Ki67 as well as between CT perfusion parameters and MVD but not vice versa. For all tumors, the following correlations were found: between SUVmax and Ki67, r = 0.762 (P = 0.017); between SUVmax and MVD, r = −0.237 (P = 0.359); between mean BF and Ki67, r = −0.127 (P = 0.626); and between mean BF and MVD, r = 0.467 (P = 0.059). Interestingly, correlations between the BF–metabolic relationship and total tumor volume were higher in SCC (r = 0.762, P = 0.017) than in adenocarcinoma (r = −0.0791, P = 0.788). Conclusion: 18F-FDG uptake correlates with Ki67, whereas BF, BV, and Ktrans correlate with MVD. Therefore, 18F-FDG uptake and perfusion parameters provide complementary functional information. An improved tumor profiling will be beneficial for both prognosis and therapy response evaluation in these tumors.
Lung cancer is the leading cause of cancer-related death worldwide. Approximately 85%–90% of all resected lung tumors are classified as non–small-cell lung carcinoma (NSCLC). The main histologic subtypes of NSCLC are squamous cell carcinoma (SCC) and adenocarcinoma. SCC exhibits a more destructive growth pattern and lower overall survival than does adenocarcinoma (1,2). Currently, advanced-stage NSCLC is considered an incurable disease for which standardized chemotherapy provides only marginal improvement in overall survival at the expense of substantial morbidity and mortality (3). However, with the advent of novel drugs primarily targeting tumor angiogenesis (e.g., vascular endothelial growth factor receptor and endothelial growth factor receptor inhibitors), a more efficient, individualized treatment of NSCLC is intended. New immunohistochemical and molecular biomarkers have been established as prognostic factors. Microvessel density (MVD) according to CD34 staining is related to poor survival and metastatis formation (4), whereas the expression of Ki67 increases with the shift from preneoplasia toward invasion (5). Currently, imaging is advancing from purely morphologic methods toward multifunctional techniques. For many years, tumor therapy response has been assessed using cross-sectional CT according to the response evaluation criteria in solid tumors. Obrzut et al. observed that information from 18F-FDG PET/CT, compared with CT alone, provided additional information aiding in the depiction of new lesions and improving therapy assessment (6).
The connection between in vivo imaging and in vitro biologic diagnosis is still being explored (7). Because of the recent developments in functional CT, we set out to address these complex pathophysiologic processes using 18F-FDG PET/CT and volume perfusion CT (VPCT). Other possible techniques for measurements of tumor vascularization include 15O-labeled water PET, dynamic contrast-enhanced (DCE) ultrasound, and DCE MRI. DCE ultrasound is not an option in the assessment of lung tumors because of the restriction to acoustic windows. DCE MRI has difficulties in quantifying perfusion, because the contrast medium applied shows a nonlinear correlation to its concentration. Cardiac motion artifacts and the need for breath-hold examinations are further disadvantages of DCE MRI versus VPCT.
We wanted to relate these results to the proliferation marker Ki67, angiogenetic biomarker MVD (according to CD34 staining), and histologic subtype. The question to be answered was whether both methods exhibited different correlations with Ki67 and MVD and were therefore complementary.
MATERIALS AND METHODS
Study Population
The local ethics committee approved our study, which comprised an additional VPCT measurement after standard 18F-FDG PET/CT staging, and all patients provided written informed consent, including information about the radiation exposure. To be eligible, patients needed to be 18 y or older and had to have a primary lung tumor. Exclusion criteria for contrast-enhanced CT were nephropathy (defined as a serum creatinine level > 150 μmol/L), known hypersensitivity to iodine-containing contrast medium, pregnancy, and untreated hyperthyroidism. Between February 2010 and April 2011, 24 patients (21 women, 3 men; mean age ± SD, 67.6 ± 6.8 y; age range, 55.6–81.3 y) were enrolled. All patients underwent 18F-FDG PET/CT and CT perfusion imaging, with a mean interval of 11.5 ± 10.5 d (range, 0–35 d). Histologic subtypes included 14 adenocarcinoma, 9 SCC, and 1 mixed adenocarcinoma and SCC.
18F-FDG PET/CT
Patients fasted overnight for at least 12 h. Patients with diabetes or a fasting blood glucose level above 120 mg/dL were excluded. All patients underwent PET/CT measurements on the Hi-Rez Biograph 16 (Siemens Medical Solutions), consisting of a high-resolution 3-dimensional (3D) lutetium oxyorthosilicate PET component and a 16-row multidetector CT component. A mean dose of 339.6 ± 23.2 MBq of 18F-FDG was injected. The patients underwent a standard PET/CT protocol, with a whole-body scan from the skull base to the mid thigh level. PET/CT data acquisition always started with a contrast-enhanced CT scan after administration of 100–120 mL of iopromide (Ultravist 370; Bayer HealthCare Pharmaceuticals Inc.). CT included first an arterial phase scan (120 kV, 180 mAs, 0.8-mm section collimation, 0.5-s rotation time, and 5-mm reconstructed slice thickness; scan region, skull base to upper abdomen), followed by a portal venous phase scan (120 kV, 200 mAs, 1.5-mm section collimation, 0.5-s rotation time, and 5-mm reconstructed slice thickness; scan region, upper abdomen to mid thigh level). In addition, a scan of the lung was obtained in inspiration for better delineation of the lung parenchyma (120 kV, 120 mAs, 0.8-mm section collimation, 0.5-s rotation time, and 3-mm reconstructed slice thickness). PET started 58.0 ± 3.4 min after radiotracer injection, with 3 min per bed position. PET data were subsequently reconstructed into transaxial slices (matrix size, 128 × 128; voxel size, 1.78 mm; corresponding to a transaxial field of view of 45.5 × 45.5 cm) using the manufacturer-provided standard software (Fourier rebinning and a 2-dimensional ordered-subset expectation maximization algorithm with 4 iterations and 8 subsets) and a gaussian filter of 4 mm. A separate low-dose CT scan was used for attenuation correction (120 kV, 30 mAs, 1.5-mm section collimation, and 0.5-s rotation time).
Quantitative 18F-FDG PET/CT Analysis
The metabolic tumor volume (mL) was defined as 3D isocontour volumes of interest (VOIs) encompassing the whole tumor with a 50% threshold value in the PET images using syngo TrueD (Siemens Healthcare). Mean at a 50% threshold and maximum standardized uptake values (SUVmean (50%) and SUVmax, respectively) and the metabolic tumor volume were recorded. To also take necrosis and areas with low metabolic activity into account, a 3D freeform VOI (SUVmean (free)), exactly encompassing the tumor, and a manually drawn ellipsoid VOI (mean SUV with ellipsoid VOI [SUVmean (ellipsoid)]) were defined. Additionally, total tumor volume (cm3) was measured on the CT scans using syngo Oncology (Siemens Healthcare).
CT Perfusion Imaging
The CT protocol consisted of an unenhanced low-dose chest CT scan, followed by a 6.9-cm z-axis coverage chest VPCT scan using an adaptive spiral scanning technique. All examinations were performed on a 128-row CT scanner (Somatom Definition AS+; Siemens Healthcare). Subsequently, the scan range was planned for coverage of the most prominent lesion. The following perfusion parameters were applied: 80 kV, 60 mAs for patients less than 70 kg and 80 mAs for patients 70 kg or more, and 128 × 0.6 mm collimation, with a total of 22 scans. The total VPCT scanning time was 40 s. During perfusion scanning, patients were asked to resume shallow breathing for the entire duration of the study. A volume of 50 mL of iopromide at a flow rate of 5 mL/s was injected in an antecubital vein through an 18-gauge needle (Vasofix; B. Braun Melsungen AG), followed by a flush of 50 mL of NaCl at 5 mL/s and a start delay of 4 s. Contrast material was administered using a dual-head pump injector (Medtron). One set of axial images with a slice thickness of 3 mm for perfusion analysis was reconstructed without overlap, using a medium smooth-tissue convolution kernel (B10f). All images were then made anonymous and transferred to an external workstation (Multi-Modality Workplace; Siemens) for further analysis.
The estimated effective dose was 3.5 mSv for men and 6.5 mSv for women (8).
Quantitative CT Perfusion Analysis
Data evaluation was performed with the software syngo Volume Perfusion CT Body (Siemens Healthcare). After automatic application of motion correction and noise reduction of the datasets, the software generated 3D color-coded maps of the following perfusion parameters: blood flow (BF; mL/100 mL/min), blood volume (BV; mL/100 mL), and flow extraction product (Ktrans) (mL/100 mL/min). BF was calculated from the initial upslope section of the tissue time–attenuation curves using the maximum slope method (9), with c(t) being the voxel enhancement and cA(t) the arterial input function. BV and Ktrans were determined using a delay-corrected modified Patlak approach (10):
This approach can also be derived from the 2-compartment Tofts model, with the additional assumption that the back flux of contrast material from the extra- into the intravascular space is negligible for the first 1–2 min.
Bones and other hyperdense structures were excluded with a segmentation based on Hounsfield unit values. For the arterial input function, a region of interest was placed inside the thoracic aorta. A VOI was drawn manually around the tumor in all 3 planes on the maximum-intensity-projection image sets with knowledge of the 18F-FDG PET/CT data. Care was taken to exclude adjacent soft tissues (e.g., chest wall or mediastinal structures). Mean values of the whole-tumor VOI were recorded for statistical analysis. Additionally, VOIs for areas with maximal BF (mL/100 mL/min) and maximal BV (mL/100 mL) were defined.
According to Miles et al. (11), the standardized perfusion values (SPVs) were calculated using the following equation:
To measure the calibration correction factor, a lung phantom was scanned with the same CT perfusion parameters, and a factor of 41.46 Hounsfield units/mg/mL was determined.
Additionally, total tumor volume (cm3) was measured on the CT scans using syngo Oncology (Siemens Healthcare).
Pathology Specimen and Immunohistochemistry
Tumors resected by thoracotomy or biopsies were used as pathologic specimens. Formalin-fixed, paraffin-embedded specimens were cut in 4-μm slices and affixed to glass slides. The slides were stained with hematoxylin and eosin. Eighteen of 24 specimens were then stained with immunohistochemicals to detect the expressions of Ki67 (Mib1, clone: Mib1 (8), isotope: IgG1 κ, 1:200; DakoCytomation) and CD34 (CD 34, clone: QBEnd-10, isotope: IgG1 κ, 1:50; DakoCytomation) using the specific corresponding antibodies. A pathologist who was masked to the clinical data and PET/CT and CT perfusion findings examined these histopathologic slides.
Analysis of Expression of Ki67 and MVD CD34
One thousand tumor cells were randomly chosen from the 10 high-power fields and evaluated at ×400 magnification. Ki67 was estimated by counting the percentage of Ki67-positive cell nuclei per 1,000 tumor cells in 10 visual fields of the tumor with the highest staining, mostly corresponding to those areas with the highest mitotic activity. The average number of CD34-positive capillaries and small venules was carefully counted in the 3 areas of maximal vascularization under ×400 magnification.
Statistical Methods
Descriptive statistics including mean and SD were calculated with SigmaPlot 11.0 (Systat Software, Inc.). Comparisons were performed using a Mann–Whitney U nonparametric (2 groups) or Kruskal–Wallis 1-way ANOVA test (>2 groups). Correlations between pairs of variables were evaluated using the Pearson product-moment coefficient. Statistical significance was assessed at a level of P less than 0.05.
RESULTS
The different parameters from 18F-FDG PET/CT and CT perfusion were classified according to the histologic subtypes: all tumors (n = 24), adenocarcinoma (n = 14), and SCC (n = 9). The first group included 1 additional patient with mixed adenocarcinoma and SCC.
18F-FDG PET/CT Parameters and Histologic Subtypes
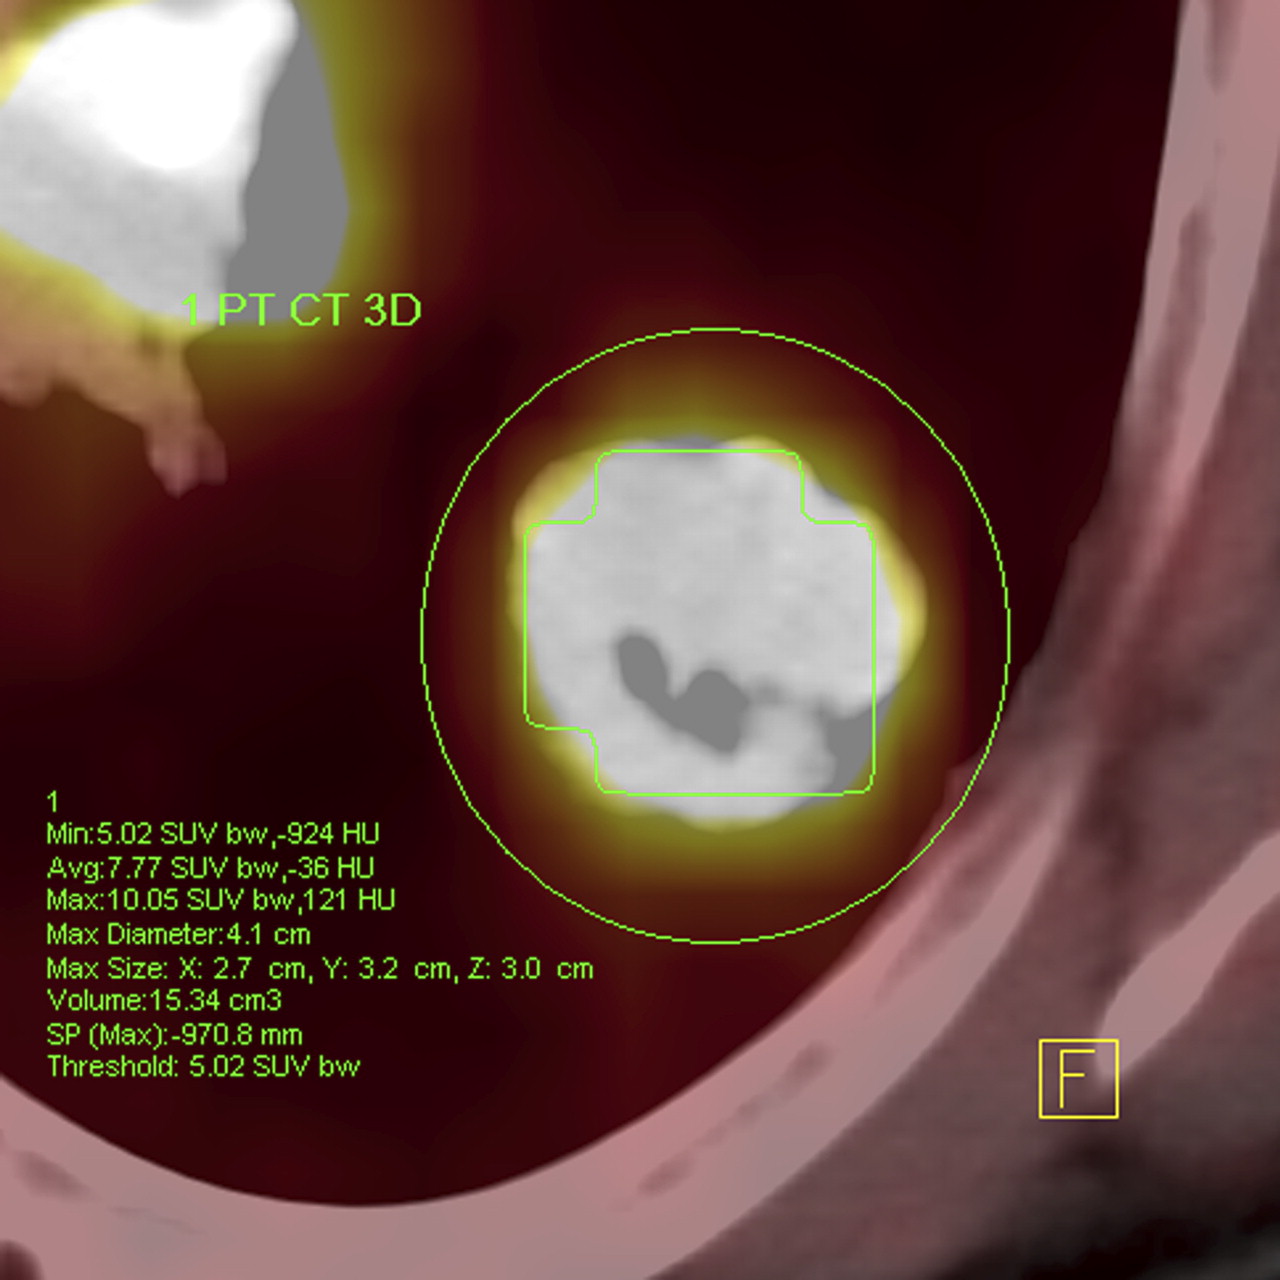
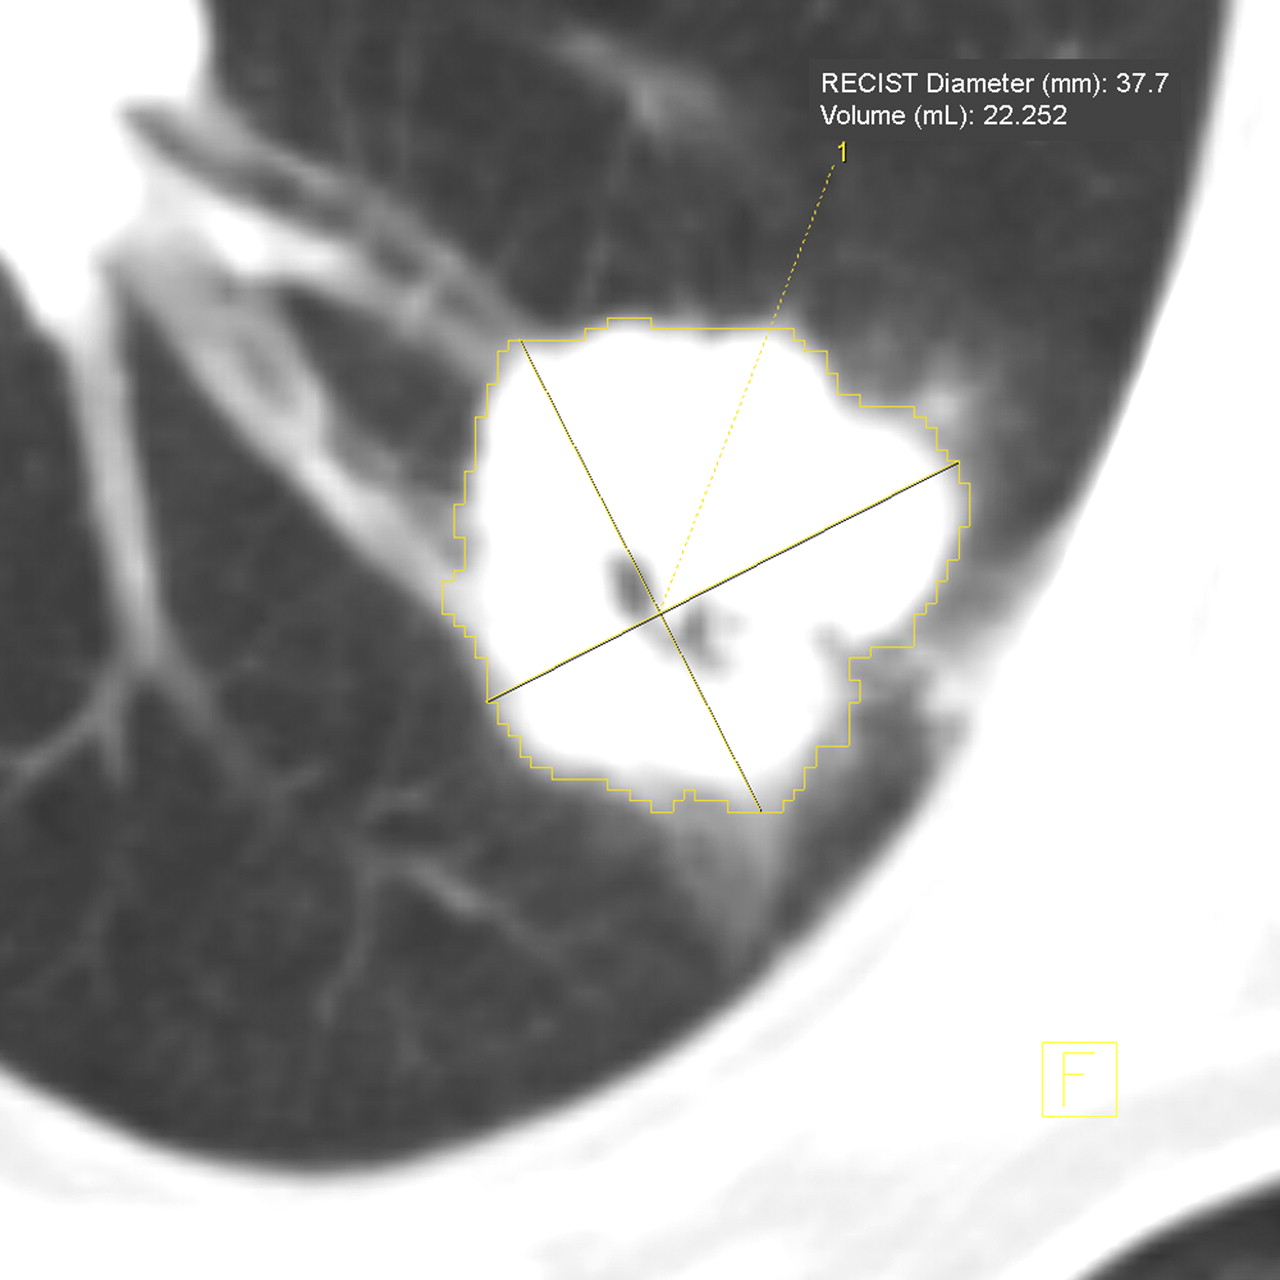
Table 1 summarizes the mean values and the SD of SUVmean (50%), SUVmean (ellipsoid), SUVmean (free), SUVmax, metabolic tumor volume (cm3; Fig. 1), and total tumor volume (cm3) for all tumors, adenocarcinoma, and SCC. The SUVmean (50%) ranged from 6.7 in the all-tumors group to 5.8 in the adenocarcinoma and 8.5 in the SCC groups. Because of the enclosure of nontumoral areas within the 3D ellipsoid, the SUVmean (ellipsoid) was lower than the SUVmean (50%)—this lower value was avoided using the SUVmean (free) measurements. Interestingly, here a significant difference between the adenocarcinoma and SCC groups was present. After the SUVmean, 12.9 SUVmax in the SCC group was higher than 8.7 SUVmax in the adenocarcinoma group. The metabolic tumor volume was smaller in the SCC group (16.8 cm2) than in the adenocarcinoma group (32.2 cm3) (Fig. 1). In contrast, total tumor volumes were 82.0 cm3 for the SCC and 66.8 cm3 for the adenocarcinoma groups (Fig. 2). The mean of the longest diameters was 46.5 ± 28.2 mm (range, 11.9–114.5 mm). No significant differences in these parameters and tumor grading were found between the adenocarcinoma and SCC groups (not shown).
18F-FDG PET/CT Parameters and Histologic Subtypes

18F-FDG PET/CT image of patient with adenocarcinoma: green VOI encompasses metabolic tumor volume with 50% isocontour. Avg = average; bw = body weight; HU = Hounsfield unit; max = maximum; min = minimum.

CT scan of patient with adenocarcinoma: yellow VOI encompasses total tumor volume. RECIST = response evaluation criteria in solid tumors.
CT Perfusion Parameters and Histologic Subtypes
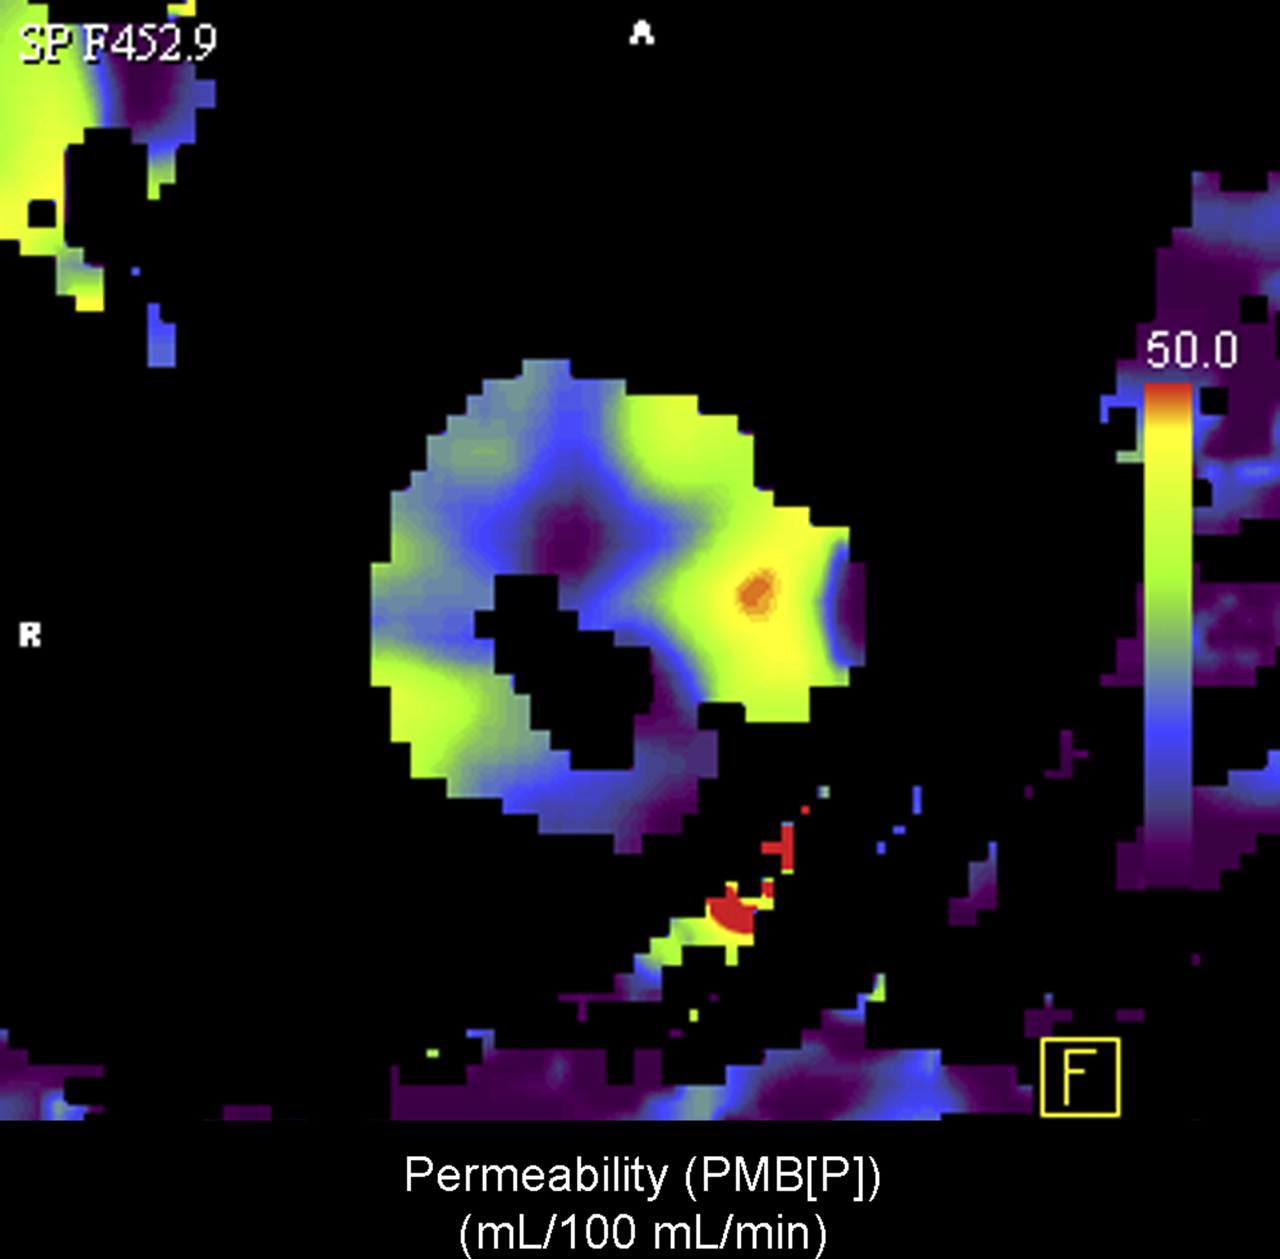
Table 2 comprises the mean values and the SD of BF (mL/100 mL/min), blood volume (mL/100 mL), Ktrans (mL/100 mL/min), and total tumor volume (mL) for all tumors, adenocarcinoma (Figs. 3–5⇓⇓), and SCC. Additionally, the maximal values for BF and BV were included. There were no statistical differences between the mean BF values of the all-tumors, adenocarcinoma, and SCC groups, ranging from 35.4 to 35.8 mL/100 mL/min. Mean BV (range, 7.3–10.0 mL/100 mL) and mean Ktrans (range, 27.8–28.5 mL/100 mL/min) were close to each other in all 3 groups. The total tumor volumes of the CT perfusion group were not significantly different from the 18F-FDG PET/CT group, arguing against a significant tumor growth between the 2 imaging studies. No significant differences were found between the adenocarcinoma and SCC groups for the mentioned parameters and low, intermediate, and high grading (not shown).
CT Perfusion Parameters and Histologic Subtypes
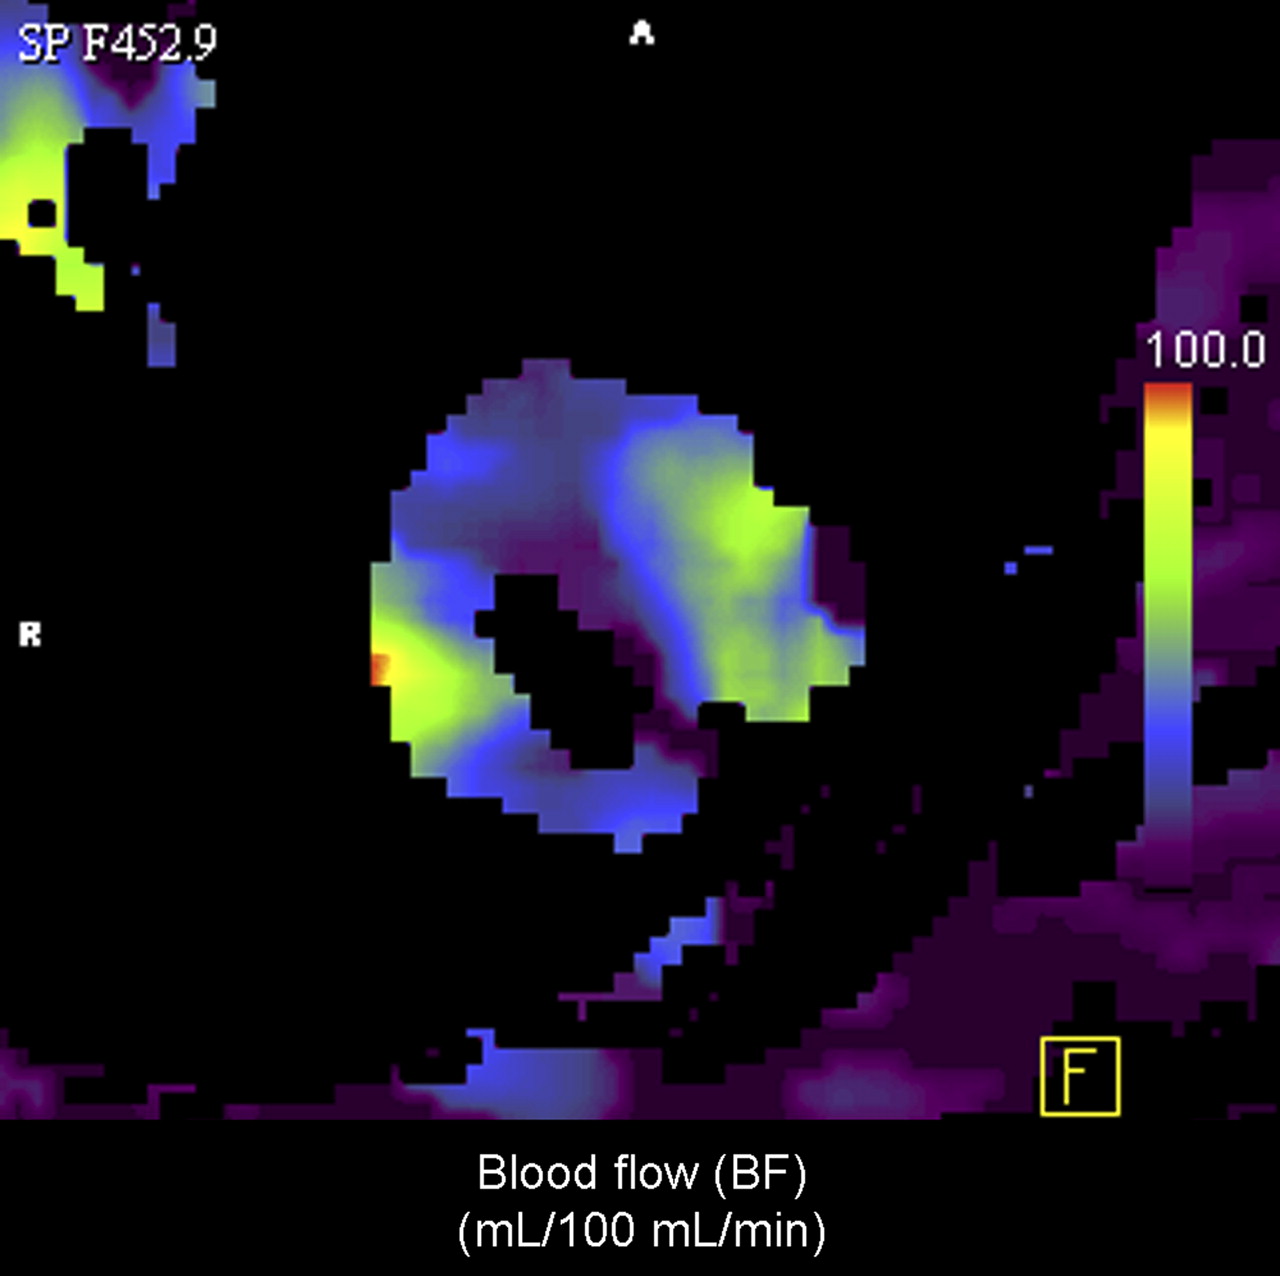
BF map of patient with adenocarcinoma.

BV map of patient with adenocarcinoma.

Ktrans map of patient with adenocarcinoma.
18F-FDG PET/CT and CT Perfusion Parameters: Correlations with Ki67 and MVD
Table 3 summarizes the Pearson product moment correlation coefficients (r) and P values of the different 18F-FDG PET/CT and CT perfusion parameters correlated with Ki67 and MVD. In the all-tumors group, positive correlations between SUVmean (50%), SUVmean (free), SUVmax, and Ki67 are represented by Pearson product moment correlation coefficients of 0.626, 0.486, and 0.622. The CT perfusion parameters show no positive relationship with Ki67. No positive correlations were found for 18F-FDG uptake values and MVD. In contrast, Ktrans and MVD were highly correlated and also mean BF, suggesting a correlation to some degree. In the adenocarcinoma group, a high correlation between SUVmean (50%) and Ki67 was seen. The other 18F-FDG PET/CT and CT perfusion parameters reveal no positive relationship with either Ki67 or MVD. SUVmean (50%) and SUVmax in the SCC group show high Pearson product moment correlation coefficients; however, the P values were above 0.05. Similar to the adenocarcinoma group, no correlations were found for the CT perfusion parameters and Ki67 and 18F-FDG PET/CT parameters and MVD. The mean BF values were highly correlated with MVD. On the other hand, the maximum values for BF and BV reveal lower correlations than do the corresponding mean values.
18F-FDG PET/CT and CT Perfusion Parameter Correlations with Ki67 and MVD
18F-FDG PET/CT and CT Perfusion Parameters: Correlations with Total Tumor Volume
Table 4 includes the Pearson product moment correlation coefficients (r) and P values of the different 18F-FDG PET/CT and CT perfusion parameters correlated with total tumor volume. For this analysis, the respective means of the total tumor volumes as determined from 18F-FDG PET/CT and CT perfusion datasets were used. Highly positive correlations of the tumor volume with maximal BV were found in the adenocarcinoma group and for SUVmean (50%) and SUVmax in the SCC group.
18F-FDG PET/CT and CT Perfusion Parameter Correlations with Total Volume
BF–Metabolic Relationships Correlated with Total Tumor Volume and Histologic Subtype
Again, the means of the total tumor volumes from 18F-FDG PET/CT and CT were used for this analysis. To test the reliability of the SPVs, we investigated whether there was a correlation between SPV and BF. A high correlation was represented by a product moment correlation coefficient of 0.861 and a P value of 0.000. For all tumors (Fig. 6A), no correlation between the difference in SPV and SUVmean was found (SPV and SUVmean (50%): r = 0.314, P = 0.135; SPV and SUVmean (ellipsoid): r = −0.362, P = 0.082; and SPV and SUVmean (free): r = 0.264, P = 0.213). The same holds true for the adenocarcinoma group (Fig. 6B) (SPV and SUVmean (50%): r = −0.0791, P = 0.788; SPV and SUVmean (ellipsoid): r = −0.318, P = 0.268; and SPV and SUVmean (free): r = −0.090, P = 0.759). Interestingly, SPV–SUVmean (50%) and SPV–SUVmean (free) reveal highly positive correlations with the total tumor volume for the SCC group (SPV and SUVmean (50%): r = 0.762, P = 0.017; SPV and SUVmean (ellipsoid): r = −0.381, P = 0.312; and SPV and SUVmean (free): r = 0.757, P = 0.018) as shown in Figure 6C.
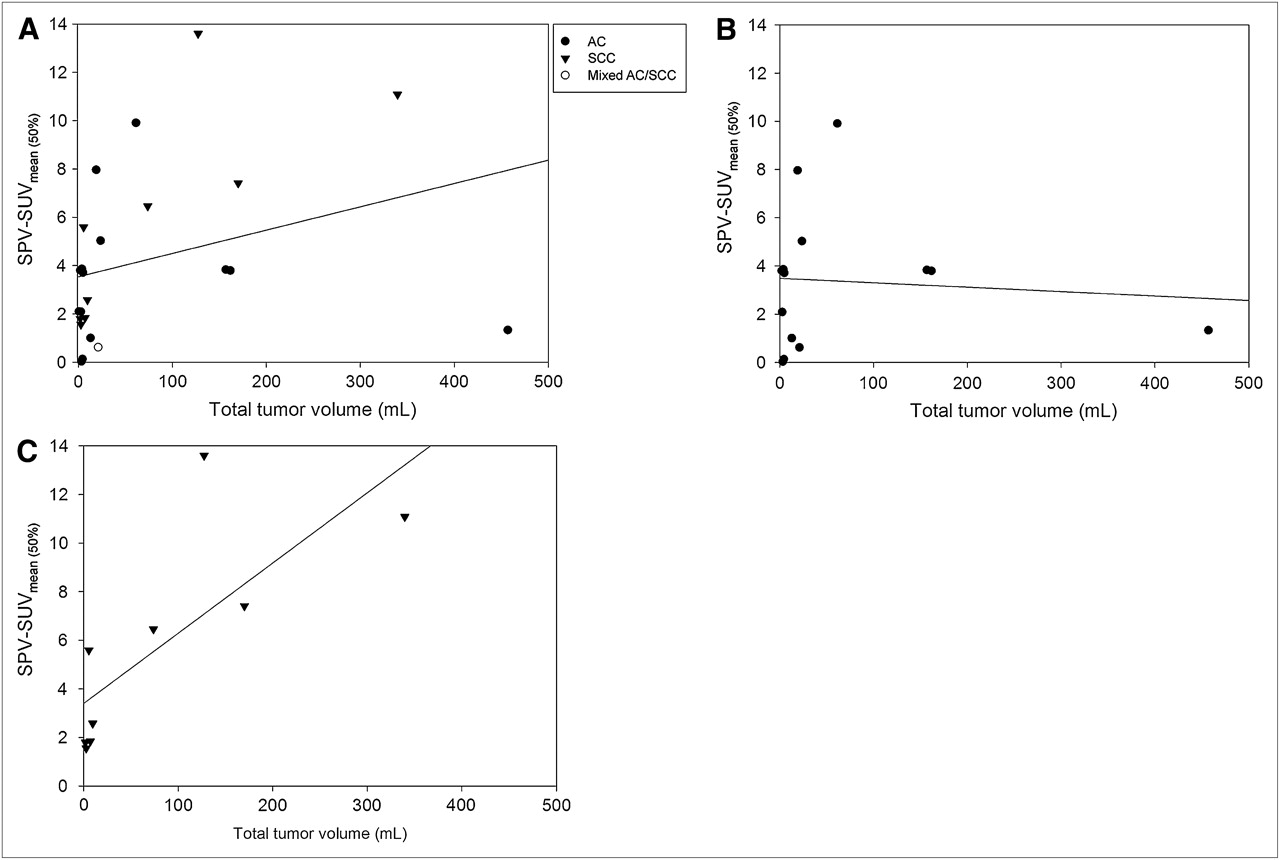
(A) BF–metabolic relationship correlated with total tumor volume in all patients (SPV and SUVmean (50%)). (B) BF–metabolic relationship correlated with total tumor volume in patients with adenocarcinoma (SPV and SUVmean (50%)). (C) BF–metabolic relationship correlated with total tumor volume in patients with SCC (SPV and SUVmean (50%)).
DISCUSSION
More sensitive and specific surrogate biomarkers are needed for tumor characterization, prognosis evaluation, and individualized therapy regimes. 18F-FDG PET/CT has gained wide acceptance for staging and restaging patients with NSCLC. For SUVmax, a strong inverse correlation with survival was observed in patients with NSCLC (12). Besides glucose metabolism, tumor angiogenesis plays an important role in tumor growth and metastasis. With the advent of more specific therapies for NSCLC, the demand for multiparametric tumor profiling, capable of predicting tumor aggressiveness, response, and prognosis, becomes mandatory.
Today, efforts are being made to evaluate the benefit of measuring tumor perfusion with functional CT. Zhang et al. have proposed the application of CT perfusion imaging for pulmonary nodules and studied BF patterns in a single CT scan section (13). This technique is based on the exchange of iodinated contrast material between the intravascular space and the extravascular interstitial space and can be easily integrated in a clinical routine setting (14). To further increase the perfusion coverage without enlarging the physical detector width, repeated spiral scanning and continuous table movements were combined (10). In 2010, Tacelli et al. applied the latest 4-dimensional spiral-mode technique for lung cancer perfusion studies using a 128-row CT scanner (15). Hybrid and multifunctional imaging technologies, compared with stand-alone systems, are advancing because a more sophisticated disease profiling is possible (16,17). In 2006, Miles et al. pioneered this field, examining the relationships between tumor BF and glucose metabolism in NSCLC (18).
Here, we set out to prospectively quantify perfusion parameters in NSCLC (adenocarcinoma and SCC) using the novel technique of VPCT and to look for possible correlations with 18F-FDG uptake and established immunohistochemical biomarkers such as Ki67 and MVD.
Our results show no significant differences in perfusion (BF, BV, and Ktrans) between adenocarcinomas and SCCs and grading. Positive correlations between mean BF, mean Ktrans, and MVD were found in the entire patient cohort. However, correlation between BF and MVD reached statistical significance only in SCC. Assessment of tumor volume perfusion by VPCT showed similar results in both NSCLC groups, correlating positively with MVD but not with Ki67. Unexpectedly, the correlation between maximal BF or BV and MVD were lower than the correlation between the mean values and MVD. This lower correlation might be explained by the fact that specimen-taking and histologic preparation were not guided by these maximum perfusion values. A similar attempt to find a correlation between tumor perfusion and 18F-FDG uptake in NSCLC was done by Hoekstra et al. using 15O-labeled water as a tracer for perfusion measurement; the authors could not ascertain any significant correlation between the 2 parameters and concluded that perfusion and glucose consumption are not coupled in NSCLC (19). Ng et al. demonstrated that tumor BF measurements as determined by perfusion CT and 15O-labeled water PET correlate reasonably, although both methods have different physical backgrounds and instrumentations (20). The authors concluded that CT was better able to exclude peritumoral vessels because of its higher anatomic resolution. The inclusion of such peritumoral vessels in PET-derived regions of interest would be expected to result in higher PET estimates of BF. The main advantage of the novel VPCT technique over previous perfusion measurement techniques is the ability to calculate perfusion with short-duration scans and its independence of an on-site cyclotron. The density–time curve of tissue reaches its maximum slope before peak density (21). In addition to these advantages, VPCT enables whole-tumor assessment excluding sampling errors generated by previously used single-slice measurements and is empowered by robust motion correction, avoiding artifacts. However, one should take into consideration that imaging protocols and instrumentations are still under development and not yet standardized. The additional radiation exposure prohibits a careless use.
Mean standardized uptake values differed significantly only between the subgroups of SCC and adenocarcinoma when taking the entire tumor volume into account, as represented by the SUVmean (free). In our study, glucose utilization significantly correlated with tumor cell proliferation (Ki67) but not with MVD. These results are in line with other studies involved in this field of multifunctional imaging. Thus, Han et al. observed a positive correlation between SUVmax and Ki67 and no correlation between SUVmax and MVD CD34 (7). These findings were affirmed by other studies, for example, Guo et al. (22) and Kaira et al. (23). However, Tateishi et al. found a positive correlation (r = 0.612, P < 0.001) between SUVmean and MVD (24). Their CT investigational protocol differed considerably from ours and was tailored for thin-slice measurements, which are less accurate. Recently, Xing et al. proposed a positive correlation between MVD and 18F-FDG PET/CT (25). Our results do not support this proposal. They also did not yield significant differences in the distribution of Ki67 values paralleling those in 18F-FDG uptake between NSCLC subgroups, compared with Vesselle et al. (26). 18F-FDG uptake differed among the NSCLC subtypes and correlated only with Ki67, not with MDV. Hence, the 2 imaging methods offer complementary information for tumor profiling.
Following recommendations from Miles et al., we additionally calculated the SPVs relating tissue perfusion to average whole-body perfusion and subsequently correlated results with 18F-FDG uptake (11). We found a positive correlation between SPV and SUVmean (50%), SPV and SUVmean (free), and total tumor volume in SCC but not in adenocarcinoma. This difference among the histologic subtypes was a new finding and might serve as a tool for an additional noninvasive tumor characterization.
Because the radiation-sensitive breast tissue was located in the range of the primary beam, the effective dose was significantly increased for female patients examined with an additional CT perfusion study (8). Therefore, the potential adverse effects regarding the lifetime risk for breast cancer have to be considered, especially for younger women. The decision for an additional exposure should be carefully balanced. When integrating a CT perfusion study into 1-stop-shop PET/CT examinations, reconsideration of the diagnostic CT protocols for possible dose savings are advised.
There are some limitations to this work. First, only 24 patients could be enrolled in the presented study. In addition, immunohistochemical analysis could be performed in only 18 of 24 specimens. Next, no pixel-by-pixel analysis was undertaken between SUVmean, SUVmax, BF, BV, and Ktrans maps. We did not correct the PET data for partial-volume effects; however, no lesion was smaller than 10 mm (27).
CONCLUSION
18F-FDG uptake correlates with Ki67 whereas CT perfusion parameters correlate with MVD. Therefore, both noninvasive imaging modalities provide complementary information for tumor profiling. Interestingly, adenocarcinoma and SCC manifest a different BF–metabolic relationship with the total tumor volume. New hybrid imaging modalities with combined 18F-FDG PET/CT and perfusion CT will therefore provide more accomplished techniques for tumor profiling, classification, prognosis, and therapy monitoring.
DISCLOSURE STATEMENT
The costs of publication of this article were defrayed in part by the payment of page charges. Therefore, and solely to indicate this fact, this article is hereby marked “advertisement” in accordance with 18 USC section 1734.
Acknowledgments
We thank our technicians Nicole Sachse, Astrid Schreiber, and Henriette Heners for their excellent assistance. Siemens Healthcare supported the study. No other potential conflict of interest relevant to this article was reported.
Footnotes
↵* Contributed equally to this work.
Published online Mar. 13, 2012.
- © 2012 by the Society of Nuclear Medicine, Inc.
REFERENCES
- Received for publication September 1, 2011.
- Accepted for publication December 16, 2011.


Jump to section
Related Articles
Cited By...
- Correlation of Iodine Quantification and FDG Uptake in Early Therapy Response Assessment of Non-small Cell Lung Cancer: Possible Benefit of Dual-energy CT Scan as an Integral Part of PET/CT Examination
- Imaging-Based Treatment Adaptation in Radiation Oncology
- Picture the future: emerging imaging modalities
- Perfusion CT imaging of colorectal cancer