


Abstract
Fever-induced refractory epileptic encephalopathy in school-age children (FIRES) is a recently described epileptic entity whose etiology remains unknown. Brain abnormalities shown by MRI are usually limited to mesial-temporal structures and do not account for the catastrophic neuropsychologic findings. Methods: We conducted FIRES studies in 8 patients, aged 6–13 y, using 18F-FDG PET to disclose eventual neocortical dysfunction. Voxel-based analyses of cerebral glucose metabolism were performed using statistical parametric mapping and an age-matched control group. Results: Group analysis revealed a widespread interictal hypometabolic network including the temporoparietal and orbitofrontal cortices bilaterally. The individual analyses in patients identified hypometabolic areas corresponding to the predominant electroencephalograph foci and neuropsychologic deficits involving language, behavior, and memory. Conclusion: Despite clinical heterogeneity, 18F-FDG PET reveals a common network dysfunction in patients with sequelae due to fever-induced refractory epileptic encephalopathy.
In 2006, we individualized a particularly severe epileptic encephalopathy we called devastating epilepsy in school-age children (1). A similar pattern had previously been reported under various names (2–6), and because the condition is triggered by fever, the eponym FIRES (fever-induced refractory epileptic encephalopathy in school-age children) is currently proposed (7). It occurs in previously healthy children, after a brief febrile episode, with an acute phase characterized by convulsive status epilepticus without any feature of central nervous system infection or inflammation. Seizures begin in both temporal-perisylvian areas, with frequent propagation to frontal lobes. Status epilepticus is highly pharmacoresistant and lasts several weeks. The chronic phase immediately follows status epilepticus without any silent period and consists of pharmacoresistant epilepsy with severe cognitive impairment, mainly involving language, memory, and behavior (8). Surprisingly, the cerebral cortex is usually respected (9).
18F-FDG PET is highly sensitive at detecting abnormal metabolic patterns in childhood epilepsy with negative MRI results (10–15). In bilateral epilepsies, visual analysis may be difficult and statistical parametric mapping (SPM) provides a reliable objective alternative. On the basis of a voxel-by-voxel approach, SPM implies no a priori hypothesis regarding the location of anomalies and requires image normalization, registration to a standard template, and statistical comparison to a control group. For ethical reasons, no normal pediatric template is available, and adult templates are used as controls; however, using adults as controls may introduce artifacts in SPM analysis (16). Pediatric templates from pseudocontrols with no visual abnormalities were reported by a few teams (17–19).
The present study had 2 objectives: to detect hypometabolic areas in FIRES using a pediatric template and an age-matched population as a pseudocontrol group and determine their relevance relative to electroencephalograph (EEG) focus and neuropsychologic findings.
MATERIALS AND METHODS
Patients
Inclusion criteria for the diagnosis of FIRES were the following mandatory findings:
Acute onset of seizures without underlying neurologic abnormalities.
Extremely frequent refractory focal seizures, with bilateral perisylvian features, resulting in status epilepticus for at least 24 h.
Prior febrile illness without identifiable infectious agent (thus eliminating meningitis, abscess, or viral encephalitis).
Continuous switchover without a latent period to refractory focal epilepsy lasting at least 1 y.
and the following supportive findings:
Lack of specific MRI abnormalities.
Profound neuropsychologic sequelae.
Of the consecutive series of patients who met these diagnostic criteria, we selected for this study the 8 who had undergone neuropsychologic testing and 18F-FDG PET in our institution over the interval 2003–2009. Five were from Mikaeloff's series (1) and 3 were recruited later. Patients in the present series were examined at a mean age of 9.3 y (range, 6.2–12.9 y) in the chronic phase of the disorder and a mean of 3.5 y after the end of initial status epilepticus. The last seizure had occurred at least 12 h before PET examination.
Mean age of first seizure was 5.8 y, mean duration of initial status epilepticus 24 d, and mean duration of subsequent epilepsy 3.6 y (Table 1). At the time of PET, no patient was seizure-free and median seizure frequency was 3 per month (up to 30), often occurring in clusters. Epilepsy was bilateral in all cases, involving the temporal lobes in 7 and frontal lobes in 4.
Individual Characteristics of Patients
Neuropsychologic Evaluation
The interval between neuropsychologic assessment and the PET study was less than 3 mo. The testing battery included observation of spontaneous behavior and speech and testing of verbal and nonverbal intellectual functioning (Wechsler Intelligence Scale for Children III, Terman Merrill). The examination had to be adapted to the degree of cognitive and behavior dysfunction. Language assessment was based on the French standardization of the European oral language battery for the study of children with acquired brain lesions and on the Peabody Picture Vocabulary Test (20,21). Three patients underwent memory evaluation using the Rivermead Behavior Memory Test and various new learning tests (Rey figure, Signoret memory battery) (22,23); their parents filled out the Achenbach Child Behavior Checklist (24).
MRI
Brain MR images were obtained for all subjects using a 1.5-T imager on the same day as PET was performed. A 3-dimensional (3D) T1-weighted sequence was performed using an inversion/echo/repetition time, with a 1.2-mm slice thickness, a T2-weighted sequence, and fluid-attenuated inversion recovery in the hippocampal axis. MRI was interpreted by a pediatric neuroradiologist unaware of the patient's identity.
PET
Data Acquisition.
Patients were examined using an ECAT EXAT HR+ device (Siemens Medical Solutions), a whole-body scanner that can acquire 63 slices simultaneously, each with a 2.4-mm thickness in 3D acquisition mode. Transverse and axial intrinsic spatial resolution at the center of the field of view was 4.3 and 4.1 mm, respectively. The patients were studied in a fasting and resting state, in a quiet, dimly lit environment. A brain attenuation map was obtained using a transmission acquisition of 3 rod sources of 88Ge for 15 min. Then, 18F-FDG (3.7 MBq/kg of weight) was administered intravenously. After precise head repositioning (similar to head positioning for a transmission scan, using face landmarks and 3D laser), the child was kept lying in the scanner for 30 min up to the PET dynamic acquisition (4 rows, 5-min frames). Patients were clinically monitored for head movements and ictal events. Ictal studies cannot be entirely excluded but were unlikely because no abnormal movement was detected, and patients did not report subjective manifestations occurring during image acquisition. Satisfactory cooperation was obtained, and no sedation was needed. Datasets were reconstructed using a Hanning apodization window (0.5 cycles per pixel cutoff) as radial and axial filters, providing an image resolution of 6.6 mm in the 3 directions.
Data Analysis.
18F-FDG PET images were visually analyzed independently by 1 pediatric radiologist who had been given information on the child's electroclinical data. Transaxial, sagittal, and coronal slices were studied on a computer using the local software BrainVisa-Anatomist (brainvisa.info/index_f.html). The presence or absence of 18F-FDG hypofixation was noted, and if present, each area was classified according to its location and intensity (discrete, moderate, or severe). A hypometabolic area was considered significant when it was seen on more than one slice (3.5-mm thickness) and had moderate to severe intensity.
18F-FDG PET SPM analysis was achieved using MATLAB (The MathWorks, Inc.) and SPM5 software (www.fil.ion.ucl.ac.uk). PET images were normalized using an in-house pediatric PET template (19) and an 8 mm in full width at half maximum gaussian function for smoothing. Group and individual analyses (t test) were performed using a pediatric pseudocontrol group and 2 contrasts, patients < controls and patients > controls. The resulting SPM Z maps were thresholded to P = 0.001, without any multiple-comparison correction. Hypo- and hypermetabolism were considered significant if the corrected P score was under 0.05 at cluster level (corresponding to z scores at a voxel level over 4).
The pseudocontrol group comprised the normal PET examinations selected from an exhaustive age-matched population of epilepsy patients who had undergone the same 18F-FDG PET procedure in our institution during the last 7 y for focal epilepsy with negative MRI results. The 21 subjects had a mean age of 11.4 y (range, 6.1–16.6 y), similar to the mean age of patients in the FIRES group (P = 0.176). PET images of these pseudocontrol subjects disclosed no hypometabolic area using both methods: visual analysis according to the criteria and SPM analysis comparing each subject to the remaining group of 20 subjects at the same thresholds as the ones given in the “Data Analysis” section.
The protocol was approved by the institutional ethical standards committee on human experimentation (AP-HP 02-75 for FIRES/multifocal epilepsy and pseudocontrols/focal epilepsy), and written informed consent was obtained from the guardians of patients participating in the study.
RESULTS
Neuropsychologic Evaluation (Table 1)
All patients but 1 had reduced mental ability. Mental deterioration was severe in half of them (IQ < 50). Neuropsychologic disorders involved mainly language, frontal functions, behavior, and memory. Language disorders affected 7 of 8 patients: 1 had no language at all; 3 had major receptive disorders, including 1 patient with auditory agnosia; and the remaining 3 presented with poor speech production. Frontal disorders mainly consisted of lack of attention, slowness, and perseverations (as well as the fluency deficit previously mentioned, which was likely frontal in origin). Behavioral and emotional disorders of varying severity were associated in all cases. Memory deficit was evidenced in the 3 children with bilateral hippocampal atrophy who were able to perform the tests: it involved verbal as well as visual memory, immediate as well as delayed recall, resulting in marked episodic memory impairment.
MRI (Table 1)
Selective bilateral hippocampal abnormalities were seen in 3 patients, including atrophy and hypersignal. One other patient had diffuse atrophy involving both neocortex and hippocampi. MRI failed to disclose any abnormalities in the remaining 4.
PET
Group Analysis.
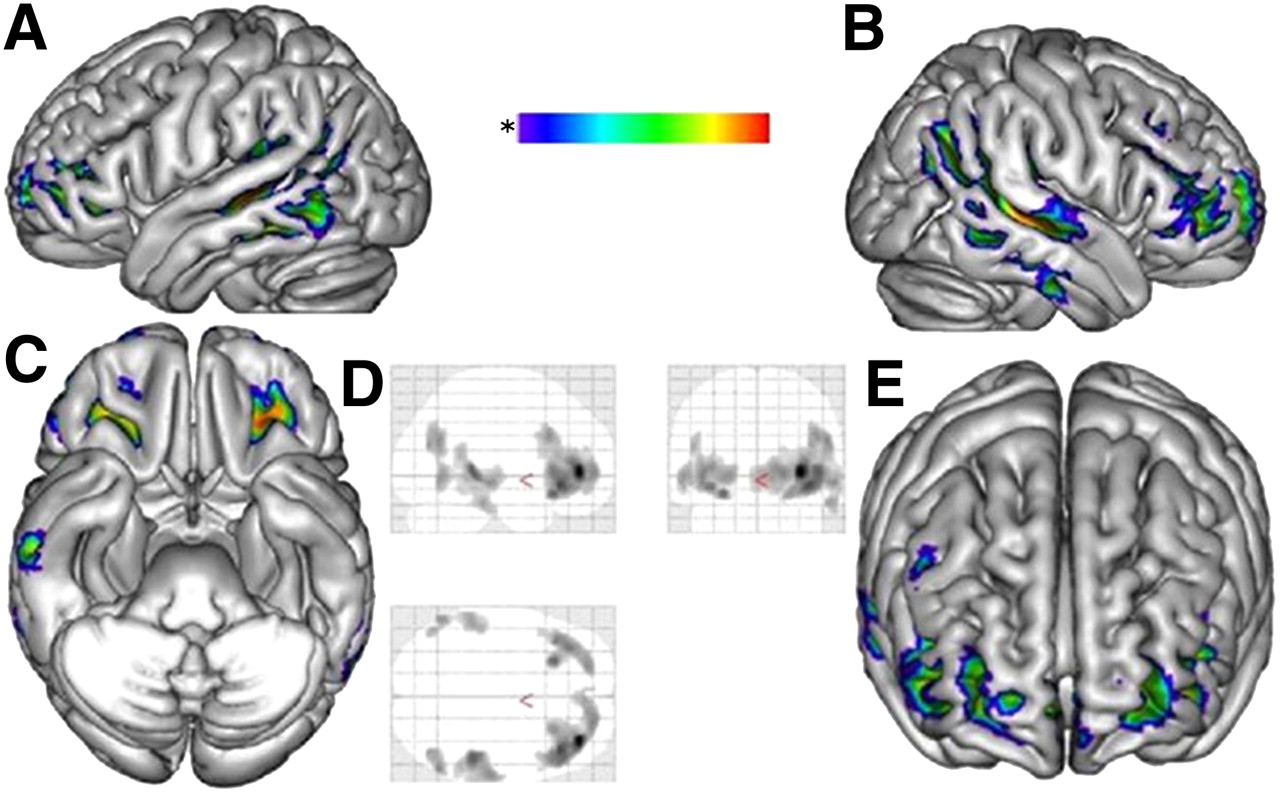
The patients < controls contrast revealed hypometabolism extending bilaterally through the associative temporoparietal and orbito–latero–frontal cortices (Fig. 1). To exclude a potential partial-volume effect related to cerebral atrophy, the analysis was performed again, excluding patient 8 with frontal atrophy on the MR image. The metabolic pattern remained unchanged. Patients > controls contrast did not show any hypermetabolic gray-matter area.

18F-FDG PET, global analysis. Figure shows spatial distribution of hypometabolic areas that are common to all patients in FIRES group, namely bilateral network involving associative temporoparietal and orbito–latero–frontal cortices. These images were obtained using SPM analysis at group level, comparing 8 patients in FIRES group with pediatric pseudocontrol group, with threshold of P = 0.001. Hypometabolism was considered significant if corrected P score was under 0.05 at cluster level. Significantly hypometabolic clusters (P = 0.001 and corrected for extent to 200 voxels) are presented on 3D mesh template in 4 orthogonal views (A–C, and E) and on 3 orthogonal planes of standard brain (glass brain) (D).
Individual Analysis (Table 2 and Fig. 2).
On visual PET analysis, all patients, including those with negative MRI results, disclosed several significant hypometabolic areas that were mostly severe (all but patient 7) and bilateral (all but patient 1) and involved the neocortex (temporal in all patients, frontal in 5, and parietal in 4) as well as the temporomesial structures (all but patient 7). Basal ganglia were either normometabolic or strongly hypermetabolic in patients 4 and 5. Thalami were hypermetabolic in patients 4, 5, and 8. The cerebellum seemed moderately hypometabolic in half the patients (patients 2, 3, and 5) and severely hypometabolic in patient 4.

18F-FDG PET, individual analysis. Figure shows spatial distribution of significantly hypometabolic areas for each patient of FIRES series (numbers correspond to each patient number). These images were obtained using SPM analysis at individual level, comparing each patient with pediatric pseudocontrol group, with threshold of P = 0.001. Hypometabolism was considered significant if corrected P score was under 0.05 at cluster level. Significantly hypometabolic clusters are presented for each patient on 3 orthogonal planes of standard brain (glass brain) (P = 0.001 and corrected for extent to 200 voxels).
Individual PET Data and Correspondence with EEG, MRI, and Neuropsychologic Examinations
On SPM PET analysis, all the significantly hypometabolic clusters corresponded to visually identified hypometabolic areas. As anticipated, these clusters were slightly less numerous than when visual analysis was used, and there was no hypometabolism in basal ganglia, thalamus, or cerebellum. Surprisingly, no hypometabolism was detectable in temporomesial structures. In 7 of 8 cases, PET abnormalities were found in the posterior areas, mainly in temporal and parietal regions but also in 1 patient spreading occipitally. Variably these were identifiably unilateral or bilateral. In 75% of patients, hypometabolism involved insular regions. In 3 patients, the PET abnormality was also frontal or orbitofrontal. The patients > controls contrast showed hypermetabolism in the basal ganglia in patients 4 and 5 and in the thalamus in patients 4, 5, and 8, thus confirming the visual analysis, but failed to detect any hypermetabolism in the cortex.
EEG was consistent with PET hypometabolic areas. Most of the areas were sustained by EEG foci (except parietal and orbitofrontal areas that comprise no specific electrodes in standard recording).
The more extensive was the metabolic deficit (number of voxels), the worse the cognitive impairment (IQ): correlation coefficient, −0.45. Given the relative selectivity of documented deficits, we proposed correspondingly relatively selective disruptions of specific neurologic networks. Associations most often observed were networks subserving language comprehension with uni- or bilateral posterior temporal neocortical hypometabolism (4/4 cases) and language expressive with frontal hypometabolism (3/4 cases), networks subserving memory with bilateral hypometabolism of mesial-temporal structures (patients 1, 7, and 8), and networks subserving the behavior or mood temporo–orbito–latero–frontal hypometabolic network (all patients).
DISCUSSION
The goal of this study was to identify with 18F-FDG PET areas of brain dysfunction in FIRES, a condition in which neuropsychologic disorders suggest extended cortical dysfunctions that are not pointed out by brain structural imaging. On the basis of an original pediatric-based methodology, PET group analysis highlighted a robust widespread hypometabolic cortical network. Such extensive hypometabolism in previously healthy children suggests a functional defect related to the acute epileptic storm—that is, status epilepticus. The hypometabolic area is common to all patients and involves symmetrically both associative temporoparietal and orbitofrontal cortices, even in cases with negative MRI results. Individual analysis confirms that the hypometabolic area includes the epileptogenic network and is consistent with the major troubles of language, memory, and behavior. The network may be more or less extensive depending on the severity of the cognitive dysfunction. Visual PET analysis proved to be superior to SPM analysis at detecting mesial-temporal hypometabolism in the context of extensive cortical abnormalities. These findings raise several issues.
Methodologic Issues
Group analysis with SPM permits detection of all clusters of hypometabolism common to a patient population, compared with a control group. Despite a certain degree of heterogeneity at the individual level, group analysis of patients in the FIRES group found a robust pattern of large, bilateral, and symmetric hypometabolic areas. These abnormalities were highly significant at the most stringent thresholds used in pediatric SPM studies (16,17,25). Furthermore, excluding the only child with extensive cortical atrophy did not modify the findings.
Although EEG was not performed during the 18F-FDG uptake period, additional hypometabolic foci masked by subclinical seizures are unlikely because there were no cortical hypermetabolic clusters on the patients > controls contrast.
The use of a pediatric PET template and an age-matched control group is a major point. Because of ethical constraints, few reports comprise healthy children as control group (26). Most studies use young adult control groups (16). One main issue is the different size of the head, which cannot be solved with spatial correction: statistical maps using adult templates, compared with the present pediatric template, exhibit significant hypometabolic artifacts covering the whole cerebellum and caudate nuclei (19). Another issue is the major maturation changes of global and regional cortical metabolism that take place throughout childhood and may generate errors in the detection of hypometabolism (17). We had the opportunity to have access to a population that can be considered as a valuable pseudocontrol group because no anomaly was disclosed on 18F-FDG PET.
18F-FDG PET and Detection of Hypometabolic Areas in Epileptic Encephalopathy
Regional glucose metabolism reflects neuronal activity, and focal hypometabolism reflects an area of neuronal dysfunction. Epileptogenic pathways and dysfunctioning cognitive networks are associated with hypometabolism, although the hypometabolic areas are usually more extensive than the EEG focus (27,28).
In a significant proportion of childhood epileptic encephalopathies with negative MRI results, 18F-FDG PET reveals hypometabolic areas—that is, infantile spasms, Lennox-Gastaut syndrome, or Continuous Spikes and Waves in Slow Sleep syndrome (25,29–31). Although epilepsy is commonly referred to as generalized, these hypometabolic areas are focal. Some of them correspond to malformations beyond MRI sensitivity that can be surgically removed, thereby curing epilepsy (32). However, in most instances 18F-FDG hypofixation areas point out brain areas altered by the epileptic activity: they may either vanish after control of epilepsy (33) or persist in the case of cognitive sequelae (30). They usually extend beyond the epileptic focus and may involve distant areas connected to it (25,30). An EEG–functional MRI approach proved that such widespread hypometabolism resulted from both surrounding and remote inhibition, which might sustain the neuropsychologic impairment (34,35).
Temporal–Orbitofrontal Dysfunction in FIRES: From Areas to Network
In pediatric as in adult focal epilepsy with negative MRI results, hypometabolic areas are known to image the epileptogenic network (27,28). Indeed, the hypometabolic network we found in patients in the FIRES group corresponds to the electroclinical features of seizures that involve the temporofrontal cortex bilaterally.
Hypometabolic areas in FIRES are also consistent with neuropsychologic findings, as previously reported in other epilepsy conditions: low cognitive functioning with the extent and bilaterality of frontal hypometabolism (36), language disorders with external temporal involvement and, particularly, receptive troubles with posterior parietotemporal hypometabolism (37), behavior disorders with orbitofrontal hypometabolism, and major sociocognitive troubles with bilateral hypometabolism of the superior temporal gyrus (according to PET findings in autistic children (38)). A quite similar network has been identified in children with aggressive behavior (39).
It is therefore surprising that in FIRES, major alteration of episodic memory tasks is not correlated with mesial-temporal hypometabolism using SPM analysis. We hypothesized that this paradox could result from technical limitations because hypometabolism within mesial structures was detectable visually. The normalization step during PET analysis may lead to spatial bias. There may be a misalignment of hippocampus between normalized subjects, especially in temporal-atrophic patients. As an example, the same standard normalization as the one we presently used missed hippocampus atrophy in voxel-based morphometry of high-resolution T1-weighted MRI (40).
The hippocampus, compared with the neocortex, is physiologically hypometabolic and more heterogeneous, especially in children. Pathologic hippocampal hypometabolism has been evidenced in adults only, using SPM, and with group analysis with more patients than our study used (27). Such an abnormality may therefore have been missed in our series because of a lack of statistical power along with spatial bias in SPM and the extensive and massive neocortical hypometabolism that characterizes FIRES.
CONCLUSION
PET findings do contribute to the identification of FIRES as a recognizable entity. Although the initial status epilepticus produces no evidence of neocortical necrosis, the functional impact is massive, and it persists for years. At a more subtle individual level, consistency is evidenced for most patients between the extent of the PET defect and both the functional troubles and the interictal EEG foci.
Acknowledgments
This work was supported by a grant provided by the Fondation pour la Recherche sur le Cerveau.
- © 2011 by Society of Nuclear Medicine
REFERENCES
- Received for publication March 13, 2010.
- Accepted for publication June 25, 2010.


Jump to section
Related Articles
Cited By...
- FDG-PET and MRI in the Evolution of New-Onset Refractory Status Epilepticus
- Age-Specific 18F-FDG Image Processing Pipelines and Analysis Are Essential for Individual Mapping of Seizure Foci in Pediatric Patients with Intractable Epilepsy
- Delineating Cortical Networks Underlying Epileptic Encephalopathy and Cognitive Impairment with PET: A Perspective