


Abstract
Quantitative PET with 15O provides absolute values for cerebral blood flow (CBF), cerebral blood volume (CBV), cerebral metabolic rate of oxygen (CMRO2), and oxygen extraction fraction (OEF), which are used for assessment of brain pathophysiology. Absolute quantification relies on physically accurate measurement, which, thus far, has been achieved by 2-dimensional PET (2D PET), the current gold standard for measurement of CBF and oxygen metabolism. We investigated whether quantitative 15O study with 3-dimensional PET (3D PET) shows the same degree of accuracy as 2D PET. Methods: 2D PET and 3D PET measurements were obtained on the same day on 8 healthy men (age, 21–24 y). 2D PET was performed using a PET scanner with bismuth germanate (BGO) detectors and a 150-mm axial field of view (FOV). For 3D PET, a 3D-only tomograph with gadolinium oxyorthosilicate (GSO) detectors and a 156-mm axial FOV was used. A hybrid scatter-correction method based on acquisition in the dual-energy window (hybrid dual-energy window [HDE] method) was applied in the 3D PET study. Each PET study included 3 sequential PET scans for C15O, 15O2, and  (3-step method). The inhaled (or injected) dose for 3D PET was approximately one fourth of that for 2D PET. Results: In the 2D PET study, average gray matter values (mean ± SD) of CBF, CBV, CMRO2, and OEF were 53 ± 12 (mL/100 mL/min), 3.6 ± 0.3 (mL/100 mL), 3.5 ± 0.5 (mL/100 mL/min), and 0.35 ± 0.06, respectively. In the 3D PET study, scatter correction strongly affected the results. Without scatter correction, average values were 44 ± 6 (mL/100 mL/min), 5.2 ± 0.6 (mL/100 mL), 3.3 ± 0.4 (mL/100 mL/min), and 0.39 ± 0.05, respectively. With the exception of OEF, values differed between 2D PET and 3D PET. However, average gray matter values of scatter-corrected 3D PET were comparable to those of 2D PET: 55 ± 11 (mL/100 mL/min), 3.7 ± 0.5 (mL/100 mL), 3.8 ± 0.7 (mL/100 mL/min), and 0.36 ± 0.06, respectively. Even though the 2 PET scanners with different crystal materials, data acquisition systems, spatial resolution, and attenuation-correction methods were used, the agreement of the results between 2D PET and scatter-corrected 3D PET was excellent. Conclusion: Scatter coincidence is a problem in 3D PET for quantitative 15O study. The combination of both the present PET/CT device and the HDE scatter correction permits quantitative 3D PET with the same degree of accuracy as 2D PET and with a lower radiation dose. The present scanner is also applicable to conventional steady-state 15O gas inhalation if inhaled doses are adjusted appropriately.
Evaluation of cerebral circulation and metabolism plays an important role in the assessment of brain pathophysiology and in decisions with regard to the therapeutic strategy for patients with brain ischemia (1–4). Quantitative PET with 15O provides absolute values for cerebral blood flow (CBF), cerebral blood volume (CBV), cerebral metabolic rate of oxygen (CMRO2), and oxygen extraction fraction (OEF) (5–7). Quantitative oxygen metabolic images cannot be obtained by other imaging modalities such as SPECT or MRI; this is a major advantage of PET with 15O.
Absolute quantification of these variables relies on physically accurate PET measurement, which, thus far, has been achieved by 2-dimensional PET (2D PET) with appropriate data corrections, including randoms correction, radioactive decay correction, attenuation correction, dead-time correction, and detector normalization. In recent years, PET acquisition in the 3-dimensional (3D) mode has become popular, and 3D-only PET scanners are now commercially available (8). In contrast to conventional 2D PET scanners with interplane septa, 3D PET scanners acquire all possible lines of response by removing the septa, allowing for a higher sensitivity and lower radiation dose. However, scatter-coincidence events, which disturb the quantitative nature of PET, constitute a significant proportion of the total detected events in 3D PET. 3D PET is not generally used clinically for the quantitative brain study with 15O. Although there are some reports on the validation of 3D PET (9–14), to our knowledge, no direct comparison between 3D PET and 2D PET exists for measurements of CBF, CBV, CMRO2, and OEF.
The aim of this study was to investigate whether 15O PET with a 3D-only scanner is as reliable as 2D PET. We hypothesized that appropriate scatter correction in 3D PET makes it possible to perform 15O PET with a lower radiation dose and with the same degree of accuracy as 2D PET. We performed 2D PET and 3D PET sequentially on healthy volunteers and compared the CBF, CBV, CMRO2, and OEF values. For 3D PET, a 3D-only scanner was used with a hybrid scatter-correction method (15,16).
MATERIALS AND METHODS
Subjects
Eight healthy men, 21- to 24-y-old, were recruited and provided written informed consent. Two sequential PET studies, with a 2D scanner and a 3D-only scanner, were performed on the same day with each subject at rest. The order of the studies (2D, 3D) was randomized. All volunteers were determined to be healthy on the basis of medical history, blood screening tests, anatomic MRI (T1- and T2-weighted images), and MR angiography of the brain. MRI was performed with a 1.5-T whole-body scanner (Magnetom Vision; Siemens Medical Solutions, Inc.). Three-dimensional T1-weighted images (magnetization-prepared rapid acquisition gradient echo [MPRAGE] sequence; repetition time, 9.7 ms; echo time, 4.0 ms; inversion time, 300 ms; flip angle. 12°; isotropic voxel size, 1 mm) were also used as anatomic references in subsequent region-of-interest (ROI) analysis. The study protocol was approved by the Ethics Committee of the Akita Research Institute of Brain and Blood Vessels.
2D PET Scanner
2D PET was performed with a SET-2300W scanner (Shimadzu Corp.), which uses bismuth germanate (BGO) detectors and provides 47 sections with a center-to-center distance of 3.125 mm (17). The axial field of view (FOV) was 150 mm. The intrinsic spatial resolution was 4.5-mm full width at half maximum (FWHM) in-plane and 4.5-mm FWHM axially. Although the septa can be retracted for 3D acquisition, all data were acquired in 2D mode with the septa in place. The coincidence time window was set to 18 ns.
Image reconstruction with a filtered-backprojection (FBP) algorithm and a Butterworth filter resulted in a final in-plane resolution of approximately 8-mm FWHM. Slices were rebinned by adding sinograms in groups of 2 with a 1-slice overlap between adjacent groups, resulting in 46 reconstructed slices. Before the emission scans, a transmission scan (10 min) with a 68Ge/68Ga external source was performed for attenuation correction. The PET scanner was calibrated by scanning a cylindric phantom (14 cm in diameter) filled with a 68Ga aqueous solution with a known radioactivity concentration. In this procedure, an ROI of 10 cm in diameter was placed in the center of the phantom image. Detector normalization, attenuation correction, and image reconstruction were applied identically to the calibration phantom and to the subjects. No scatter correction was applied.
3D PET Scanner
For 3D PET, a SET-3000GCT/M scanner (PET/CT; Shimadzu Corp.) dedicated to the 3D mode was used (15). It uses gadolinium oxyorthosilicate (GSO) detectors and provides 59 sections with a center-to-center distance of 2.6 mm. The axial FOV was 156 mm. The intrinsic spatial resolution was 3.5-mm FWHM in-plane and 4.2-mm FWHM axially. In this study, the scanner was operated in a static scan mode with dual-energy window acquisition. The coincidence time window was set to 6 ns. To reduce the counting rate of random coincidence and scatter coincidence attributable to radioactivity outside the FOV, we used a prototype shield module consisting of 7-mm-thick lead plates attached to the gantry bed and covering the breast and shoulder of the subject.
FBP image reconstruction followed by 3D gaussian smoothing with 6-mm FWHM resulted in a final in-plane resolution of approximately 7-mm FWHM. Before the emission scans, a transmission scan (3 min) with a 137Cs point source was performed with a BGO transmission detector ring coaxially attached to the GSO emission detector ring (15). The PET scanner was calibrated by scanning a cylindric phantom (15 cm in diameter) filled with a 68Ga aqueous solution with a known radioactivity concentration. In this calibration procedure, an ROI of 10-cm diameter was placed in the center of the phantom image. Detector normalization, attenuation correction, scatter correction, and image reconstruction were applied identically to the calibration phantom and to the subjects.
A hybrid scatter-correction method, based on acquisition in the dual-energy window combined with a convolution-subtraction method in the upper energy window (UEW), was used (16,18). In this article, this method is referred to as the hybrid dual-energy window (HDE) method. Coincidence events were assigned to the standard energy window (SEW) when both photons fell within the standard photopeak window (300–700 keV). Additionally, when both photons deposited energy in the range of 480–700 keV, the events were also recorded as UEW data. Raw data for each window were acquired simultaneously and then converted off-line to 2D sinograms by a Fourier rebinning algorithm (19). Therefore, subsequent data processing could be done in 2D calculation without the computational burden of 3D data manipulation.
Estimation of the true (scatter-free) component of the SEW data was performed on a sinogram basis as follows:
(i) The convolution-subtraction method was applied to the UEW data for scatter correction (20). The scatter component of the UEW data, UEWscatter, which is thought to be quite small in comparison with that of the SEW data, was estimated by convolving a 2D scatter kernel with the 2D projection (coronal view) of the UEW sinograms. The scatter kernel was defined as a 2D low-pass filter in the spatial frequency domain, 1/(1 + α exp(β |f|2)), where f represents spatial frequency and α and β are optimization parameters. This function was empirically selected to represent the scatter tail of objects. We optimized the parameters (α, β) by matching the calculated scatter distribution with the measured scatter tail of cylindric phantom (15 cm in diameter). The true (scatter-free) component of the UEW data, UEWtrue, was calculated as:
(ii) The scatter component of the SEW data, SEWscatter, was calculated as a subtraction of UEWtrue scaled by factor f from the SEW data as: The scaling factor f between the 2 energy windows was determined from the phantom data according to the manner of Ferreira et al. (18). For the current configuration of energy windows (480–700 keV for UEW, 300–700 keV for SEW) the scaling factor was approximately 2.5. The energy width of the UEW (480–700 keV) was optimized as a compromise between the number of detected events in the UEW and the accuracy of the scatter correction (convolution-subtraction method) for the UEW data.
(iii) In the final step, the true component of SEW, SEWtrue, was estimated as a subtraction of smoothed SEWscatter, (SEWscatter)smoothed, from the SEW data as: A boxcar moving average with a 50-mm square was used for smoothing. As a result, a scatter-corrected sinogram (corresponding to SEWtrue) and an uncorrected sinogram (corresponding to SEW) were created and were cross-calibrated with cylindric phantom data processed with and without scatter correction, respectively.
PET Procedure
Each PET study included a transmission scan for attenuation correction and 3 static emission scans with the inhalation of C15O, the inhalation of 15O2, and the injection of  (21). The interval between scans was approximately 15 min. A head fixation system was applied for each subject to minimize head movement during scanning. The subjects inhaled the gases (C15O and 15O2) through a disposable plastic face mask under the condition of natural respiration. The gases were supplied at a flow rate of 500 mL/min and at a constant concentration of radioactivity. Blood gases were measured at the beginning and at the end of the scanning.
C15O PET studies were performed to measure CBV (22). Static PET was initiated 3 min after 1 min of continuous inhalation of C15O gas. Scanning lasted 4 min. The total doses of radioactivity supplied by mouth were 5.5 ± 0.7 GBq (average ± SD; n = 8) for 2D PET and 1.3 ± 0.2 GBq for 3D PET. Effective dose estimates to each subject for 2D and 3D PET were 2.8 and 0.7 mSv, respectively. Three arterial blood samples were taken during scanning to measure whole-blood radioactivity. The cerebral–to–large vessel hematocrit ratio was assumed to be 0.85 (23).
 PET studies were performed to measure CBF. The protocol consisted of 3 min of static scanning initiated simultaneously with 2 min of intravenous infusion of
  . Injected doses at the start of scanning were 1.5 GBq for 2D PET and 0.4 GBq for 3D PET. Effective dose estimates to each subject for 2D and 3D PET were 1.4 and 0.3 mSv, respectively. An arterial input function was determined with a β-detector system that continuously measured radioactivity in arterial whole blood taken from the radial artery. Delay and dispersion occurring in the β-detector system and the internal arterial line were corrected as described previously (24,25). CBF was calculated by the autoradiographic method (7,26,27).
15O2 PET studies were performed to measure OEF and CMRO2 (6). The protocol consisted of 3 min of static scanning initiated simultaneously with 1.5 min of inhalation of 15O2. The total doses of radioactivity supplied by mouth were 12.2 ± 0.5 GBq for 2D PET and 3.0 ± 0.3 GBq for 3D PET. Effective dose estimates to each subject for 2D and 3D PET were 4.7 and 1.2 mSv, respectively. The arterial input function was determined in the same way as that for the  PET scan. The contribution of 15O-labeled metabolic water was estimated according to the method of Iida et al. (28).
Data Analysis
For each subject, 3 sets of parametric maps (CBF, CBV, CMRO2, and OEF) were produced for 2D PET, uncorrected 3D PET, and scatter-corrected 3D PET. The 3D PET maps were registered with 2D PET maps with SPM99 (Wellcome Department of Cognitive Neurology) (29,30). All PET maps (2D and 3D) were then transformed to standard brain size and shape with linear and nonlinear parameters with SPM99 and a built-in CBF template. Thus, the resultant parametric maps of all subjects had the same anatomic format with an isotropic voxel size of 2 mm. The ROIs defined in the study by Ito et al. (31) were subsequently applied for all parametric maps. The individual T1-weighted image was examined to confirm the proper arrangement of the ROIs.
Circular ROIs 16 mm in diameter were defined for the pons, midbrain, thalamus, putamen, parahippocampal gyrus, and anterior and posterior parts of the cingulate gyrus, and elliptic ROIs of 16 × 32 mm were defined for the cerebellar cortex, centrum semiovale, and 4 neocortical regions representing the frontal, temporal, occipital, and parietal lobes. ROIs were drawn bilaterally for each brain region (if possible) in 3 adjacent slices, and data were averaged. Mean values and SD for CBF, CBV, CMRO2, and OEF were calculated for 8 subjects. Differences in each variable between 2D PET, uncorrected 3D PET, and scatter-corrected 3D PET were examined by a paired t test with Bonferroni correction for multiple comparisons. Significance was accepted at P < 0.05. Correlation analysis between 2D PET and 3D PET was performed to examine the deviation from the line of identity. Regression lines were determined by principal component analysis. Bland–Altman analysis was also performed to confirm the agreement between 2D PET and scatter-corrected 3D PET (32).
RESULTS
Blood Gas Analysis
The Paco2 (partial pressure of carbon dioxide, arterial), Pao2 (partial pressure of oxygen, arterial), pH, blood pressure, and heart rate during each scanning arre summarized in Table 1. The Paco2 (P = 0.03) and pH (P = 0.04) during the  scanning differed statistically between 2D PET and the 3D PET, but the differences were marginal (1.3 mm Hg and <0.01, respectively). In other items, no significant difference was observed. The arterial hemoglobin concentration and hematocrit during these studies (mean ± SD.) were 14.7 ± 1.0 g/dL and 45.0% ± 3.0%, respectively.
Paco2, Pao2, pH, Blood Pressure (BP), and Heart Rate (HR) During 2D and 3D PET (n = 8)
PET
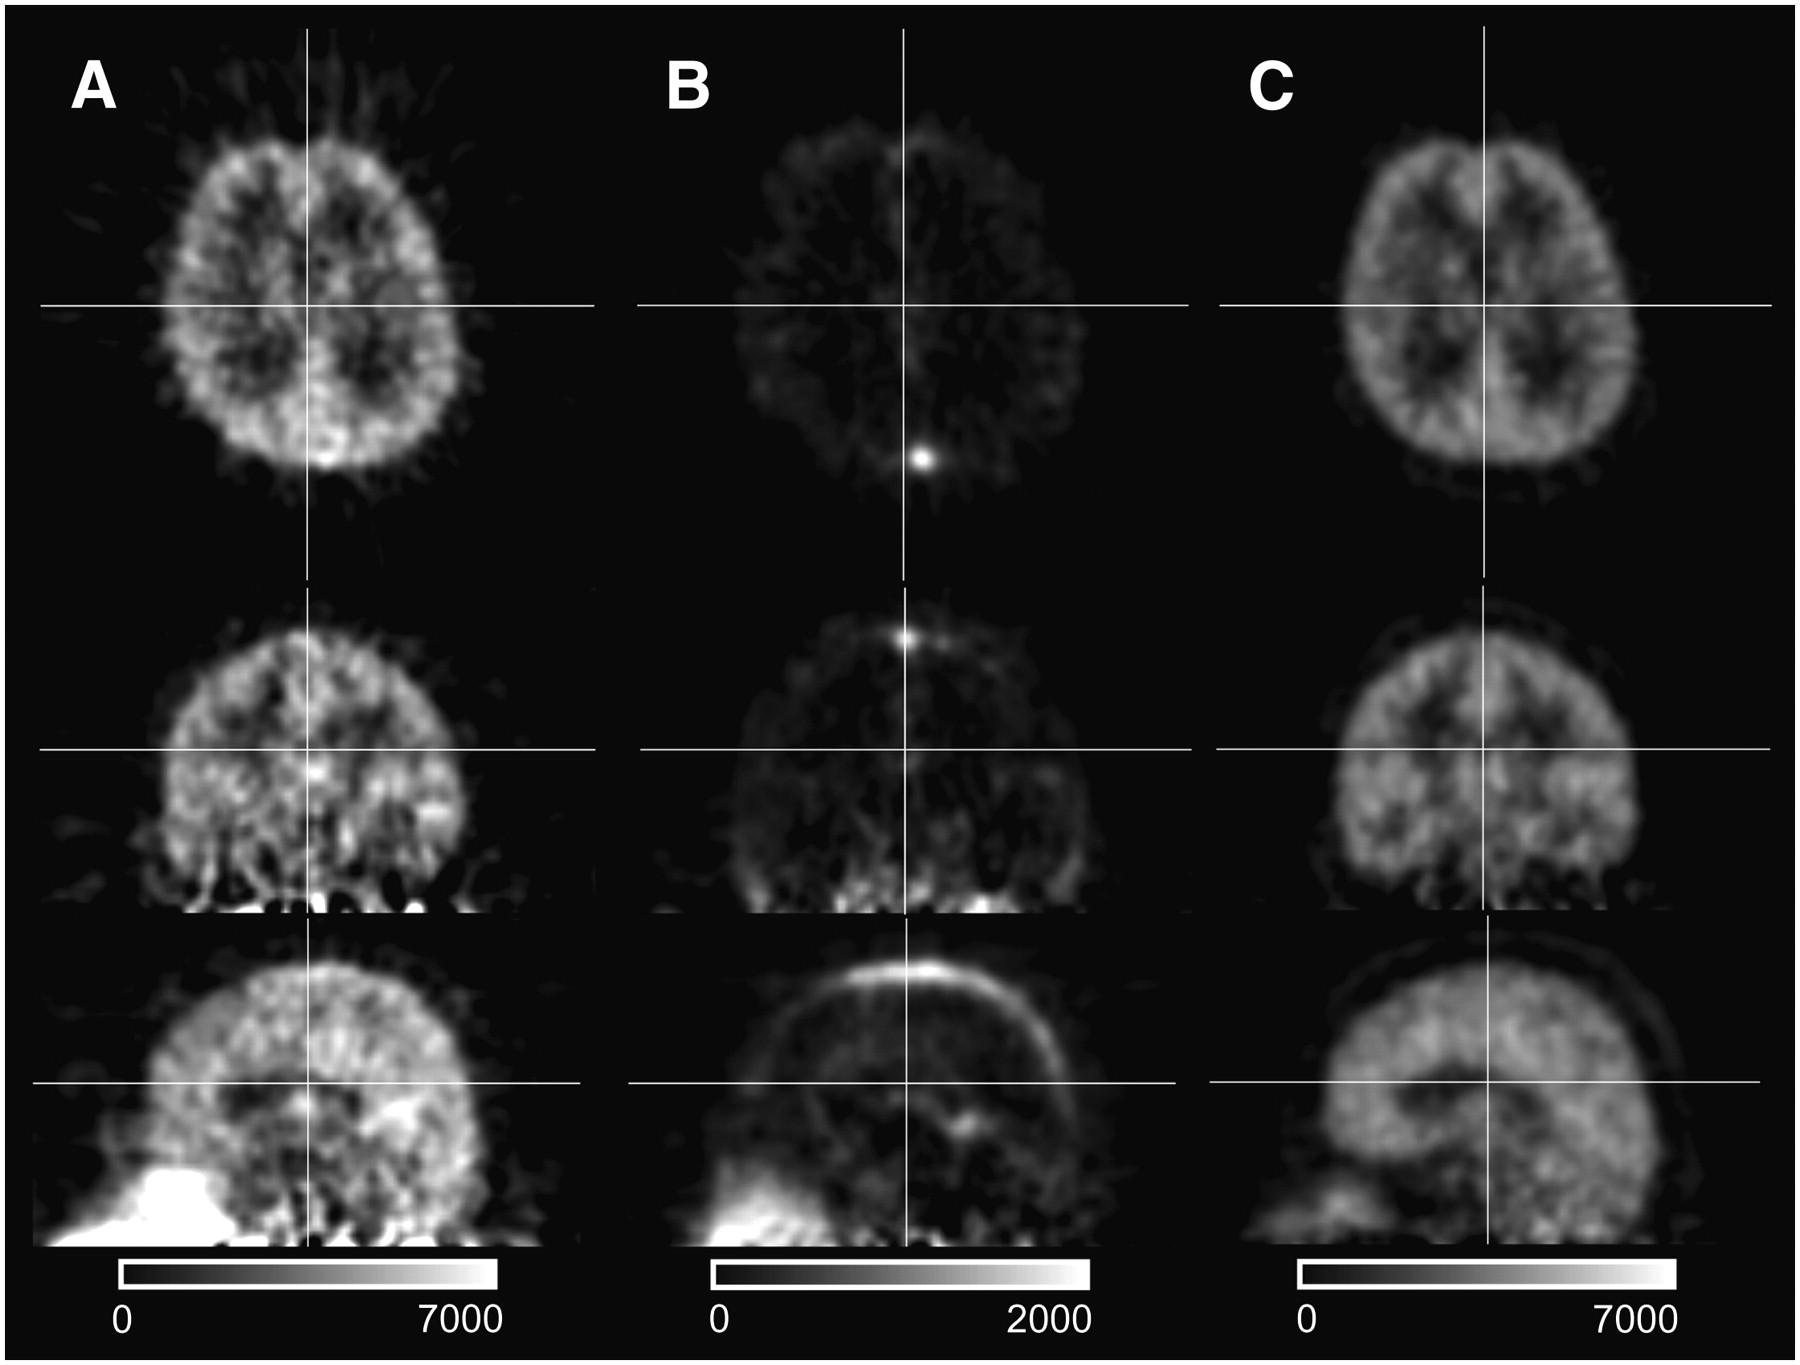
Representative images of 3D PET for 15O2, C15O, and  are shown in Figure 1. The random counting rate was much higher in 15O2 PET compared with C15O and
  PET primarily because of the high concentration of radioactivity in the gas mask (outside the FOV) and in the upper airway. During 15O2 PET, the coincidence counting rate reached up to 300 kcps (1,300-kcps prompt and 1,000-kcps random counting rate) with 3D PET and 100 kcps (550-kcps prompt and 450-kcps random counting rate) with 2D PET. During C15O PET, maximum counting rates, which occurred at the start of scanning, were 50 kcps (70-kcps prompt and 20-kcps random counting rate) with 3D PET and 20 kcps (30-kcps prompt and 10-kcps random counting rate) with 2D PET. During
  PET, the coincidence counting rate reached up to 300 kcps (450-kcps prompt and 150-kcps random counting rate) with 3D PET and 100 kcps (200-kcps prompt and 100-kcps random counting rate) with 2D PET. Despite the lower radioactivity dose in 3D PET, the maximum counting rate was approximately 3 times that of 2D PET, reflecting the higher sensitivity and better counting rate performance of the 3D PET scanner.

Representative images (subject 1) of 3D PET for 15O2 (A), C15O (B), and  (C) in axial view (top), coronal view (middle), and sagittal view (bottom). Images were scatter-corrected by the HDE method. 15O2 image shows high concentration of radioactivity in upper airway because of acquisition during inhalation of 15O2 gases.
CBF
CBF, CBV, CMRO2, and OEF values for 13 brain regions are given in Table 2. Gray–to–white matter ratios of these variables are also included. Anatomically standardized maps for a subject (subject 4) are shown in Figure 2.

Anatomically standardized CBF, CBV, CMRO2, and OEF images of a single subject (subject 4) obtained with 2D PET (left), uncorrected 3D PET (middle), and scatter-corrected 3D PET by the HDE method (right). Slice positions are −36, −18, 0, 6, and 36 mm from anterior commissure–posterior commissure line.
Average CBF, CBV, CMRO2, and OEF Values (n = 8)
In 8 of 13 brain regions, statistically significant differences in CBF between 2D PET and uncorrected 3D PET were observed (Table 2). Compared with 2D PET, uncorrected 3D PET gave larger CBF values in the centrum semiovale and smaller values in the gray matter brain regions, resulting in lower gray–to–white matter CBF ratios. No statistically significant differences in CBF were observed between 2D PET and corrected 3D PET. Corrected 3D PET resulted in gray–to–white matter ratios close to those of 2D PET and showed similar image contrast (Fig. 2).
CBV
In all brain regions, the CBV values were significantly larger with uncorrected 3D PET than with 2D PET (Table 2). In contrast, no statistically significant difference was observed between 2D PET and corrected 3D PET for any brain region. Corrected 3D PET resulted in gray–to–white matter ratios close to those of 2D PET and showed similar image contrast (Fig. 2).
CMRO2
In 10 of 13 brain regions, statistically significant differences in CMRO2 between 2D PET and uncorrected 3D PET were observed (Table 2). Although the trend was similar to that of CBF, CMRO2 values in the pons, parahippocampal gyrus, and midbrain were larger with uncorrected 3D PET than with 2D PET—opposite to the CBF results. In almost all regions (12/13), CMRO2 values were not statistically different between 2D PET and corrected 3D PET. Corrected 3D PET resulted in gray–to–white matter ratios close to those of 2D PET and showed similar image contrast (Fig. 2).
OEF
In contrast to CBF, CBV, and CMRO2, differences in OEF were not large between PET studies. In 5 of 13 brain regions, statistically significant differences in OEF between 2D PET and uncorrected 3D PET were observed (Table 2). A difference between 2D PET and corrected 3D PET was observed only in the midbrain.
Graphic Analysis
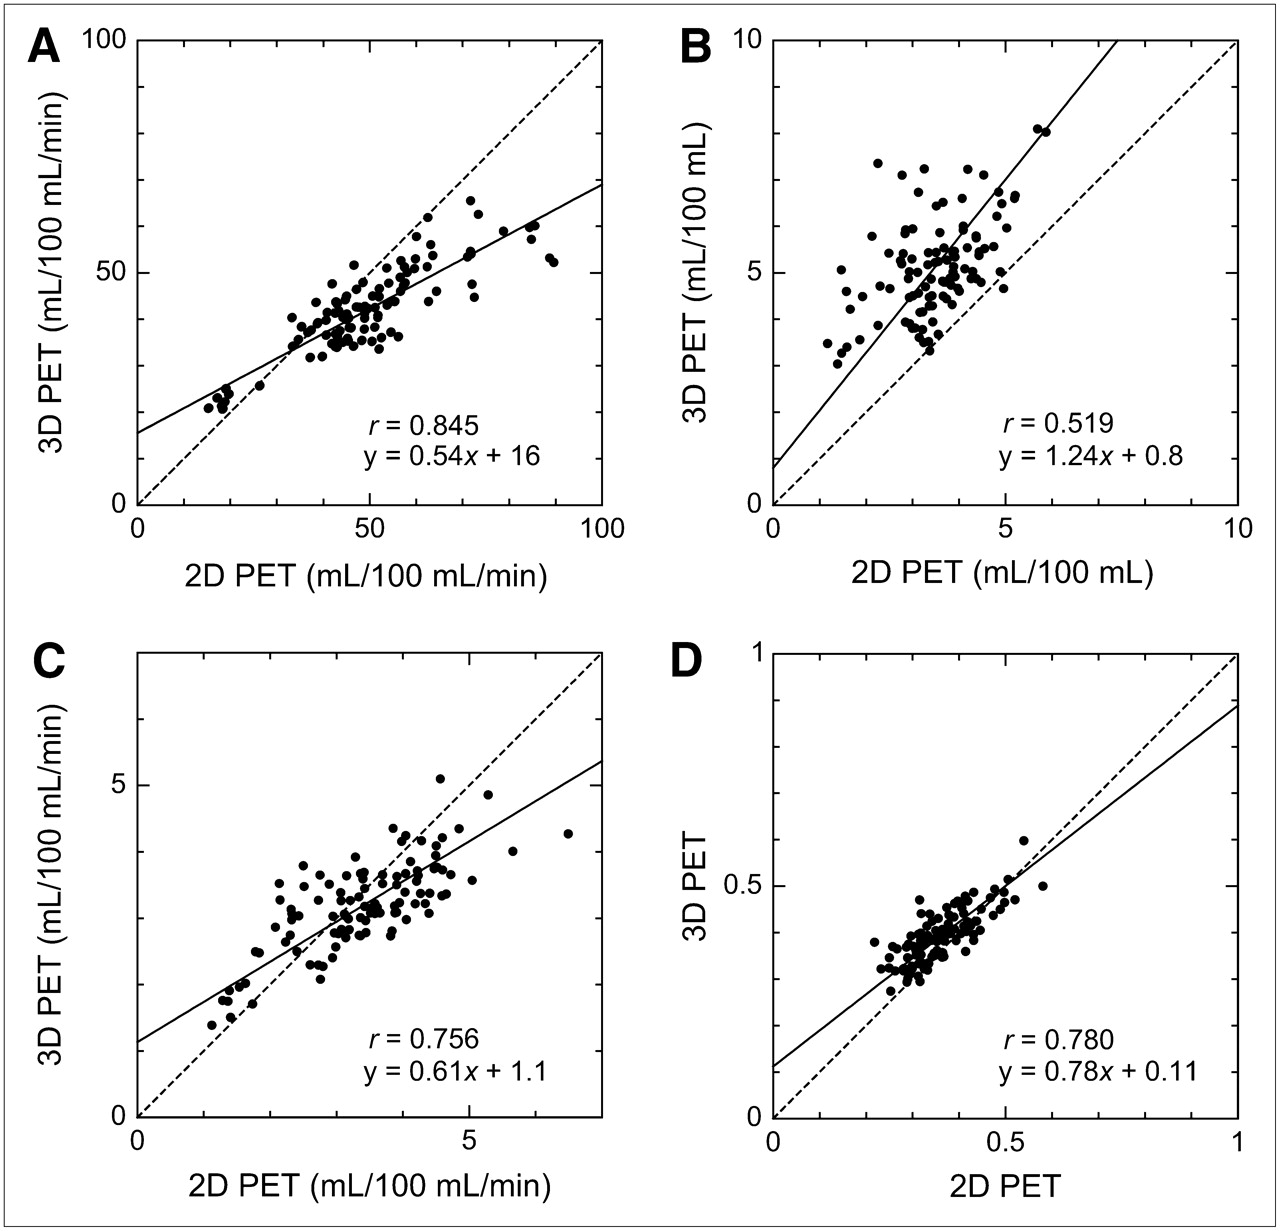
Figures 3 and 4 show the scatter plots correlating 2D PET with uncorrected 3D PET and scatter-corrected 3D PET, respectively. Coefficients of correlation and linear regression lines are also shown. For CBF, CMRO2, and OEF, good correlations were obtained, irrespective of 3D PET scatter correction, although the coefficients were slightly larger when scatter correction was applied. For CBV, scatter correction improved the correlation substantially (0.519 without correction, 0.710 with correction). For all variables, the regression line was closer to the line of identity for corrected 3D PET than that for uncorrected 3D PET.

Correlation between 2D PET and uncorrected 3D PET for CBF (A), CBV (B), CMRO2 (C), and OEF (D). Number of data points is 104 (8 subjects × 13 ROIs) for each dataset. Regression line, determined by principal component analysis (solid line), and line of identity (dashed line) are also shown.

Correlation between 2D PET and scatter-corrected 3D PET for CBF (A), CBV (B), CMRO2 (C), and OEF (D). Number of data points is 104 (8 subjects × 13 ROIs) for each dataset. Regression line, determined by principal component analysis (solid line), and line of identity (dashed line) are also shown.
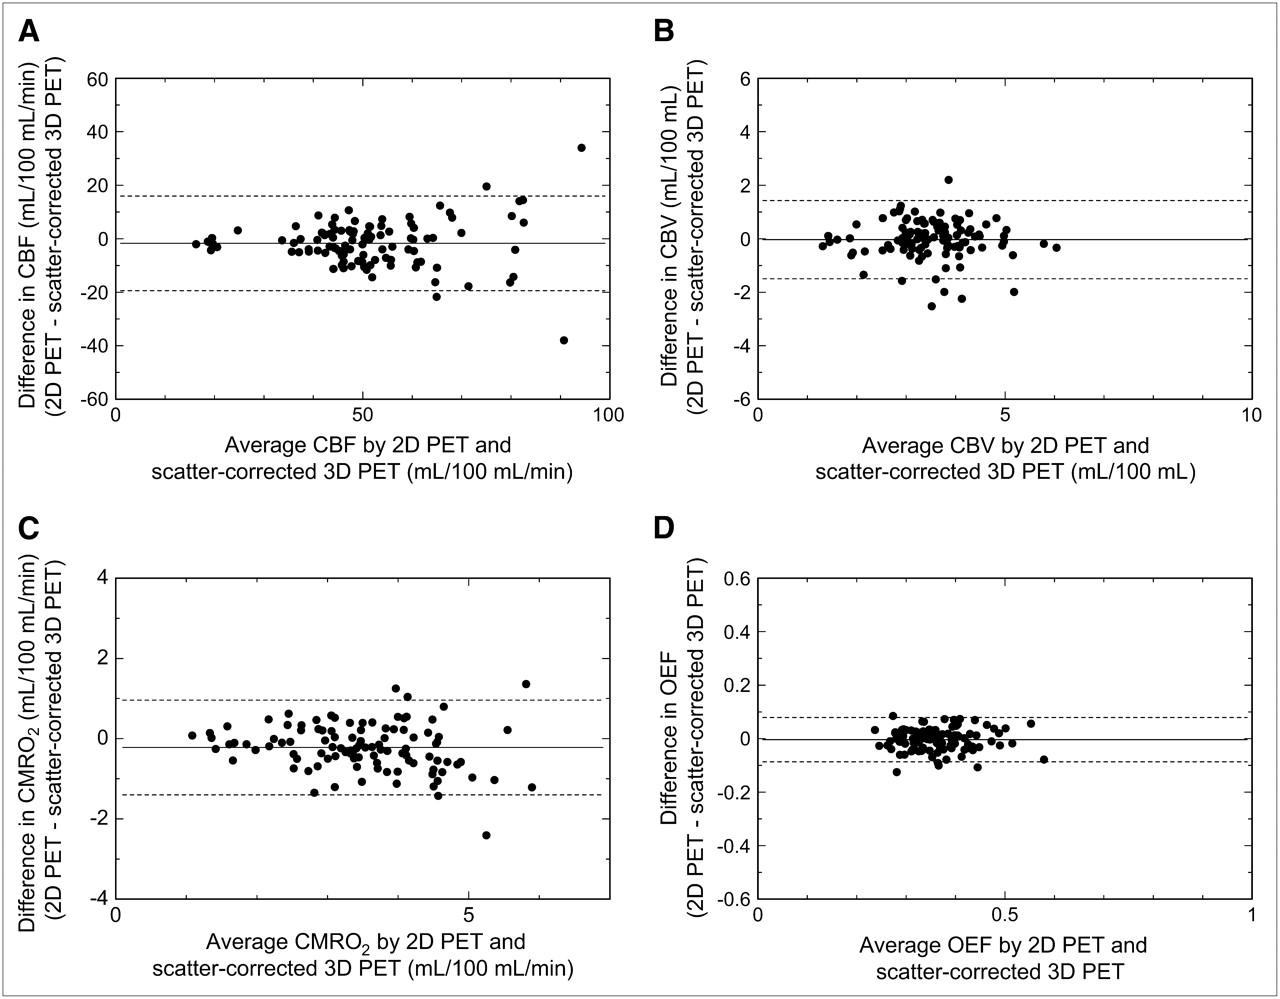
The Bland–Altman plot of the difference in each variable between 2D PET and scatter-corrected 3D PET against their mean value is shown in Figure 5. Although there was a trend toward larger fluctuation for higher CBF and CMRO2, no systematic bias was observed over the range of measurement for all variables. The mean differences (2D PET − scatter-corrected 3D PET) in CBF, CBV, CMRO2, and OEF were −2 ± 9 (mL/100 mL/min), 0.0 ± 0.7 (mL/100 mL), −0.2 ± 0.6 (mL/100 mL/min), and 0.00 ± 0.04, respectively.

Bland–Altman plot (difference against mean) with 2D PET and scatter-corrected 3D PET for CBF (A), CBV (B), CMRO2 (C), and OEF (D). Mean difference (solid line) and ±2 SD (dashed line) are shown.
DISCUSSION
To validate the use of 3D PET with 15O for quantitative measurement of cerebral circulation and oxygen metabolism, we performed a comparative study with 2D PET, the gold standard. A 3D-only GSO scanner with a high counting-rate performance, achieved with a short coincidence time window (6 ns) and advanced electronic circuits, was used (15). The present results showed clear differences in CBF, CBV, and CMRO2 values between uncorrected 3D PET and 2D PET. Decreased image contrast was observed with uncorrected 3D PET. Application of HDE scatter correction resulted in CBF, CBV, CMRO2, and OEF values and their gray–to–white matter ratios similar to those obtained with 2D PET.
This study used 2 PET scanners with different crystal materials, data acquisition systems, spatial resolution, and attenuation-correction methods. From a viewpoint of validation of scatter correction in 3D PET, this is a limitation of the study. The present 3D scanner uses the single photon 137Cs point source for transmission scanning rather than the conventional 68Ge/68Ga coincidence method as used in the 2D scanner (15). Because of the different energy (662 keV) of the 137Cs γ-ray, measured attenuation coefficients were converted to those for 511 keV by simple multiplication with a constant factor (33). Although the 137Cs transmission scanning is considered to be a reliable method, at least for uniform structures such as brain, the effect of the transmission scanning needs to be evaluated quantitatively. We did not apply scatter correction in 2D PET, but the scatter fraction of the 2D scanner was relatively small, approximately 10% (17,34), which may decrease the gray–to–white matter ratio of CBF and CMRO2 by 5%–10% according to our phantom examinations. Even though these methodologic differences existed, the agreement of the results between 2D PET and scatter-corrected 3D PET was excellent, showing that the present PET/CT device substitutes for the current 2D scanner.
The scatter-correction method used for 3D PET was the HDE method (16,18), which is based on simultaneous PET acquisition with a dual-energy window, the SEW in the 300- to 700-keV range, and the UEW in the 480- to 700-keV range. Various correction methods, including the convolution-subtraction method, the simulation-based method, the reconstruction-based method, and their variants, have been proposed (35,36). These methods assume that radioactivity exists only inside the FOV for the estimation of scatter distribution. In contrast, the HDE method involves no such assumption because the scatter distribution is estimated from the energy information of each coincidence event. The HDE method is advantageous for situations in which radioactivity exists outside the FOV, as in the 15O PET study.
The effect of radioactivity outside the FOV was expected to be greatest for the 15O2 study because of the existence of high radioactivity in the gas inhalation mask and the lung field. In the present study, uncorrected 3D PET overestimated CMRO2 values for lower brain regions (pons, parahippocampal gyrus, midbrain) compared with 2D PET (Table 2). This differed from the CBF results and may be due to scatter coincidence originating outside the FOV. For CMRO2, HDE scatter correction provided absolute values close to those of 2D PET, indicating the validity of the HDE method in situations in which radioactivity exists outside the FOV.
One drawback of the scatter correction is the increased noise of the resultant image, although sinogram smoothing is applied for noise reduction. HDE scatter correction applied to 3D PET slightly increased the interindividual variability of CBF, CBV, CMRO2, and OEF values, but the magnitudes remained comparable to those obtained with 2D PET (Table 2). The stability of the method is also important. Because the HDE method is based on simultaneous dual-energy window acquisition, the requirement for stability of the detector system and the electronic circuits is greater than that for conventional PET scanners (18). To validate the use of the HDE method in routine clinical practice, the reproducibility of CBF, CBV, CMRO2, and OEF measurements should be confirmed. We are planning an additional study on short- and long-term reproducibility.
The present PET/CT device places the CT gantry behind the PET gantry, unlike the standard geometry. When applying the standard PET/CT scanners to the 15O brain study, we may encounter technical difficulties with regard to the treatment of the gas inhalation mask and the arterial blood sampling. In addition, the HDE scatter correction requires the capability to acquire the coincidence events with the dual-energy (or multienergy) window mode. It must be noted that the combination of the present PET/CT device and the HDE scatter correction was essential to obtain the present results.
Instead of the conventional steady-state method with the continuous inhalation of 15O-labeled gases, our group has used the 3-step method (6,21), which permits a shorter scan duration (3-min scanning for 15O2 and  ) and provides a higher image contrast (gray–to–white matter ratio) with less underestimation of CBF and CMRO2 because of the tissue mixture effect. In our experience, the present 3D scanner and the HDE scatter correction are applicable to the steady-state 15O gas inhalation, in which the radioactivity is delivered at a rate of 140 MBq/min (one fourth of that for the conventional 2D steady-state measurement). The typical counting rate of 15O2 steady-state measurement with the present 3D scanner was 50 kcps (70-kcps prompt and 20-kcps random counting rate). Although this counting rate was much lower than that with the 3-step method, image quality was comparable to that of the 3-step method because of the longer scan duration (10-min acquisition) and the lower random counting rate.
CONCLUSION
Scatter coincidence is an essential problem in quantitative 3D PET. Application of the HDE scatter-correction method with an advanced 3D PET scanner makes it possible to perform quantitative brain 15O PET with the same degree of accuracy as that in 2D PET. Three-dimensional acquisition is feasible and involves a lower radiation dose than 2D PET.
Acknowledgments
We thank the technical staff of the Akita Research Institute of Brain and Blood Vessels for performing the PET experiments. This research was supported by a grant from the Akita Research Institute of Brain and Blood Vessels and a Grant-in-Aid for Young Scientists (grant 18790923) from the Ministry of Education, Culture, Sports, Science and Technology of Japan.
Footnotes
-
COPYRIGHT © 2008 by the Society of Nuclear Medicine, Inc.
References
- 1.↵
- 2.
- 3.
- 4.↵
- 5.↵
- 6.↵
- 7.↵
Raichle ME, Martin WR, Herscovitch P, Mintun MA, Markham J. Brain blood flow measured with intravenous
 . II. Implementation and validation. J Nucl Med. 1983;24:790–798.
 - 8.↵
- 9.↵
Schafers KP, Spinks TJ, Camici PG, et al. Absolute quantification of myocardial blood flow with and 3-dimensional PET: an experimental validation. J Nucl Med. 2002;43:1031–1040.
- 10.
- 11.
- 12.
- 13.
- 14.↵
- 15.↵
- 16.↵
- 17.↵
- 18.↵
- 19.↵
- 20.↵
- 21.↵
- 22.↵
- 23.↵
- 24.↵
- 25.↵
- 26.↵
- 27.↵
- 28.↵
- 29.↵
- 30.↵
- 31.↵
- 32.↵
- 33.↵
- 34.↵
- 35.↵
- 36.↵


- Received for publication June 5, 2007.
- Accepted for publication October 9, 2007.


Jump to section
Related Articles
Cited By...
- Investigating the Effect of Flow Compensation and Quantitative Susceptibility Mapping Method on the Accuracy of Venous Susceptibility Measurement
- Scatter Correction with Combined Single-Scatter Simulation and Monte Carlo Simulation Scaling Improved the Visual Artifacts and Quantification in 3-Dimensional Brain PET/CT Imaging with 15O-Gas Inhalation
- Cortical Cerebral Blood Flow, Oxygen Extraction Fraction, and Metabolic Rate in Patients with Middle Cerebral Artery Stenosis or Acute Stroke
- Hypoxic Viable Tissue in Human Chronic Cerebral Ischemia Because of Unilateral Major Cerebral Artery Steno-Occlusive Disease
- Quantitative Evaluation of Cerebral Blood Flow and Oxygen Metabolism in Normal Anesthetized Rats: 15O-Labeled Gas Inhalation PET with MRI Fusion
- Central Benzodiazepine Receptor Binding Potential and CBF Images on SPECT Correlate with Oxygen Extraction Fraction Images on PET in the Cerebral Cortex with Unilateral Major Cerebral Artery Occlusive Disease
- Mapping of cerebral oxidative metabolism with MRI