


Abstract
Group studies using PET and other types of neuroimaging require some means to achieve congruence of brain structures across subjects, such that scans from individuals varying in brain shape and gyral anatomy can be analyzed together. Volume registration methods are the most widely used approach to achieve this congruence. They are fast and typically require little manual interaction, but, unfortunately, it is difficult to achieve a good match between cortical areas in volume space, especially where folding patterns vary across subjects. Cortical flattening is a recent, alternative strategy: Its key features are explicit definition of cortex, such that white matter or cerebrospinal fluid compartments are largely excluded from the analysis volume, and subsequent registration of the cortical sheet in its natural, 2-dimensional topology. This type of registration has been demonstrated to provide better matching of congruent cortical structures than volume methods and, thus, offers a potentially more robust way of analyzing PET data. Methods: Here, we explore the applicability of cortical flattening of coregistered MRI to 18F-FDG PET on the HRRT system (high-resolution research tomograph), the highest-resolution whole-head scanner available to date. Results: We report average values and SD of cortical metabolism in a pilot study of the dominant hemisphere in 9 control subjects and provide estimates of group sizes necessary for studies using this technique. Conclusion: We conclude that cortical flattening with subsequent surface registration is a feasible and promising strategy for group studies on the HRRT, providing the highest fidelity maps of human cortical glucose consumption to date.
PET is a functional imaging modality that provides insight into the molecular processes underlying cell metabolism in health and disease (1,2). 18F-FDG, the most widely used agent (3,4), delivers quantitative, proven data on human brain metabolism (5). Unfortunately, the human cortex is a thin structure with an average width of only 3 mm (6), which is substantially smaller than the resolution of conventional, clinical scanners (7). However, with the advent of the second-generation HRRT system ([high-resolution research tomograph] Siemens Medical Solutions, Inc.), the acuity of PET is beginning to match the source of its main focus of interest—the human cortex. In a recent study across multiple sites of installation, the resolution of this system has been demonstrated to provide near-isotropic spatial resolution of 2.5 mm in a volume containing a human brain (8). If the power of this new positron-emission tomograph is to be harnessed, new strategies for spatial normalization need to be used, such that the registration process does not dilute the observed signal further by introducing portions of white matter or cerebrospinal fluid compartments into the measurement volume.
The main goal of intersubject registration is matching of functionally congruent regions, such that functional data in group analysis are derived from comparable structures in all subjects (and matching cortex onto cortex is a component of this problem). The matching of anatomy is a practical surrogate of the actual goal of matching functional locations, which is unknown in a given individual, but consistent to some extent with gyral folding patterns in some areas (9,10) and more variable in others (11,12). All normalization approaches need to deal with variable cortical anatomy and, in particular, with varying patterns of gyration. These cannot be resolved using volume normalization, and it has been shown that, even in regions of highly conserved folding, standard volume approaches are prone to misregistration (13).
Cortical surface extraction and subsequent registration in 2-dimensional (2D) space promises a way to overcome this problem: First, the cortical sheet is explicitly defined; thus, functional measurements can be taken from cortex only, without diluting the signal with white matter or cerebrospinal fluid compartments. Second, registration performed on a 2D representation of cortex is better suited for matching individual folds of cortical anatomy (13)—an important advantage because functional anatomy, to some extent, is predictable by cortical landmarks (9,10), as is its local microarchitecture (14).
In this study, the cortex itself is extracted from a coregistered MRI volume and turned into a 2D representation, which enables faithful matching of cortex to cortex in later stages of analysis. Unlike volume registration, the surface registration process itself cannot introduce noncortical compartments into the analysis volume. We derive group maps of brain glucose metabolism and report metabolic rates from a Brodmann-like parcellation applied to individual brains.
MATERIALS AND METHODS
18F-FDG PET studies in healthy volunteers were approved by the Ethics Committee of the Medical Faculty at the University of Cologne. After administration of 18F-FDG (370 MBq), 9 right-handed volunteers (1 female, 8 male; mean age ± SD, 35 ± 11.6 y; range, 25–63 y) underwent PET on the ECAT HRRT system (Siemens). Subjects were scanned for 1 h after injection, and arterial blood samples were collected during scanning to allow for determination of the cerebral metabolic rate of glucose (CMRGlc). During scanning, the subject's head rested in a foam-cushioned headrest, and a head strap was used to minimize head movement. Attenuation was recorded using a 137Cs single-photon point source before injection. True coincidences from 20 to 60 min after injection were rebinned into sinograms (span, 3; maximum ring difference, 67; true coincidences [average ± SD], 1.26 × 10⁹ ± 1.20 × 10⁸) and reconstructed with corrections for randoms (using real-time subtraction of a delayed coincidence channel), attenuation, scatter (15), and decay into 207 planes with 256 × 256 voxels each, equivalent to a voxel size of 1.22 × 1.22 × 1.22 mm3. Three iterations of 3-dimensional (3D) order-subset expectation maximization (16) were used. The CMRGlc was calculated using a lumped constant of 0.52 (17).
For surface reconstruction, inversion recovery-enhanced T1-weighted MRI was recorded twice for each volunteer on a Gyroscan Intera system (Philips) at 1.5-T field strength. Data were acquired in a volume of 256 × 200 × 256 isotropic voxels with 1-mm edge length using an Inversion Recovery 3D Gradient Echo (18) sequence (echo time, 5.67 ms; repetition time, 10.04 ms; inversion time, 1,000 ms).
HRRT PET took approximately 75 min including setup and attenuation scan, MRI lasted 13 min per acquisition, resulting in a total scan time of 30 min with patient preparation and setup.
To increase the signal-to-noise ratio and enable efficient reconstruction of the cortical sheet, each pair of individual MR acquisitions was averaged after coregistration (19). For coregistration, MR images were skull-stripped using the Brain Extraction Tool ([BET], part of the FMRIB software library [FSL]; http://www.fmrib.ox.ac.uk/fsl) (20). Registration of the 2 MR images was performed using a multiscale simplex search with cross-correlation as the similarity measure (21). Parameters obtained for this transformation were then used to bring the non–skull-stripped original images into register. For registration between averaged MRI and PET, mutual information was used as the similarity measure. Registration was stopped when convergence or a preset number of 200 iterations per scaling step was reached. Convergence is defined here as a difference in the respective similarity measure between the worst and the best registration parameter set in the simplex below 10−5. These processes required around 45 min per subject and were shown to result in submillimeter registration precision (21).
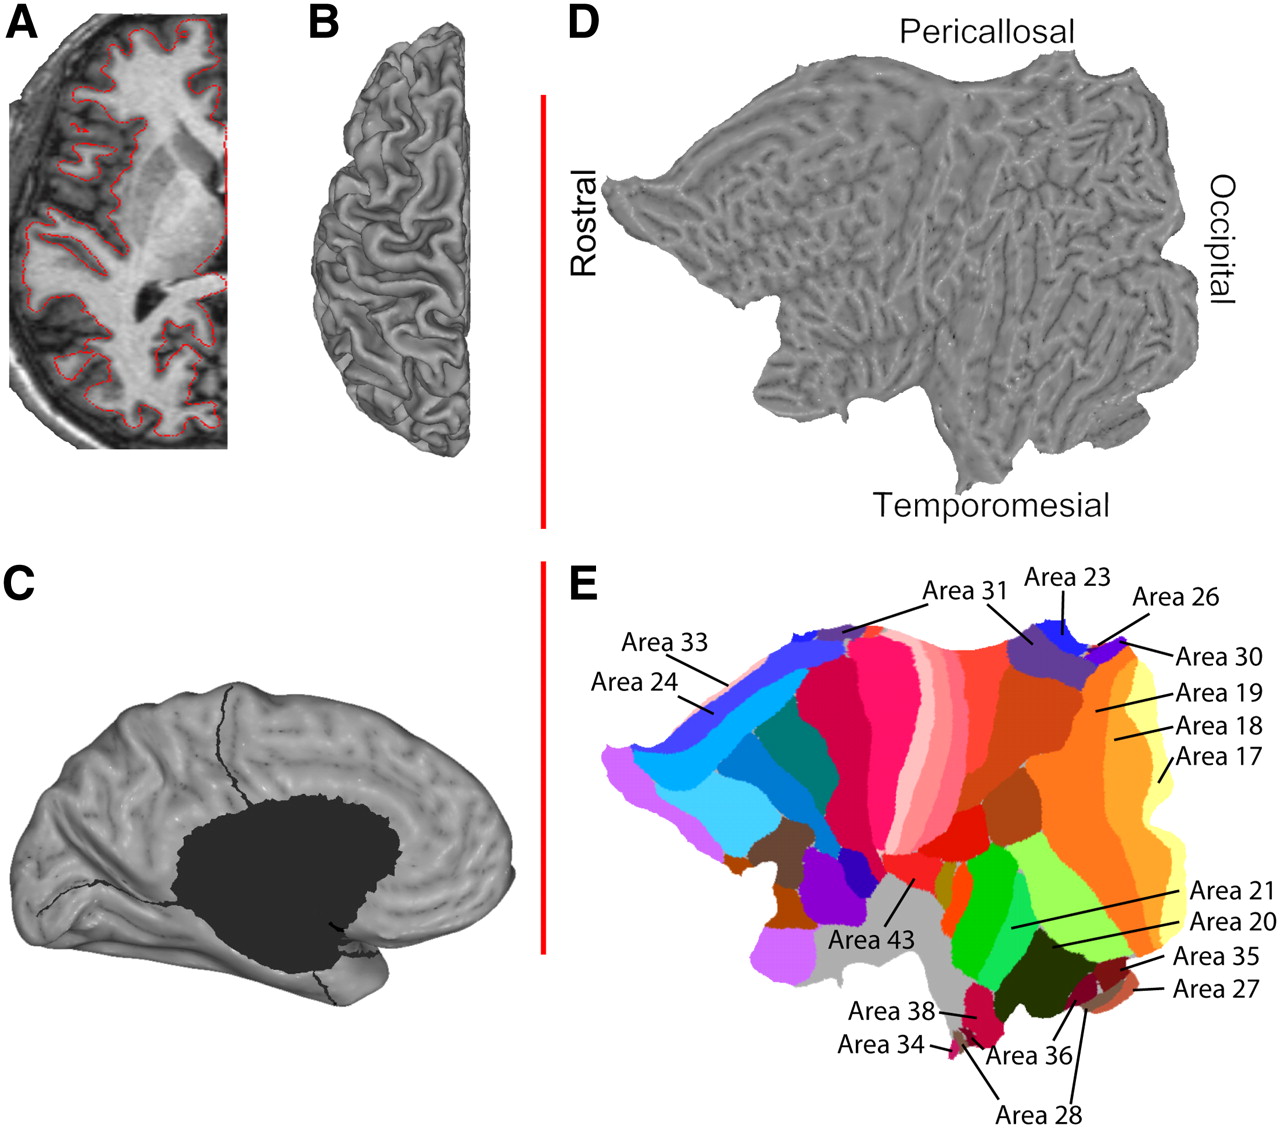
Averaged MR data were imported into SureFit/Caret software (David C. van Essen's laboratory, Washington University, St. Louis, MO; http://v1.wustl.edu/) (22). The left-sided, dominant hemisphere's cortical sheet was delineated (Fig. 1A) and reconstructed into a mesh of surface nodes (Fig. 1B) as described by Drury et al. (23). Using Caret software, mesial structures—including the corpus callosum, the lateral ventricle, and parts of the hippocampus—were excised from individual cortical reconstructions (Fig. 1C), yielding a surface with an average number ± SD of 60,606 ± 4,544 nodes. Those were then projected into flat (for viewing) (Fig. 1D) and spheric (for surface registration, warping) representations. Spheric representations were warped to the Human Colin atlas (24), a single-subject atlas containing a manual parcellation into Brodmann areas using gross anatomic landmarks. The warping process requires manual definition of the central sulcus and the sylvian fissure. These landmarks, together with the calcarine sulcus as defined during flattening, act as driving forces deforming the volunteer's individual anatomy onto the anatomy of the atlas. The generated deformation parameters were then applied in reverse to the cortical parcellation of the Human Colin atlas representing Brodmann's areas, thus generating individual Brodmann parcellations (Fig. 1E presents key areas). Brodmann parcellation of each volunteer's individual anatomy was thus created (supplemental materials are available online only at http://jnm.snmjournals.org; Supplemental Figure 1 presents a side-by-side comparison of the Colin atlas and Brodmann's original parcellation). All of these steps were performed using the procedures outlined in Caret's Flattening Tutorials (http://brainmap.wustl.edu/resources/caretnew.html).

Cortex is delineated (A) and reconstructed (B). Cuts are applied to avoid gross distortions (C), and individual surfaces are subsequently flattened (D) and overlaid with the Colin atlas (E).
CMRGlc was mapped to the surface nodes using Caret's surface mapping algorithm. For each node, CMRGlc was measured in an ellipsoid gaussian distribution (i.e., a gaussian with different full widths at half maximum [FWHMs] in-plane and perpendicular to the plane) centered on the node in question within a cutoff radius of 1.5 mm around it for an estimated average cortical thickness of 3 mm (6). The in-plane FWHM of the ellipsoid was set to 1 mm; FWHM orthogonal to the cortical sheet was 2 mm. CMRGlc can then be viewed on any representation of the individual's surface.
Metabolic data were exported for all 9 subjects for each of Brodmann's areas. These areal metabolism data were imported into SAS software (The SAS Institute) for data aggregation and statistical analysis. Using SAS software, average CMRGlc and SD across volunteers for Brodmann's areas were computed.
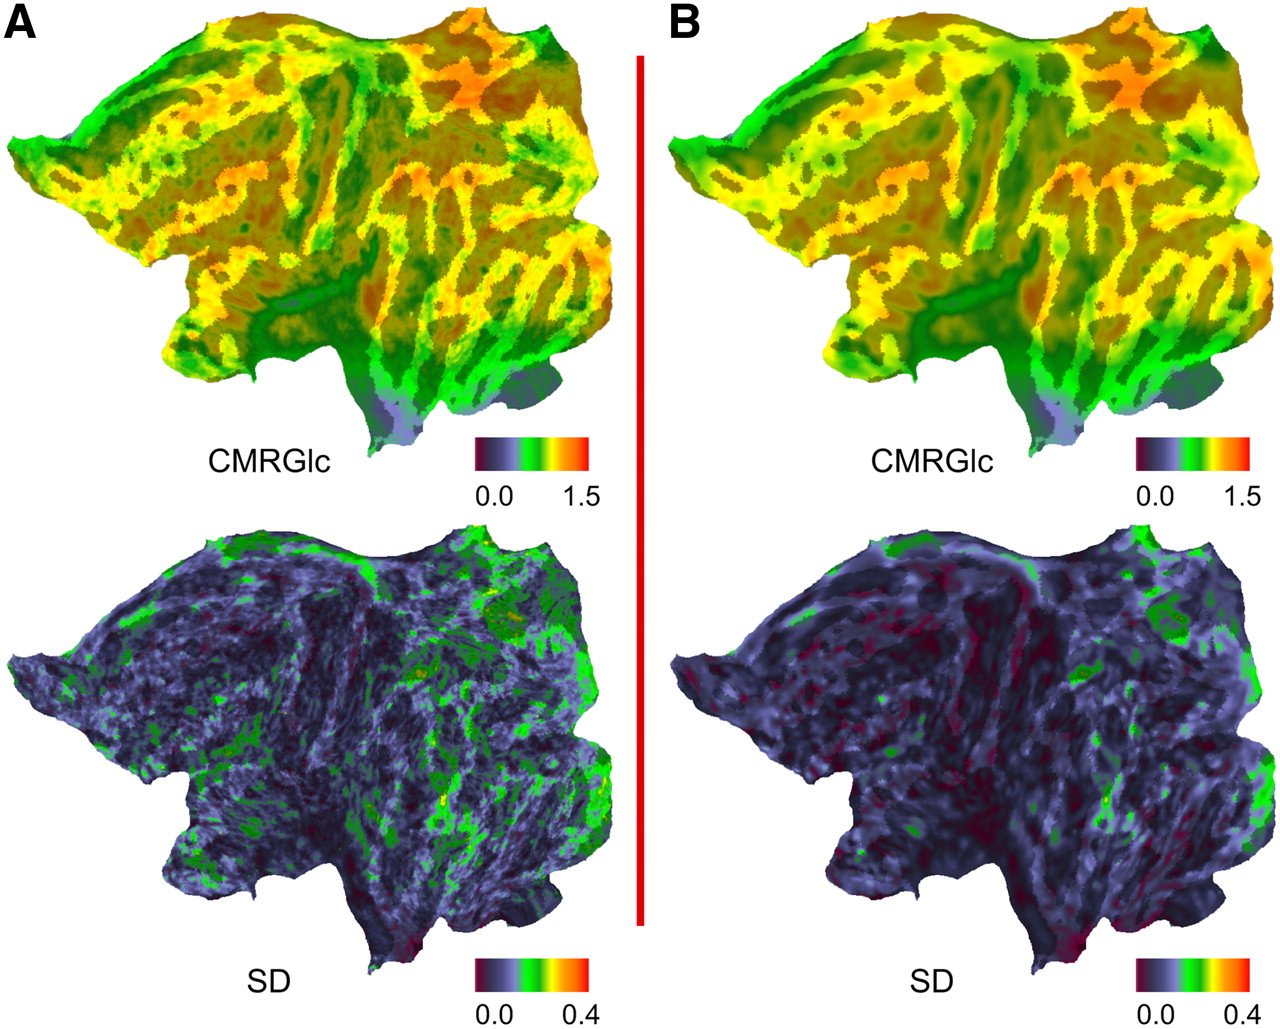
For node-by-node maps, individual CMRGlc data were warped to the Human Colin surface representation using the previously generated deformation maps. Node-by-node averages and empiric intersubject SD were computed from intensity-normalized individual CMRGlc (Fig. 2; Supplemental Fig. 2 presents a 3D lateral projection) using Caret. These maps were then smoothed to remove residual high-frequency image noise and to assess the improvement of the signal-to-noise ratio over unsmoothed data.

Node-by-node averages and intersubject SD computed from intensity-normalized (mean-scaled) individual CMRGlc across all 9 subjects, both without (A) and with (B) prior 2D smoothing of individual data.
For smoothing, distance-weighted averages for each node i at position Pi with neighbors Ψi were calculated in Caret according to with α acting as a weighting parameter, set to 80% to reflect an average of 5 or 6 neighbors per node. The average internode distance on the convexity of the hemisphere is 0.5 mm. Thus, 5 iterations of the algorithm were used to generate smoothing within a 2.5 mm diameter around the node in question.
To generate estimates of group sizes for a hypothetical study on the HRRT using surface registration, values of intersubject SD found in this way were subjected to statistical power analysis using SAS software; sample sizes were calculated for group comparison studies at a desired power of 90% minimum with a type I error level of 5%.
RESULTS
Table 1 summarizes average CMRGlc and SD across subjects for all Brodmann's areas studied, except areas 34 and 25, which were frequently lost during excision of mesial structures. Figure 2 shows mean CMRGlc and SD on a flattened surface representation, both before and after smoothing.
Regional CMRGlc and SD Across Subjects for Brodmann's Areas
Interindividual CMRGlc Recovery
On inspection, node-by-node average maps of CMRGlc show uniform recovery of metabolism for surface registration. Conventional scanners show systematic variation of CMRGlc with underestimation of gyral metabolism due to their relatively low FWHM. On inspection, HRRT data still exhibit a slight drop in CMRGlc at the crown of the gyri and in the depth of the sulci but not the systematic sulcus-to-gyrus contrast expected from lower-resolution systems.
Keeping in mind that the heterotypical cortex is in most cases expected to use less glucose than the isocortex (25–27), surface registration preserves the differences in CMRGlc between cytoarchitectonically distinguished areas of the human brain across multiple subjects: Low regional values (<30 μmol/100 g/min) in cortical flattening CMRGlc are present in areas 20, 26, 27, 28, 33, 35, 36, and 38. All but 2 of these areas are heterotypical according to Brodmann—that is, they do not exhibit the classic 6-layered architecture of the isocortex. The exceptions are the adjacent areas 38 and 20. Area 20 blends into areas 38 and 37, whereas area 38 itself blends into both a heterotypical area (area 36) and 2 other isocortical fields (areas 21 and 22).
Area 33 poses a formidable challenge to any type of image registration, as it is a narrow, heterotypical strip of just 1.6 mm thickness along neighboring isocortical area 24 (28). Using HRRT scanning and cortical flattening, we obtained 17% lower CMRGlc for area 33 compared with area 24, indicating successful separation of iso- and allocortical fields.
A traditional analysis with manually defined regions in a similar group on the same scanner (27) reported low values in hippocampal structures comparable to those found in surface analysis—another indication of successful preservation of structural congruence across subjects.
Homogeneity of Regional Values
Intraregional variability of CMRGlc is 4.903—that is, 15% of the mean (Table 1). Small regions are more likely to have higher intraregional SD if they are surrounded by neighboring regions with a different metabolic profile, as is apparent, for example, in area 43. This can be explained by the way the Brodmann areas were defined in this study. Whereas some regions' positions are relatively fixed with respect to anatomy (e.g., primary motor/sensory, primary visual), others are more variable in their local gyration pattern as well as the position of their borders relative to gyration (11). Areas 19 and 21, too, exhibit comparatively high intraregional SD, despite being larger in size. Although subjects were asked to keep their eyes closed, portions of areas 19 and 21 are activated in mental imagery of space motion and objects (29), and it is possible that this has impacted the intraregional SD measurements.
In the precuneal cortex, high SD and high CMRGlc are expected as a biologic phenomenon (Herholz et al. (30)), both of which are reflected in surface analysis.
Interindividual Variability of Measurements
Regional interindividual SD is assessed on the original, unsmoothed, and unscaled data (Table 1). Around the mesial structures excised during flattening, there are regions with comparatively high SD values. The small area covered by each of them plays a role as SD inversely scales with the square root of the number of nodes within a given region; another factor could be varying degrees of excision when making the cuts to remove mesial structures during flattening—visible in areas 33 and 26 (Fig. 1C).
If, on the other hand, too little surface is removed, there may be some callosal matter included in the measurement volume. The unusual combination of high interindividual SD, low intraindividual SD, and low CMRGlc in area 26 may be due to varying amounts of accidentally incorporated callosal nodes, as it is located in a vulnerable position on the occipital border of the corpus callosum.
The node-by-node SD maps, generated from individual maps normalized for individual average CMRGlc, show that surface registration performs particularly well with low SD on the convexity of the hemisphere, but SD is higher in mesial structures (Fig. 2). The average SD over all nodes of the surface is 0.135. Higher SD values in some regions may reflect biologic variability and have been identified previously in mesial structures and frontal and parietal association cortices (30).
Smoothing surface data in a topologically correct fashion yields an SD of 0.111, while avoiding contamination from noncortical compartments. Also, this process helps fulfill prerequisites to further statistical processing using random field methods in the future.
Using the SD values presented, statistical power analysis was performed for a hypothetical group study with decreases in CMRGlc of 10%, 20%, and 30% between groups (1-tailed). The region studied is expected to have a level of variance comparable to that of the cortex as a whole, and we further assume that both groups would exhibit SD values similar to those established here (0.111). Then, the number of subjects per group that are needed to detect this CMRGlc decrease with a power of at least 90% are 44, 14, and 8 subjects per group for the estimated decreases of 10%, 20%, and 30%, respectively.
DISCUSSION
We have shown that the use of surface-based registration on HRRT data is feasible. It delivers high sampling fidelity of the cortical sheet and gives us the ability to differentiate metabolism of cortical regions, to preserve much of the resolution of the dataset, and to detect metabolic decline with manageable group sizes.
Cortical flattening allows viewing of the complete cortical metabolism of a subject simultaneously, even where the cortex is deeply buried in sulcal folds. This is of particular value in the human brain, where a large proportion of the cortex is buried in the sulci and would not be readily visible on projections in native space (12,31). Partial-volume effects—which cause systematic variation of CMRGlc with cortical anatomy—are minor with the HRRT, indicated by a very smooth distribution of metabolic values with only slight residual partial volume visible at the roofs of the gyri and in the depths of the sulci (Fig. 2). The fidelity of sampling and 2D registration allow preservation of unique metabolic characteristics of individual cortical portions, enabling insight into differing patterns of glucose consumption, as is evident in the case of heterotypical and isocortical areas of the brain. Flattening-based analysis correctly identifies relatively low CMRGlc in heterotypical areas while at the same time performing overall recovery of cortical metabolism comparable to manually placed regions of interest. Interestingly, higher-order processing centers such as secondary visual and sensorimotor processing fields (premotor, parietal associaton cortex) exhibit a higher resting-state CMRGlc than their lower-order counterparts, possibly due to their more complex nature.
High spatial resolution together with high discriminatory power allow for detection of small changes of metabolism in group studies. As in volume processing, statistical power can be enhanced by smoothing to decrease study group sizes, trading off against resolution, which is useful when studying rare cortical diseases where no large numbers of subjects can be recruited. With decreasing group size, cortical flattening helps save on scanning cost and exposes fewer volunteers to ionizing radiation.
In summary, the combination of HRRT PET and surface-based analysis using coregistered MRI offers the highest fidelity mapping of human CMRGlc available to date, providing standard maps of metabolism, its variability, as well as quantitative regional values (Fig. 2; Table 1).
The benefit of surface analysis is expected to be particularly strong in hippocampal areas and in the frontal lobe with its more variable pattern of gyration (32). Metabolic change in hippocampal areas is crucial in mild cognitive impairment and the early stages of Alzheimer's disease (33), and flattening may help analyze cortical changes in the very early stages.
CONCLUSION
We have demonstrated the feasibility and the value of surface registration as a promising tool to assess cortical function and pathology from HRRT 18F-FDG PET measurements, measuring strictly within the cortical compartment (13,22,34), preserving metabolic differences between cortical areas with different cytoarchitecture, and minimizing missegmentation issues that plague conventional volume-based techniques. This property is especially desirable in adjacent sheets of cortical gray matter, where voxel-intensity-driven volume registration cannot distinguish between separate banks of cortex.
Although surface registration offers several advantages over classic volume-based normalization in terms of cortex targeting and achievable resolution, these need to be balanced with the additional effort to invest in terms of MRI and manual interaction in the course of surface-based analysis. Given the high cost of PET, and given the desire to minimize exposure to ionizing radiation, this extra effort is well warranted. Also, recent advances in surface extraction from MRI will permit considerably reduced user interaction, bringing the technique another step closer to routine applicability.
Acknowledgments
The authors thank Professor Klaus Lackner's team in the Department of Radiology at Cologne University for assistance with MRI. This research was funded in part by the Max Planck Society, Käthe Hack Foundation, and the U.K. BBSRC.
Footnotes
-
COPYRIGHT © 2008 by the Society of Nuclear Medicine, Inc.
References
- Received for publication June 26, 2007.
- Accepted for publication September 21, 2007.


Jump to section
Related Articles
Cited By...
- No citing articles found.