


Abstract
PET with 15O gas has been used for the quantitative measurement of cerebral blood flow (CBF), cerebral metabolic rate of oxygen (CMRO2), oxygen extraction fraction (OEF), and cerebral blood volume (CBV) in humans. However, several technical difficulties limit its use in experiments on small animals. Herein, we describe the application of the 15O gas steady-state inhalation method for normal anesthetized rats. Methods: Eight normal male Sprague–Dawley rats (mean body weight ± SD, 268 ± 14 g) under anesthesia were investigated by 15O-labeled gas PET. After tracheotomy, an airway tube was placed in the trachea, and the animals were connected to a ventilator (tidal volume, 3 cm3; frequency, 60/min). The CBF and OEF were measured according to the original steady-state inhalation technique under artificial ventilation with 15O-CO2 and 15O-O2 gases delivered through the radioactive gas stabilizer. CBV was measured by 15O-CO gas inhalation and corrected for the intravascular hemoglobin-bound 15O-O2. Arterial blood sampling was performed during each study to measure the radioactivity of the whole blood and plasma. MR image was performed with the same acrylic animal holder immediately after the PET. Regions of interest were placed on the whole brain of the PET images with reference to the semiautomatically coregistered PET/MR fused images. Results: The data acquisition time for the whole PET experiment in each rat was 73.3 ± 5.8 (range, 68–85) min. In both the 15O-CO2 and the 15O-O2 studies, the radioactivity count of the brain reached a steady state by approximately 10 min after the start of continuous inhalation of the gas. The quantitative PET data of the whole brain were as follows: CBF, 32.3 ± 4.5 mL/100 mL/min; CMRO2, 3.23 ± 0.42 mL/100 mL/min; OEF, 64.6% ± 9.1%; and CBV, 5.05 ± 0.45 mL/100 mL. Conclusion: Although further technical improvements may be needed, this study demonstrated the feasibility of quantitative PET measurement of CBF, OEF, and CMRO2 using the original steady-state inhalation method of 15O-CO2 and 15O-O2 gases and measurement of CBV using the 15O-CO gas inhalation method in the brain of normal anesthetized rats.
Cerebral blood flow (CBF) and metabolic rate of oxygen (CMRO2) have been extensively studied in humans using PET with 15O-labeled gases and H215O to elucidate the brain functions (1) and hemodynamic and metabolic compromise in stroke patients (2). However, several difficulties restrict the application of this method to experimental animals.
The major difficulty of 15O gas PET in small animals is related to the delivery of 15O gas to the brain. Inhaled radioactive gases exist in the nasal and oral cavities and the lung, which may disturb accurate measurement of the intracranial radioactivity because of increased random coincidence events and scattered photons. The second is the limited volume of blood that can be sampled from small animals to measure the arterial input function, which is essential for quantitative analysis. The third is the limited volume of the tracer solution that can be injected into small animals. To overcome these technical difficulties, some previous studies have applied 15O gas inhalation through a tracheal tube (3), venous injection of 15O-O2 hemoglobin–containing red blood cells (4,5), 15O-CO or O2 hemoglobin–containing vesicles (6), or liposome-encapsulated hemoglobin (7). For quantitative measurements, the radioactivity of the cardiac chambers has been measured (3). A β-probe was developed to directly measure the arterial input function, without any need for blood sampling (8). Furthermore, programmed injection devices have been developed to achieve steady-state radioactivity of the brain (9). However, there have been no reports of quantitative measurement of CBF, cerebral blood volume (CBV), oxygen extraction fraction (OEF), and CMRO2 in the rat brain by 15O-gas inhalation PET. The purpose of this study was to establish a standard methodology to evaluate the cerebral circulation and oxygen metabolism in rats, to allow the evaluation of cerebral ischemia in a rat model. We developed a method to measure CBF, CBV, OEF, and CMRO2 in anesthetized rats according to the original 15O gas steady-state inhalation method, which was used in clinical studies (10–12). We paid special attention to administration of the 15O gases through the trachea under a steady-state supply of 15O-CO2 and 15O-O2. We describe here the feasibility of the method and the quantitative measurement of CBF, CBV, OEF, and CMRO2 in the brains of normal rats under anesthesia. We performed all studies using a clinical PET camera. The feasibility of the PET camera for small-animal imaging was evaluated by phantom experiments as well.
MATERIALS AND METHODS
Preparation of 15O Gas
15O gas was produced by a 14N(d,n)15O nuclear reaction with 2.0% O2 (for 15O-CO and 15O-O2) or 2.0% CO2 (for 15O-CO2) added to an N2 gas target at a 12-MeV-proton 20-μA current accelerated by the CYPRIS HM 12S in-house cyclotron (Sumitomo Heavy Industry). The concentrations and flow rates of 15O-O2, 15O-CO, and 15O-CO2 were controlled by the CYPRIS gas stabilization module, G3-A (Sumitomo Heavy Industry). Flow volume from the gas stabilizer system was regulated by a mass flow controller to achieve a constant supply of radioactivity.
PET and MR Scanner
The PET study was performed with the Headtome-V PET scanner (Shimadzu Corp.). The performance of the scanner has been described previously (13). PET data were collected in 2-dimensional (2-D) mode (septa extended) and reconstructed by the 2-D filtered backprojection method with Butterworth filter (1-mm cutoff frequency). The spatial resolution was 4.0 mm in full width at half maximum (FWHM) in the transaxial direction and 4.5 mm in FWHM in the axial direction. The voxel size was 0.5 × 0.5 × 3.125 mm. The PET data were not corrected for attenuation or scatter.
The PET and MR studies were performed with an MR-compatible acrylic holder held at the same position in all the experiments. MR imaging was performed with the same holder immediately after the PET acquisition, using a permanent magnet MR imaging system of 0.3 T (Hitachi Metal; NEOMAX, Ltd.) (14). The MR imaging sequence was a fast low-angle shot (repetition time/echo time, 50/5 ms; 64 slices; field of view, 60 mm). Position shift between the PET and MR images was confirmed by a phantom experiment, and coregistration of the PET and MR images was automatically performed using in-house fusion software (gPET/MRI).
Estimation of Partial-Volume Effect
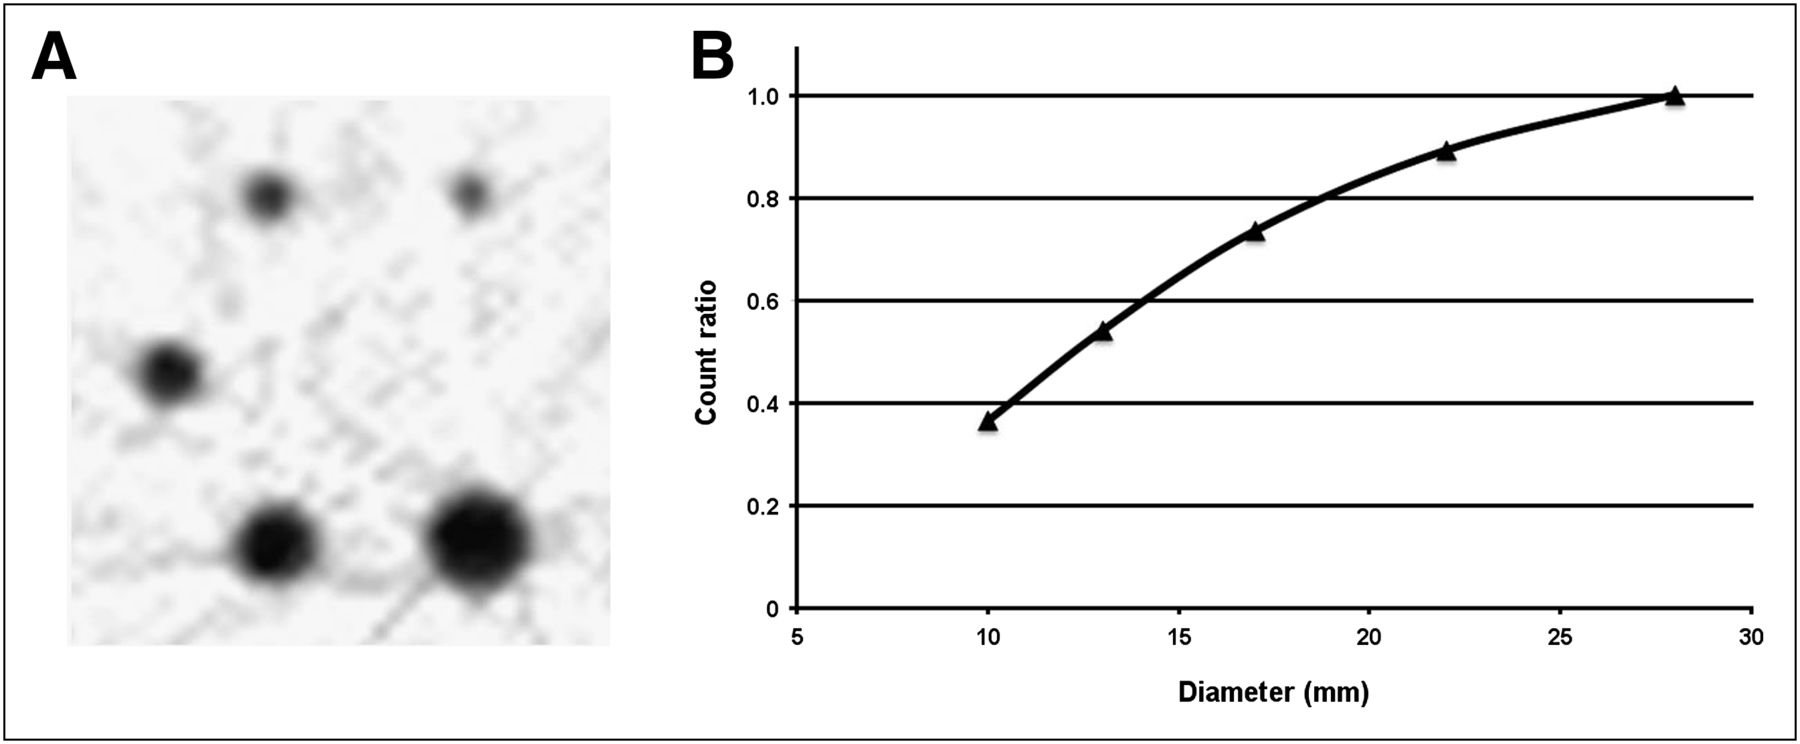
The body phantom of the National Electrical Manufacturers Association was used for the evaluation of the partial-volume effect. Five spheres of different sizes were placed inside the water (diameter, 10, 13, 17, 22, and 28 mm) and filled with 15O-H2O of the same radioactivity concentration. The scanning time was 15 min, and the PET images were reconstructed using a 2-D filtered backprojection method with attenuation correction. Regions of interest (ROIs) were placed on each sphere, and the mean count ratios to the 28-mm-diameter sphere were plotted against the diameter.
Effect of Attenuation Correction
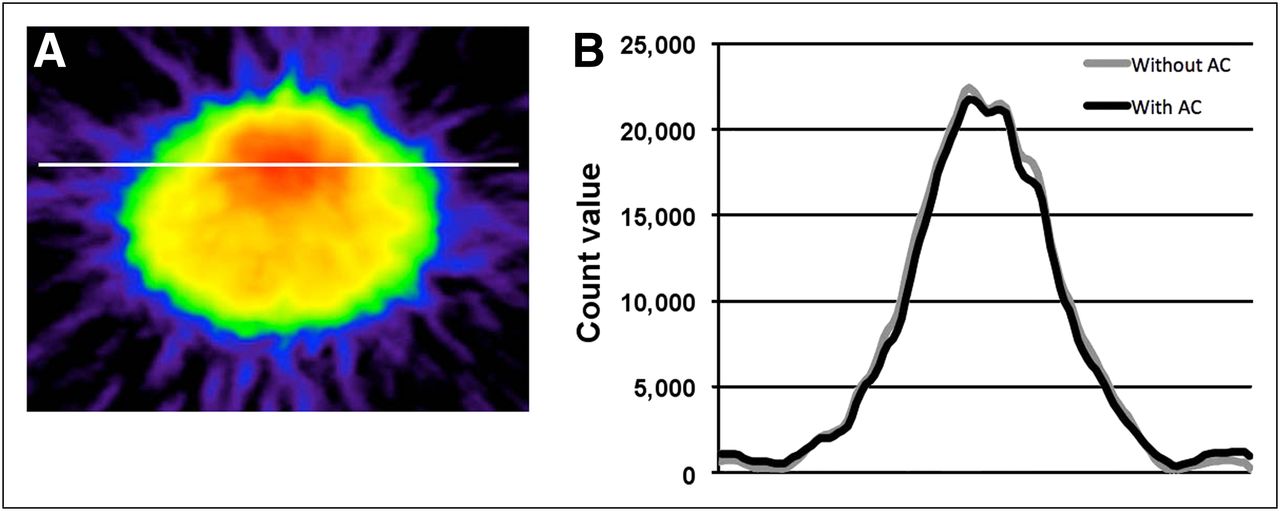
Transmission scanning with a 68Ge–68Ga rod source was performed in the brain of a sacrificed rat to prepare an accurate attenuation map (scan duration, 167 min). The 15O-O2 gas PET images were reconstructed both with and without attenuation correction. Profile curves of the brain count were compared between the images with and without attenuation correction.
Effect of Scatter Correction
The lung phantom (rubber balloon) was placed in the pleural cavity of a sacrificed rat after the lung was removed. PET was performed for 16 min under 15O-O2 ventilation (100 MBq/min, 180 mL/min). Then, scatter radiation from the lung was evaluated.
Cross Calibration Factor
Because of the limited volume of the blood samples, we tested the linearity of the cross calibration factor against the volume of plasma measured by a well counter. The radioactivity concentrations of 0.01, 0.025, 0.05, 0.10, and 0.20 mL of H215O solution were measured by the well counter. The radioactivity concentrations were corrected for physical decay and weight and plotted against the weight.
Animal Preparation and PET Measurements
Normal male Sprague–Dawley rats from Japan SLC Inc. were used for this investigation. Eight rats (8 wk old; mean body weight ± SD, 268 ± 14 g) were anesthetized with 2% isoflurane plus 100% oxygen during the arterial cannulation, followed later by intramuscular injection of midazolam (1.2 mg/kg of body weight), xylazine (4.8 mg/kg of body weight), and butorphanol (1.6 mg/kg of body weight). Arterial cannulation was performed on the femoral artery using a 0.8-mm polythene tube (n = 6) or on the tail artery using a Terumo 24-gauge indwelling catheter (n = 2). Tracheotomy was performed, and a flexible tube (6-French, 5 cm; Hanako Medical Products) was placed into the trachea to serve as an airway for the administration of 15O-gas. The airway tube was connected to the ventilator (SN-480-7-10; Shinano Seisakusho), and artificial ventilation was performed with room air (tidal volume, 3 cm3; frequency, 60/min). The rats were placed supine on the bed, and the airway tube was flexed to the distal side to exclude it from the transaxial field of view of the brain.
15O-CO2, 15O-O2, and 15O-CO gas were administered, where the order of 15O-O2 and 15O-CO2 studies was randomized, with room air as the carrier (50, 100, and 100 MBq/min, respectively). The flow volume and radioactivity concentration were automatically maintained through the stabilization module, which was directly connected to the artificial ventilator. The PET measurements were started with the administration of each 15O-labeled gas. Inhalation of the 15O-CO2 and 15O-O2 gas was continued during the PET measurements for 16 min (60 s × 16 frames). The inhalation time of the 15O-CO gas was 3 min, and the PET measurements were continued for a total of 12 min (60 s × 12 frames). Arterial blood sampling (0.1 mL) was performed from the arterial cannula during the steady-state PET acquisition in the 15O-CO2 and 15O-O2 studies (13 and 16 min after the start of scanning, respectively) and 7 min after the start of the scanning in the 15O-CO study. The radioactivity and weight of the whole blood and plasma after centrifugation (3,000 round/min, 3 min) were measured with a well scintillation counter (BeWell; Molecular Imaging Labo), and the radioactivity concentration of each blood sample (cps [count per second]) was corrected for the decay from the sampling time.
Systemic blood pressure (BP) and heart rate (HR) were indirectly measured with a tail-cuff apparatus during the study (BP-98A-L; Softron). Arterial blood gas was analyzed using the blood samples collected during the 15O-CO2 and 15O-O2 PET acquisition (i-STAT system; Abbott Point of Care Inc.), and pH, partial pressures of carbon dioxide (PaCO2) (mm Hg), partial pressures of oxygen (PaO2) (mm Hg), arterial oxygen saturation (SaO2) (%), hemoglobin (Hb) (g/dL), and hematocrit (Ht) (%) were measured. The rectal temperature was also monitored and automatically maintained at 37° with a body heating pad system (TR-200; Muromachi Kikai Co., Ltd.).
Experiments in Ischemia Model
In 2 rats, the left middle cerebral artery (MCA) was occluded intraluminally by inserting a nylon 4-0 surgical monofilament with dental impression material into the left common carotid artery (15). PET was performed at 30 min after the occlusion without reperfusion.
All animal experiments were performed in compliance with the guidelines of the Laboratory Investigation Committee of Osaka University Graduate School of Medicine.
Quantitative Data Calculation
Regional CBF, regional OEF, and regional CMRO2 were calculated by the steady-state method (11,12). Regional CBV was calculated after brief administration by inhalation of 15O-CO gas, which was tightly bound to hemoglobin. In the 15O-CO2 study, the activity measured in the brain was from 15O-labeled water, which was transferred from C15O2 to H215O in the pulmonary alveolar capillaries. In the 15O-O2 study, the activity in the brain was considered to be a sum of 3 components: 15O-labeled water produced as a metabolite of 15O-O2 in the brain tissues, recirculating 15O-labeled water, and 15O-O2 fixed to hemoglobin in the vascular compartment. Quantitative values were calculated using the following equations:

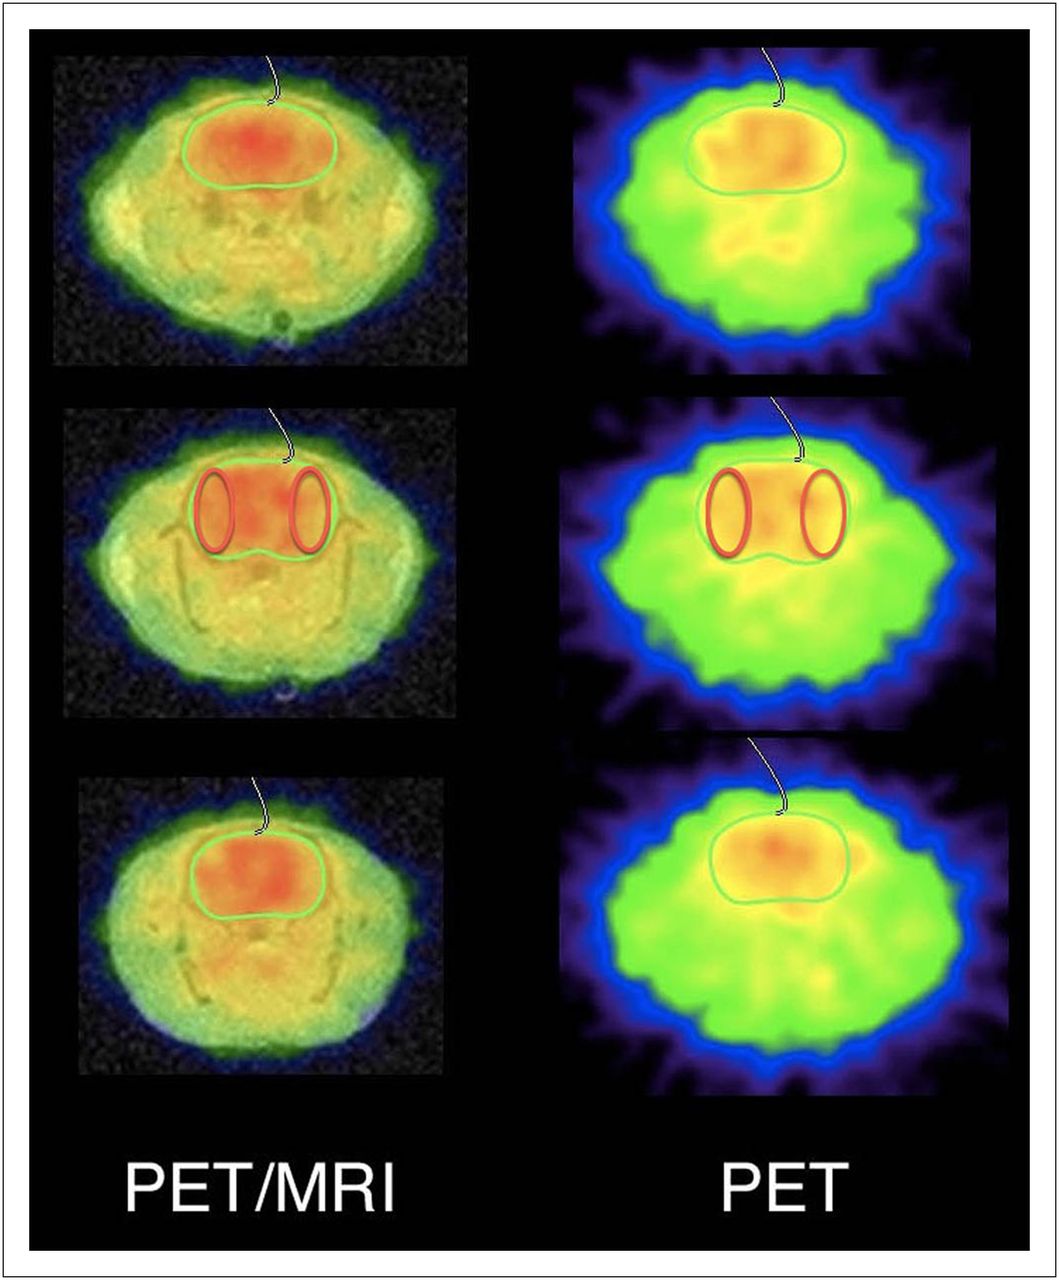
Location of ROIs on whole-brain PET slice at maximal cross-section and adjacent cranial and caudal slices. Green ROI = whole brain; red ROI = MCA territories.
RESULTS
Figure 2A shows the PET images of a spheric phantom filled with H215O water for the evaluation of partial-volume effect. The count ratios were 0.36, 0.54, 0.73, and 0.89 for spheres measuring 10, 13, 17, and 22 mm in diameter, respectively, as compared with the count for 28-mm spheres, which provided full recovery (Fig. 2B). Because the brain volume of rats corresponds to that of 15-mm spheres, the partial-volume effect for the whole brain was calculated as 0.7. Figure 3A shows a coronal PET image of the rat brain after 15O2 inhalation during the steady state. The profile curves of radioactivity at the line passing the basal ganglia are illustrated with and without attenuation correction in Figure 3B. The profile curves with and without attenuation correction were identical. Figure 4 shows the coronal images of a lung phantom placed in the pleural cavity of a sacrificed rat ventilated with 15O2 gas. High radioactivity was found in the pleural cavities bilaterally. No radioactivity from the lung phantom was detected in the brain, indicating that the effect of scatter events from the lung was small. Figure 5 shows a plot of the radioactivity (cps/g) concentrations against the sample volumes of the H215O solution by well counter. The radioactivity was constant for volumes in the range of 0.025–0.20 mL.

PET image of NEMA phantom (A) and curve constructed by plotting mean count ratios against sphere diameters (B).

15O-O2 PET image of brain (white line indicates location of profile curves) (A) and profile curves of brain with and without attenuation correction (B). AC = attenuation correction.

Coronal PET (A) and PET/MR (B) images of lung phantom ventilated with 15O-O2 gas.
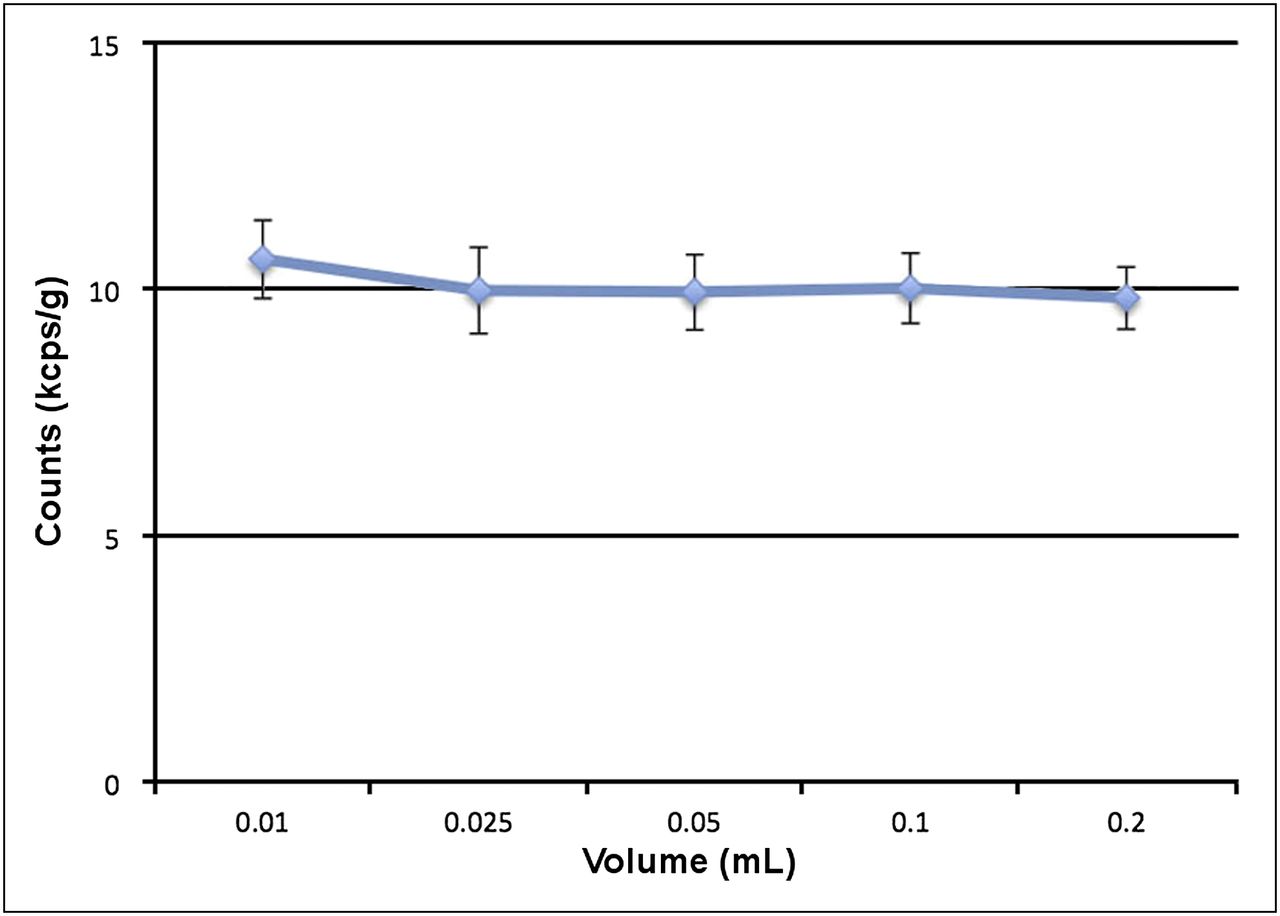
Relationship between radioactivity (kcps/g) and sample volume of H215O solution by well counter.
The mean systolic and diastolic BPs, PaO2, PaCO2, hemoglobin concentration, hematocrit, and SaO2 are summarized in Table 1. The BP remained stable during the PET measurements.
BP, HR, and Arterial Blood Gas Data During PET Measurement
The total time taken for the entire PET scan in each rat was 73.3 ± 5.8 (68–85) min. In both the 15O-CO2 and 15O-O2 studies, the radioactivity count in the brain reached a steady state approximately 10 min after continuous 15O gas inhalation (Fig. 6).
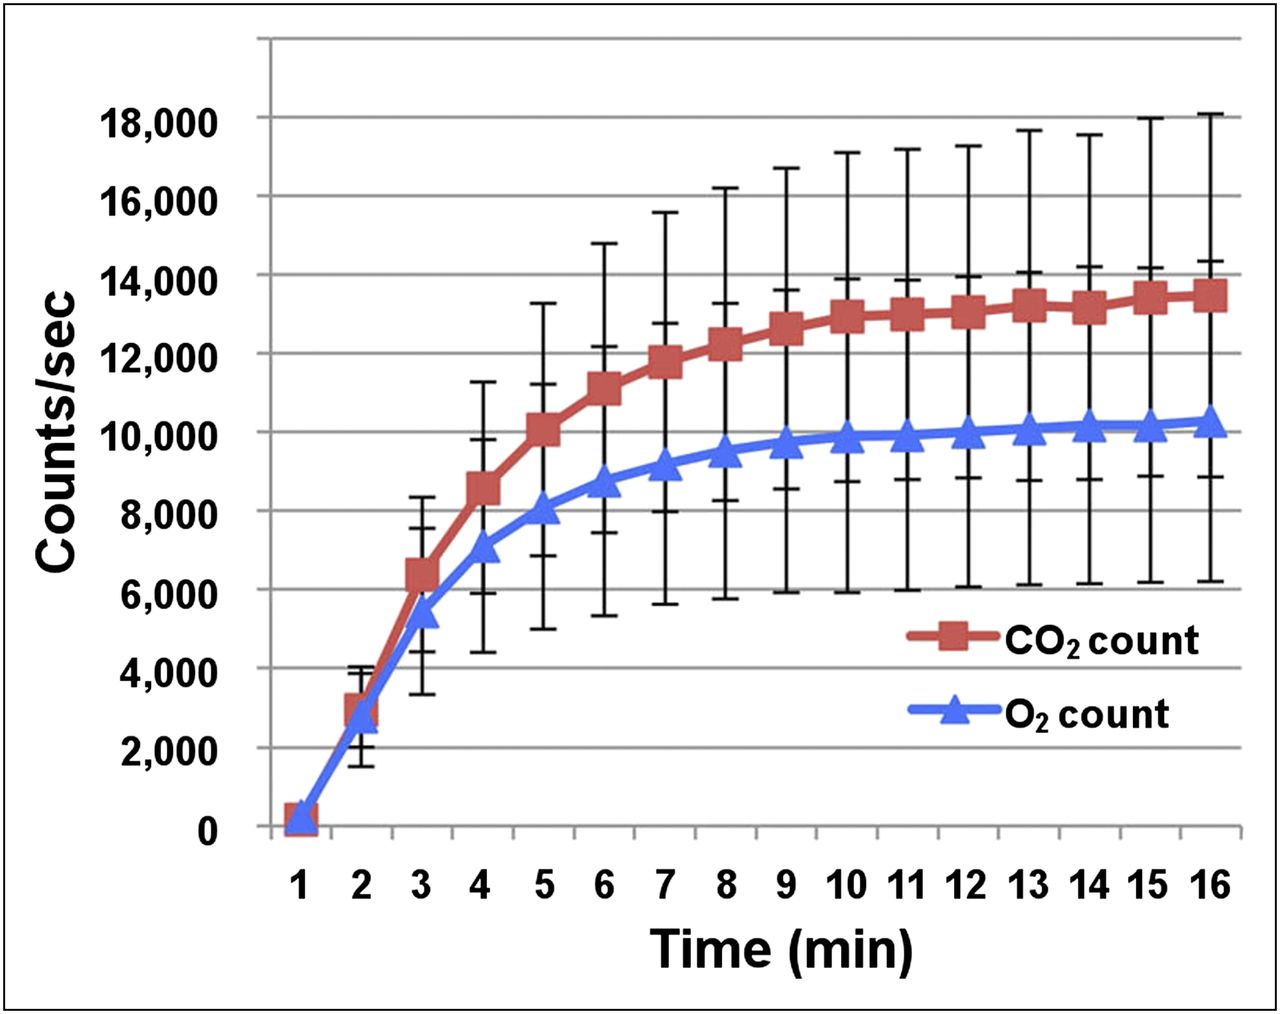
Time–activity curves in brain during continuous inhalation of 15O-CO2 and 15O-O2 gas. cps = count/s.
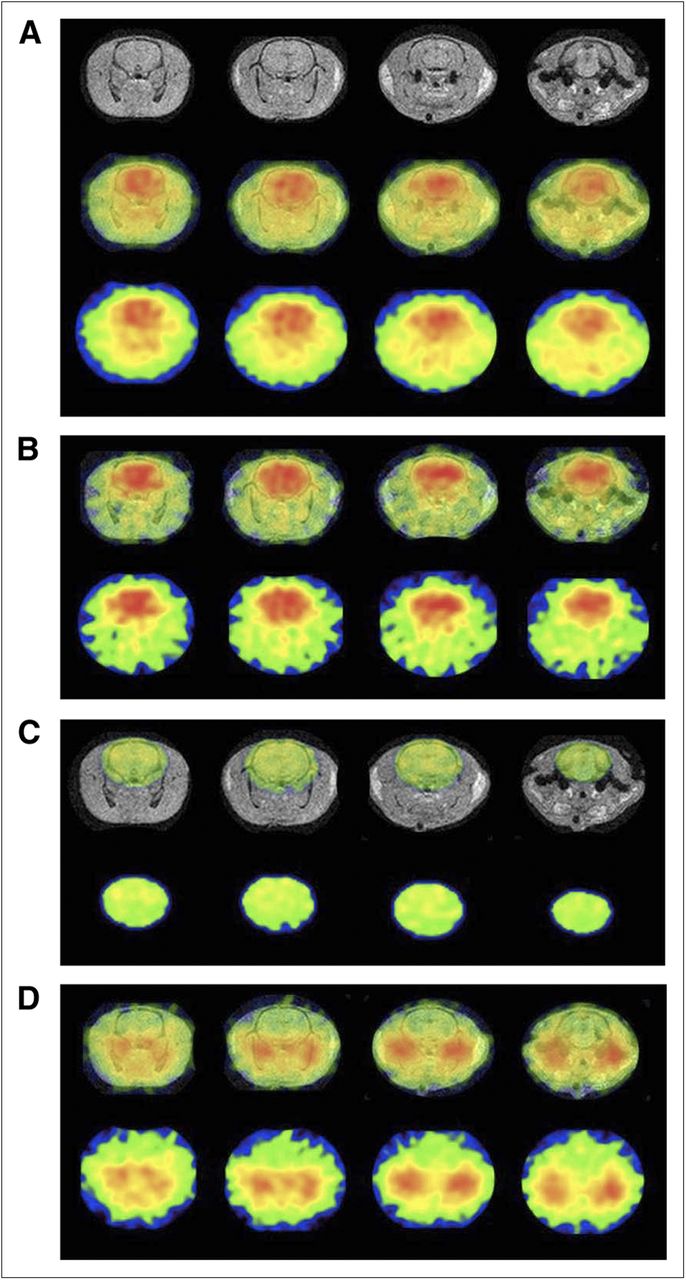
Quantitative PET data in the entire brain were as follows: CBF, 32.3 ± 4.5 mL/100 mL/min; CMRO2, 3.23 ± 0.42 mL/100 mL/min; OEF, 64.6% ± 9.1%; and CBV, 5.05 ± 0.45 mL/100 mL. Functional images of the CBF, CMRO2, OEF, and CBV are shown in Figure 7.

MR (upper), PET/MR fusion (middle), and PET (lower) images of CBF (A). PET/MR fusion (upper) and PET (lower) images of CMRO2 (B), OEF (C), and CBV (D). Images in same column indicate same transaxial cross-section of brain (A–D).
For the findings in the rat model of left MCA occlusion, both rats showed decreased CBF and CMRO2 in the ipsilateral MCA territory, and one of the rats showed increased OEF in the ipsilateral MCA territory. Quantitative values in the ipsilateral and contralateral MCA territories were as follows: CBF, 18.6/30.8 mL/100 mL/min; OEF, 74.3%/65.4%; and CMRO2, 1.79/2.64 mL/100 mL/min.
DISCUSSION
We have reported a method to measure the CBF, CBV, OEF, and CMRO2 in the brain of anesthetized rats by PET, according to the original 15O-CO2 and 15O-O2 steady-state inhalation technique combined with 15O-CO inhalation. The methodology in this study is the same as the steady-state method used in clinical PET examinations (10–12).
Yee et al. performed tracheal administration of 15O-O2 gas through a surgically placed airway tube in anesthetized rats (3). The 15O-O2 was stored in a syringe (74–111 MBq, 5 cm3) and insufflated into the lung. Their study indicated that 15O-O2 administration through the trachea did not affect the image quality of the brain. Tracheotomy also had no significant influence on the physiologic conditions of the rats during the experiments. In our method, one end of the airway tube was inserted into the trachea after tracheotomy and fixed tightly to avoid leakage of the 15O gases. The other end of the airway tube was connected to the ventilator, which continuously supplied the 15O gases at a controlled rate of radioactivity. As shown in Figure 4, no radioactivity in the brain was detected during the 15O-gas insufflation to the balloon phantoms located in the chest cavity. The present PET data acquisition in the 2-D mode was less sensitive to scatter events than acquisitions in the 3-dimensional mode. Quantitative measurement in 3-dimensional mode clinical PET can be achieved with proper scatter correction, just as in the 2-D mode (18). We intend to quantitatively measure 15O gas in a 3-dimensional-mode small-animal PET study in the near future.
It is essential, in the 15O gas steady-state inhalation method, to stabilize the radioactivity of the inhaled gases. Artificial ventilation was performed with a radioactive gas stabilization system in this study. The radioactivity distribution in the brain became stable by approximately 10 min after the start of the 15O-CO2 and 15O-O2 inhalation. There was a slight increase even after 10 min. The average increase of the count from 10 to 15 min was 3.4% in the CO2 study and 3.7% in the O2 study. These increases were relatively small as compared with the average variability in brain counts between 10 and 15 min (5.5%). We performed an experimental study for continuous monitoring of arterial BP in 3 rats. Systemic BP had been generally stable from 15 to 90 min after the start of anesthesia (data not shown). The biologic half-life of xylazine is 2–3 h in rats, which is sufficiently long to maintain a stable condition during the PET measurements.
In this study, 2 rats underwent 15O-O2 scanning before 15O-CO2 scanning, and the other rats were scanned in the opposite order. No systematic changes in CBF, OEF, or CMRO2 dependent on the order of scanning were observed.
The whole-body blood volume of the rats weighing about 300 g was estimated to be about 17 mL (19). Sampling of a large amount of blood may affect the physiologic condition of the rats. In the present study, only 0.2 mL of arterial blood was taken at each measurement, and the total volume of blood withdrawn was 0.5 mL. This volume was much smaller than that reported in previous studies (9,20). The small-volume sampling in this study was considered to have a negligible influence on systemic circulation.
We measured the radioactivity of whole blood and plasma, weighing around 0.025 g, by well counter to examine the volume dependency of the radioactivity count. It was confirmed that the measurement was accurate and that reproducibility was feasible for 0.025-g samples.
In previous studies, tissue attenuation of 15O was corrected by means of transmission data acquired using the external rod source of 68Ge–68Ga (9). The scan duration ranged from 30 to 60 min. When we performed a transmission scan, the duration of the total PET experiment almost doubled from 70 to 130 min. Furthermore, making tissue attenuation maps of small animals using a clinical PET device increases transmission bias and noise because of the large ring diameter. Underestimation by 4% was observed in the experimental study of a rat phantom of 3-cm diameter without attenuation correction, as reported in the previous study (21). Scatter fraction in the 2D mode was 13% in the human study according to the performance of our PET scanner (13). In our study, we could not perform attenuation and scatter correction because of the limitation of the PET scanner. However, we confirmed from our experimental studies that the tissue attenuation in the rat head and the scatter fraction from outside the brain were small. The fact that attenuation and scatter correction needed to be performed to improve the accuracy was a limitation of our study.
We monitored the systemic BP, body temperature, heart rate, hemoglobin concentration, PaCO2, PaO2, and SaO2.Among these parameters, the PaO2 (56.3 ± 9.3 mm Hg) was unexpectedly lower than the physiologic range and variable, compared with the other physiologic measurements. One possible reason was the slightly reduced oxygen concentration of the inhaled gas. The oxygen concentration of the gas from the radioactive gas stabilization system was 18.1% in 15O-O2 gas studies. In the target box for 15O-O2 production, the concentration ratio of cold O2 to N2 was 0.5%/99.5%. The 15O-O2 gas with N2 gas from the target box was transferred to the gas stabilizer system, and room air was mixed with the 15O-O2 gas while radioactivity concentration was adjusted. As a result, the oxygen concentration of the inhaled gas was lower than that of the room air because of the addition of the target gas, in which the main component was N2 gas. Another reason was the effect of the anesthesia used in this study. Reduction in the PaO2 after the administration of butorphanol, buprenorphine, and midazolam was reported from a previous rabbit study, and this effect was sustained for about 2 h (22). High variability in the PaO2 was probably due to the differences in individual reactions to the anesthesia. To maintain physiologic conditions and reduce the variability, the constitution of the inhaled gas should be readjusted by the addition of O2.
In previous PET studies, a bolus injection of 15O-labeled water (15O-H2O) was used for quantitative measurement of the CBF; the reported CBF values ranged from 35 to 51 mL/100 g/min (6,8,20). Kobayashi et al. reported a steady-state method consisting of a bolus injection followed by injection of 15O-H2O at slowly increasing doses with a multiprogramming syringe pump (9). The CBF value under chloral hydrate anesthesia was 49.2 ± 5.4 mL/100 g/min. The CBF value measured in our study was much smaller than these previously reported values. The first possible reason is underestimation due to the partial-volume effect. We used a clinical PET device with a larger spatial resolution (4.0 mm in FWHM). According to the phantom study, this underestimation was by approximately 70%, because the diameter of the rat brain is about 15 mm. The radioactivity count in the brain was divided by 0.70 to correct the partial-volume effect for full count recovery. This corrected count was substituted for Ct in the following equation described in the “Methods” section: regional CBF = λ/(Ca/Ct − 1/ρ). After correction for the partial-volume effect, we obtained a whole-brain CBF value of approximately 84 mL/100 mL/min, which is in agreement with the values obtained by the autoradiographic method (16) and the Kety–Schmidt method (23,24), the results of which are not influenced by the partial-volume effect. The second possible reason is the influence of anesthesia. Most previous studies used chloral hydrate, which is difficult to use because of its narrow margin of safety and lack of analgesic effect. The different anesthetic technique used might also have produced the differences in the results. The third reason is the influence of PaCO2 on the CBF. Hypocapnia causes reduction of the global CBF in the rat under isoflurane or halothane anesthesia (25). On the basis of studies using the steady-state method, Kobayashi et al. reported that the CBF was 49.2 ± 5.4 mL/100 g/min when the PaCO2 was 49.7 ± 3.9 mm Hg (9). In this study, the CBF was 32.3 ± 4.5 mL/100 mL/min when the PaCO2 was 36.6 ± 1.6 mm Hg. The lower CBF value in the present study was partly due to the lower PaCO2 levels. Another possible reason is that systemic underestimation by the steady-state inhalation method, compared with that in the bolus injection method, was partly due to the tissue heterogeneity between the gray and white matter (26).
Few PET studies have reported measurement of OEF. Reported values of OEF in rats under pentobarbital anesthesia are 54% ± 11% using the kinetic method with injectable 15O-O2 and 57% ± 13% using the surgical method based on the arterial–venous difference in oxygen concentration (4,20). Other studies using 15O-O2 hemoglobin–containing liposome vesicles reported OEF values in rats under chloral hydrate anesthesia of 61% ± 16% (6) and 56% ± 4% (27). OEF is a function of the 15O-O2/15O-CO2 count ratio. OEF is not significantly affected by the partial-volume effect, because the calculation involves canceling out by dividing the 15O-O2 count by the 15O-CO2 count in the brain tissue. The OEF value calculated in our study was a little higher than the previously reported values. The OEF values reported from other studies were also higher than those reported from human studies. The OEF values were 54%–61% in the normal rat study but only 44% in a normal human study (28). Previous studies reported higher OEF values in monkeys (54% ± 6%) and pigs (59% ± 9%) (29,30). Therefore, differences among species might be the reason for the high OEF in the rats in the present study. OEF elevation was observed in the MCA occlusion model, as in the human brain in our study. The OEF values were 74.3% and 65.4% in the ipsilateral and contralateral MCA territories, respectively. The capacity to adapt to flow decreases was observed in rats, just as in humans.
Yee et al. reported quantitative measurement of CMRO2 in the rat brain with briefly inhaled 15O-labeled oxygen gas (3). The measured CMRO2 value under α-chloralose anesthesia was 6.65 ± 0.48 mL/100 g/min. Temma et al. used an artificial lung to dissolve 15O-O2 in the blood and reported a CMRO2 value of 4.3 ± 1.3 mL/100 g/min under pentobarbital anesthesia (20). Another group used hemoglobin-containing liposome vesicles or liposome-encapsulated hemoglobin with 15O-O2 and reported CMRO2 values of 6.8 ± 1.4 (under chloral hydrate anesthesia) and 4.8 ± 0.2 mL/100 g/min (under ketamine and xylazine anesthesia), respectively (6,7). Kobayashi et al. recently reported a CMRO2 value of 6.2 ± 0.4 mL/100 g/min under chloral hydrate anesthesia as measured by the steady-state method with injection of 15O2 hemoglobin–containing vesicles (27). The CMRO2 value measured in our study (3.23 ± 0.42 mL/100 mL/min) was smaller than these previously reported values. However, after correction for the partial-volume effect, the CMRO2 was approximately 8.4 mL/100 mL/min, which is in agreement with the values (10.3 and 7.57 mL/100 mL/min) obtained by the method of Kety and Schmidt (23,24).
There have been no reports of measurement of the CBV in the rat brain by 15O-CO gas inhalation PET. This study evaluated all PET parameters (CBF, CMRO2, OEF, and CBV) by 15O-labeled gases with correction for intravascular hemoglobin-bound 15O2. Kobayashi reported a mean value of the CBV of 4.9 ± 0.4 mL/100 g as measured by injection of 15O-CO hemoglobin–containing vesicles, consistent with the result of our study (27). The small-vessel–to–large-vessel hematocrit ratio in the rat brain has been fixed at 0.70 (17); this ratio was shown to have little effect on the OEF or CMRO2 values. When we used 0.85 as the value of the hematocrit ratio (a value often used in clinical studies), the CMRO2 and OEF increased by approximately 1% (data not shown).
Quantitative PET measurement in a rat model of unilateral MCA occlusion was performed as an experimental study. A decrease in both the CBF and the CMRO2 and an increase in the OEF were detected in the ipsilateral MCA territory (data not shown). We concluded that evaluation in an ischemia model is feasible with this PET technique.
CONCLUSION
Although further improvements of the gas inhalation system may be needed, we demonstrated the feasibility of quantitative measurements of CBF, CBV, CMRO2, and OEF using PET according to the original steady-state inhalation method of 15O-CO2 and 15O-O2 gas and the CBV measurement by 15O-CO gas inhalation in normal rats under anesthesia.
DISCLOSURE
The costs of publication of this article were defrayed in part by the payment of page charges. Therefore, and solely to indicate this fact, this article is hereby marked “advertisement” in accordance with 18 USC section 1734. This study was partly supported by the Molecular Imaging Program, a grant (no. 21591561) from the Ministry of Education, Culture, Sports, Science, and Technology (MEXT), Japan. No other potential conflict of interest relevant to this article was reported.
Footnotes
Published online Jan. 3, 2013
- © 2013 by the Society of Nuclear Medicine and Molecular Imaging, Inc.
REFERENCES
- Received for publication June 16, 2012.
- Accepted for publication August 23, 2012.


Jump to section
Related Articles
Cited By...
- No citing articles found.