


Abstract
We report kinetic modeling results of dynamic acquisition data from 0 to 100 min after injection with the tau PET tracer 18F-AV-1451 in 19 subjects. Methods: Subjects were clinically diagnosed as 4 young cognitively normal, 5 old cognitively normal, 5 mild cognitive impairment, and 5 Alzheimer disease (AD). Kinetic modeling was performed using Logan graphical analysis with the cerebellum crus as a reference region. Voxelwise binding potential ( ) and SUV ratio (
 ) images were compared. Results: In AD subjects, slower and spatially nonuniform clearance from cortical regions was observed as compared with the controls, which led to focal uptake and elevated retention in the imaging data from 80 to 100 min after injection. BP from the dynamic data from 0 to 100 min correlated strongly (R2 > 0.86) with corresponding regional
  values. In the putamen, the observed kinetics (positive
  at the tracer delivery stage and plateauing time–SUVR curves for all diagnostic categories) may suggest either additional off-target binding or a second binding site with different kinetics. Conclusion: The kinetics of the 18F-AV-1451 tracer in cortical areas, as examined in this small group of subjects, differed by diagnostic stage. A delayed 80- to 100-min scan provided a reasonable substitute for a dynamic 0- to 100-min acquisition for cortical regions although other windows (e.g., 75–105 min) may be useful to evaluate.
Definitive diagnosis of Alzheimer disease (AD) relies on postmortem neuropathologic assessment of the number and distribution of amyloid-β plaques and tau neurofibrillary tangles (e.g., (1–4)). Establishing robust in vivo biomarkers that accurately reflect these key pathologic processes in the living subject is an area of substantial current research. Such biomarkers enable disease pathology to be measured and tracked longitudinally, are making substantial contributions to our understanding of the progression of AD, and are increasingly used in clinical trials.
Selective PET ligands that enable the neuroanatomical distribution of tau pathology to be mapped in the living brain have only recently entered clinical testing. These molecules include but are not limited to 11C-PBB3 (5), 18F-THK523 (6), 18F-THK5105, 18F-THK5117 (7,8), 18F-AV-680 (formerly known as 18F-T808 (9)), and 18F-AV-1451 (formerly known as 18F-T807 (10,11)). These ligands may allow the well-defined topographic spreading of tau pathology to be assessed and tracked in vivo, providing a major step forward in AD biomarkers (12,13).
In this article, we extend the previously reported analysis of 18F-AV-1451 kinetics (11) by quantifying the 18F-AV-1451 images for 100 min after injection using Logan graphical analysis with reference region (LGAR). In particular, we compare the LGAR-derived distribution volume ratio, which provides more information about the regional capacity to bind the tracer, with the 80- to 100-min SUV ratio ( ), to establish the extent to which the latter can serve as a reliable proxy for the former. This provides an important extension to the in vivo evaluation of 18F-AV-1451 tracer properties and addresses a key question underpinning its application as an in vivo central nervous system biomarker of tau pathology in neurodegeneration.
MATERIALS AND METHODS
Demographics and Baseline Characteristics of Participants
Nineteen participants who had image acquisition from immediately after injection of 346–505 MBq of 18F–AV-1451 until 100 min were enrolled in 2 clinical trials: one, sponsored by Avid Radiopharmaceuticals (referred to below as study A), and another, by Siemens Molecular Imaging (study B). All subjects gave written informed consent, and both informed consent documents and the protocols were approved by Institutional Review Boards. Subject screening in both studies included analysis of medical history, physical and Mini-Mental State examinations (MMSE), and brain MRI.
The participants were drawn from 4 diagnostic groups (Table 1). The young cognitively normal (YCN) subjects were healthy volunteers (n = 4; mean age ± SD, 27.5 ± 2.1 y; MMSE ≥ 29). Five old cognitively normal (OCN) subjects (n = 5; age, 65.0 ± 2.8 y; MMSE ≥ 29) with normal cognitive functioning were also recruited to assess potential effects of normal aging on tracer kinetics. Two remaining groups, mild cognitive impairment (MCI) (n = 5; age, 76.4 ± 4.3 y; MMSE, 25.4 ± 4.9) and AD dementia (n = 4; age, 71.8 ± 11.9 y; MMSE, 21.8 ± 4.5), comprised patients clinically diagnosed with MCI or with probable or possible AD, respectively, according to the joint guidelines of the National Institute on Aging and Alzheimer Association (14,15).
Demographics and Baseline Characteristics for 19 Subjects Enrolled in Study
Except for YCNs, all subjects underwent a 50- to 60-min postinjection 18F-florbetapir PET scan to evaluate amyloid-β burden. All amyloid-positive subjects were categorized on the basis of florbetapir SUVR > 1.1 (16). All MCI, all AD, and 2 OCN subjects (OCN-1 and OCN-2) were amyloid-positive, whereas 3 OCN subjects (OCN-3, OCN-4, and OCN-5) were amyloid-negative (Table 1).
Image Acquisition
18F-AV-1451 image acquisition was composed of two 3-dimensional dynamic PET acquisitions, one from 0 to 60 min and another from 80 to 100 min after injection. Low-dose CT scans were obtained before every PET acquisition for attenuation correction purposes. The image sequence used for the dynamic 0- to 60-min scan comprised 38 time frames of gradually increasing durations: 10 × 0.1, 6 × 0.3, 4 × 0.5, 5 × 1, 5 × 2, and 8 × 5 min. The image acquisition for the 80- to 100-min scans differed in studies A and B: although dynamic acquisition 4 × 5 min was performed in study A, only a single static 20-min scan was acquired in study B. All images were binned and iteratively reconstructed with corrections for attenuation, scatter, randoms, and radioactive decay.
Image Processing
Image data (80–100 min) (dynamic for study A and static for study B) were first corrected for radioactive decay and linearly coregistered with the 0- to 60-min time frames using normalization tools in FSL (17). Subsequent processing used the PNEURO toolbox of the PMOD software package (version 3.5; PMOD Technologies Ltd.). The rigid matching procedure was used to spatially register the 80- to 100-min image into the corresponding individual subject’s MRI space, and the same transformation was then applied to the whole 0- to 100-min dataset. A gray matter map was extracted from the MRI and used to spatially normalize the subject-specific MRI to the T1 MRI template in Montreal Neurologic Institute (MNI) stereotactic space (18). The derived nonlinear transformation parameters were then applied to the previously coregistered PET dataset, resulting in patient-specific spatiotemporal 4-dimensional images in MNI space.
Prespecified Regions of Interest (ROIs)
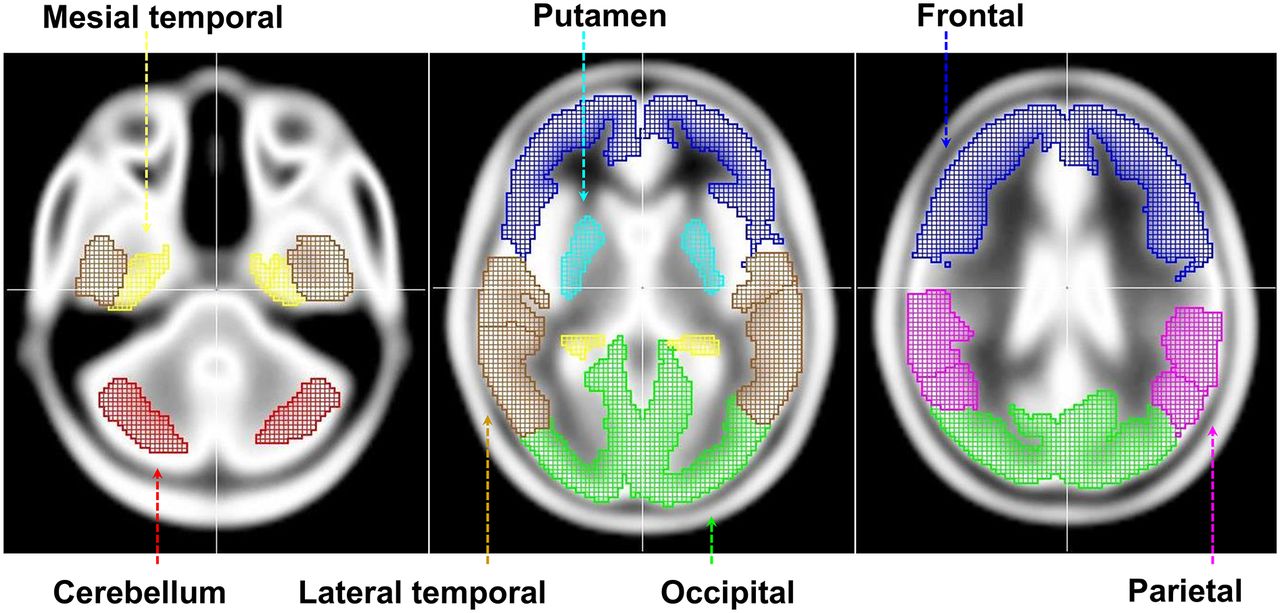
ROIs were derived after the application of a 0.3 threshold to the gray matter probability map in MNI space. First, we created 5 regions (bilateral frontal, lateral parietal, occipital, and mesial temporal and lateral temporal) by combining all AAL (anatomic automatic labeling (19)) elements belonging to the corresponding cortices. Second, we selected 34 AAL-based bilateral cortical subregions for more detailed analysis. Third, we generated a putamen mask in MNI space to explore possible kinetic differences between cortical regions and putamen. Analogous to other studies with tau PET tracers (6–9,11), we assumed minimal specific binding of 18F-AV-1451 in the cerebellum and, therefore, considered cerebellum gray matter (crus) as a reference region. The AAL-based cerebellum crus region was modified by translating it by 6 mm in the z-axis to avoid overlap with noncerebellar space. The resulting regions are shown in Figure 1.

Predetermined ROIs in MNI space.
SUVR Calculations
The mean values of both activity and SUVR dynamic images were calculated in these target regions, leading to time–activity curves and time–SUVR curves, respectively. We used 3 indices to examine the behavior of regional time–activity curves. To quantify 18F-AV-1451 retention in target ROIs with respect to the cerebellum crus reference region, we calculated averaged regional late ratios— values for the 80- to 100-min PET images. To express the
  values in a fashion comparable with actual regional binding, we additionally calculated
  indices for each ROI. Analogous to the late ratios, we used the
  values as averaged regional early ratios corresponding to 1- to 5-min PET images. Finally, we estimated the rate of change in SUVR from 80 to 100 min by calculating the slope of the linear regression line plotted through the four 80- to 100-min time frames (study A) for regional time–SUVR curves.
Kinetic Modeling
We calculated parametric binding potential ( ) maps using Logan graphical analysis with reference tissue as implemented in the PXMOD toolbox (version 3.5; PMOD Technologies Ltd.). As with SUVR measurements, we assumed minimal specific binding of 18F-AV-1451 in the cerebellum crus and, therefore, used the cerebellum crus time–activity curve as an input function. Following the LGAR strategy (20), we estimated the voxelwise distribution volume ratio (
 ) as a slope of the linear part of the Logan plot, establishing a relationship between the modified concentrations in a particular voxel and the reference region. The
  map was then computed as
  (21) and compared with the corresponding
  voxelwise distribution.
When applying the LGAR technique, we did not estimate individual cerebellar clearance rates for each subject but selected population-averaged value  = 0.2/min (22). In addition, we used the fixed value
  = 40 min of the starting point of the Logan plot linearization in all our calculations.
Two approaches were used to analyze regional binding. First, mean  and
and  values were calculated in target regions based on the corresponding parametric maps. Second, regional
  and
and  values were directly estimated from the regional time–activity curves as implemented in PKIN toolbox (version 3.5; PMOD Technologies Ltd.). The latter method was used to validate the usage of voxelwise time–activity curves and fixed values
  = 0.2/min and
  = 40 min in the voxelwise methodology.
Statistical Analysis
In our Pearson correlations, we included all  and
and  pairs pertaining to each region. As a result, region-specific regression lines and R2 coefficients across 19 subjects were generated. Analogously, Pearson correlations between
  and
and  , measured in various regions, were explored. Although the sample sizes in our study were small, quantitative parameter estimates of both
  and
and  were formally compared between diagnostic categories to indicate the strongest group differences.
RESULTS
Time–Activity Curves
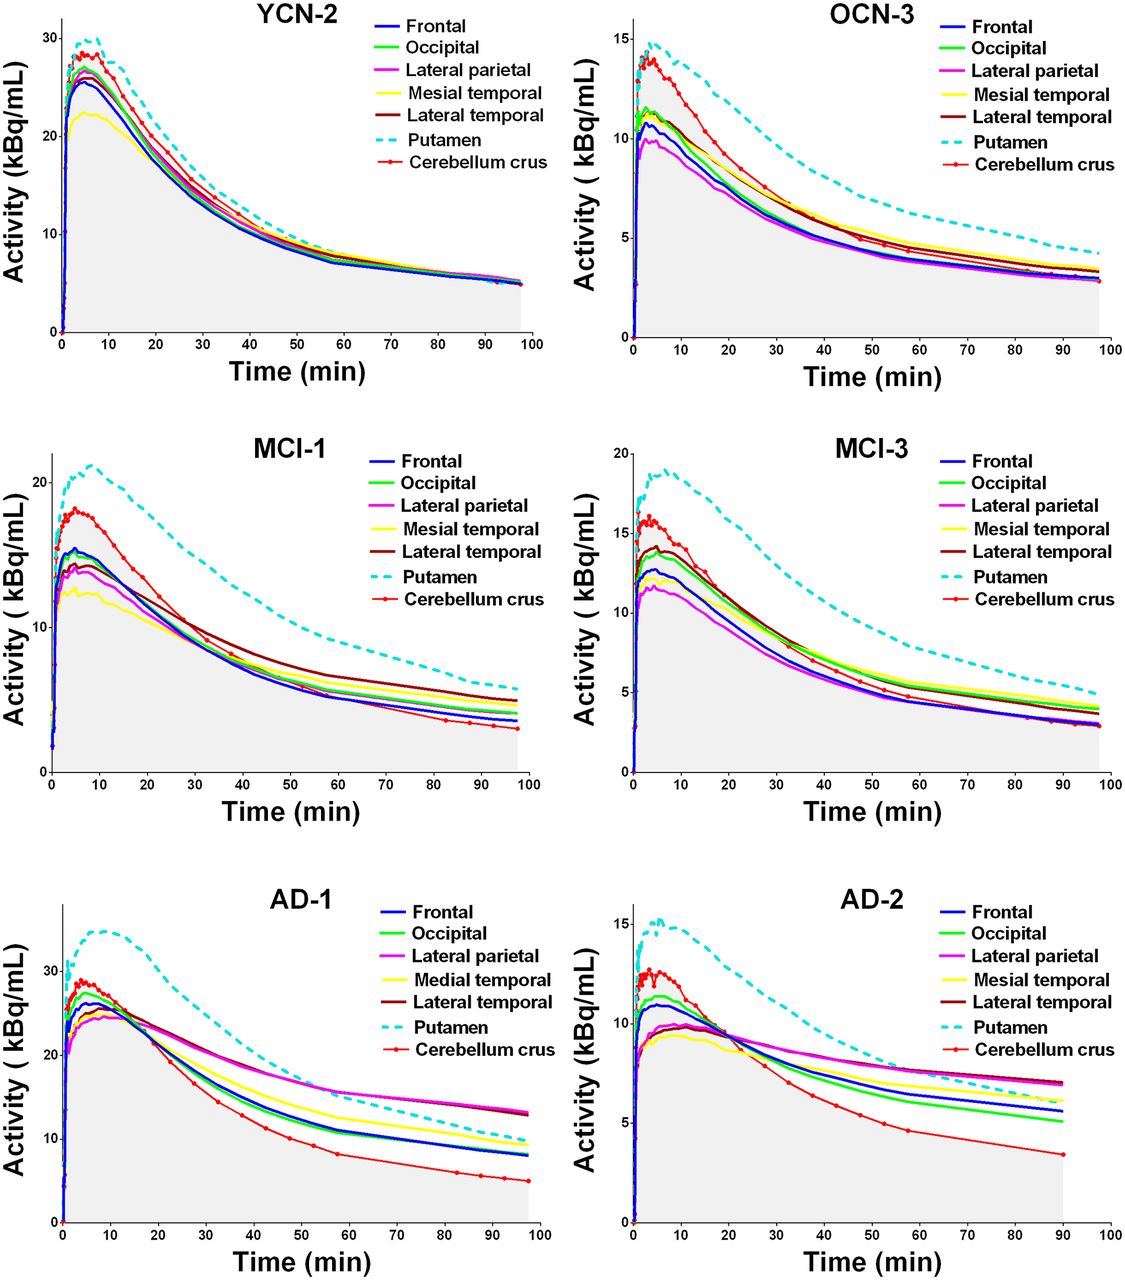
Time–activity curves for the 6 brain areas (frontal, occipital, lateral parietal, mesial temporal, lateral temporal, putamen) pertaining to 6 representative subjects from different diagnostic groups are displayed in Figure 2 and compared with the corresponding cerebellar time–activity curves. For each time frame, activity was calculated as an averaged value across pixels included in the ROI. For better visualization, the cerebellar time–activity curve is marked by red dots and the area under this curve by gray shading.
Time–activity curves for 6 representative subjects.
Visual examination of the time–activity curves from all subjects demonstrated relatively rapid (up to 10 min after injection) uptake for all 5 cortical regions. Initial uptake (2–10 min after injection) in the reference region (cerebellum) was higher than most of the key cortical regions for all cases. However, the peak uptake in the putamen was higher than the cerebellum and delayed slightly for OCN, MCI, and AD subjects (Fig. 2, dashed blue line). This was quantitatively confirmed (Table 2) with mean putamen  values of 1.07 ± 0.02, 1.09 ± 0.04, and 1.16 ± 0.06 for OCN, MCI, and AD participants, respectively. In the wash-out stage (10–100 min after injection), time–activity curves (Fig. 2) clearly illustrate differential clearance from cortical regions across diagnostic categories. Specifically, the time–activity curves from the cortex and cerebellum crus for YCNs and OCNs were similar at the wash-out stage. For MCI subjects, the clearance from both temporal regions was slower than from the cerebellum (note the separation between temporal and cerebellar time–activity curves in Fig. 2 for both MCI subjects). For AD subjects, all cortical time–activity curves were separated from the cerebellum during the wash-out phase because of slower clearance (greater specific tracer retetnion). For the AD cases (Fig. 2), the slowest clearance (lowest wash-out) was demonstrated in lateral temporal and parietal parietal regions leading to the highest retention in 80- to 100-min images as measured by
  values. These data also illustrate the not only slower but also spatially nonuniform clearance from cortical regions and the earlier separation between cortical and cerebellar time–activity curves.
Regional Values (Mean ± SD Across Subjects in Each Diagnostic Category) for 6 Target ROIs
Similar to the wash-in period, the wash-out stage (10–100 min after injection) in the putamen differed from that in the cortex. The shape of the putamen time–activity curve visually resembled the one for cerebellum for all presented subjects, although the mean values in the putamen constantly exceeded the corresponding cerebellar values. The AD scans in Figure 2 show that cerebellar and putamen time–activity curves have a relatively fast wash-out that crosses the parietal time–activity curve (with slower wash-out) at 15–20 min and 55–60 min, respectively.
SUVR Images
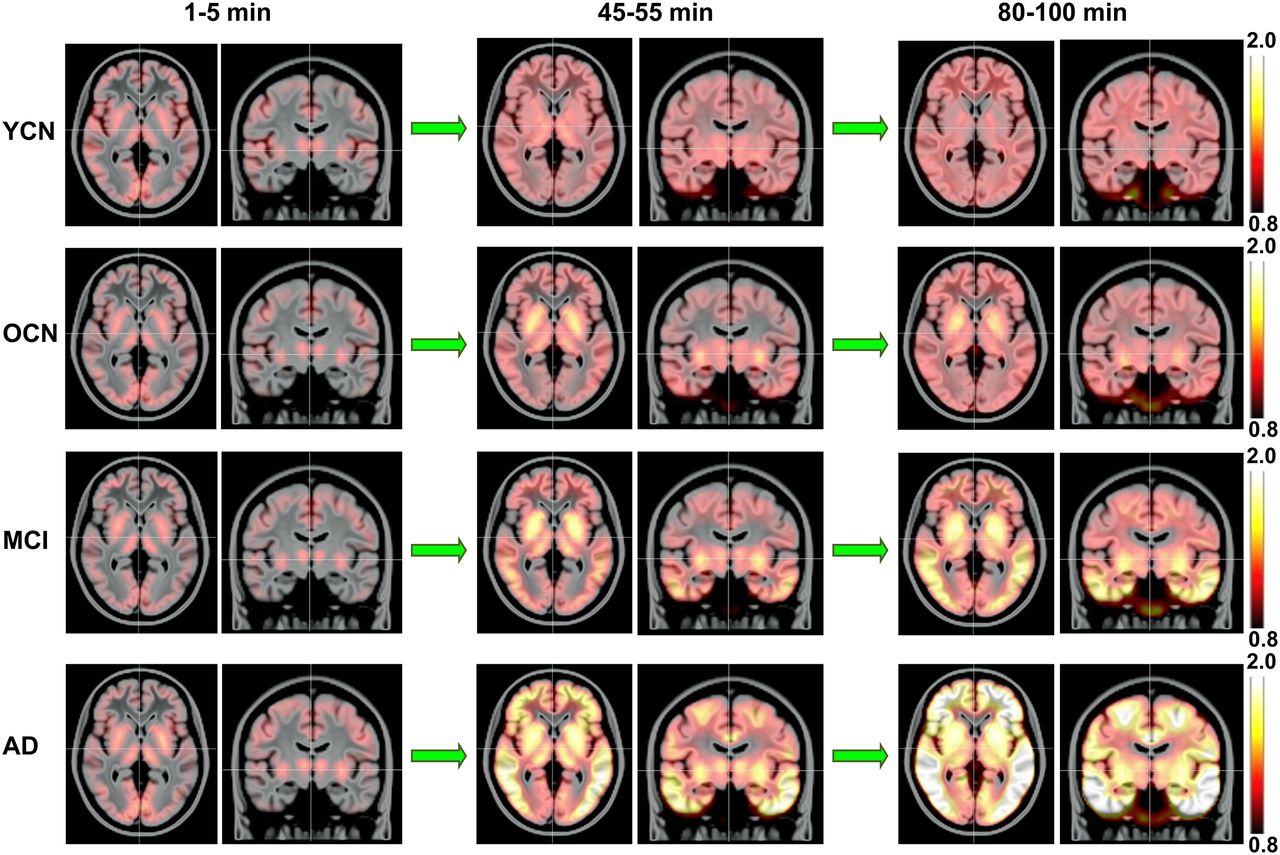
The spatiotemporal SUVR distributions are summarized in Figure 3, illustrating mean SUVR images in each diagnostic category (YCN, OCN, MCI, and AD) calculated for the 1- to 5-min (wash-in stage), 45- to 55-min (middle period of the wash-out stage), and 80- to 100-min (retention stage). An identical scale 0.8–2.0 was applied to all images for better interstage and intergroup comparison.

Mean SUVR images overlaid with MR template for representative subjects in each diagnostic category, calculated for 1- to 5-min, 45- to 55-min, and 80- to 100-min intervals.
The early (1–5 min) SUVR images were almost identical across diagnostic categories, although slightly greater uptake in cortical regions was seen in the YCN subjects. In the middle (45–55 min) images, differences between groups became apparent. Although the mean SUVR image for YCNs was relatively uniform (SUVR≈1), increased putamen uptake was observable for OCN, MCI, and AD subjects. The mean OCN and MCI images resembled each other, although increased activity in temporal regions was present in MCI subjects. Finally, the mean 45- to 55-min AD image could be easily distinguished from other categories because of pronounced uptake in cortical regions. The increased frontal SUVRs most notably distinguished the mean AD image from the other groups in the middle (45–55 min) images.
A comparison between middle (45–55 min) and late (80–100 min) images showed that SUVR changed little over the last 50 min of the scan for cognitively normal subjects. However, the spatial patterns for amyloid-β–positive MCI and AD subjects continued evolving. In particular, the signal in temporal regions continued increasing for MCI subjects, leading to a much clearer MCI versus OCN differentiation in the late images compared with the middle ones. Importantly, the late MCI images displayed patterns resembling earlier pathology-based AD stages (3,4). For AD subjects, SUVRs increased in all cortical regions over the last 50 min of the scan. In the late AD images, the tracer deposition extended into parietal and occipital cortices.
The temporal changes of the mean regional SUVRs for subjects in each diagnostic category and corresponding SD are shown in Figure 4. For frontal, occipital, parietal, and temporal regions, all graphs show SUVR < 1 at the starting point corresponding to 5 min after injection. Although these curves have similar values initially, they separate over time, and this separation was region- and group-specific. For cognitively normal subjects (red and green lines in Figure 4), SUVRs increased slowly and reached steady-state conditions at 40–50 min after injection, with SUVRs slightly exceeding 1.0. The MCI plots (blue lines in Fig. 4) differ most from those in the OCN/YCN groups in the temporal lobe. Moreover, this differentiation was greater at 100 min than at 50 min after injection. The AD plots (black lines in Fig. 4) are separated from others in all presented regions even after 50 min after injection.

Time courses of regional SUVR (mean ± SD) for subjects in each diagnostic category.
The temporal behavior of SUVR in the putamen was different from that in other regions (Fig. 4). The putamen for OCN, MCI, and AD had an SUVR > 1 at the initial wash-in stage and reached a steady-state condition at 40–50 min after injection.
Quantitative Analysis of Parametric Maps
The mean regional  ,
,  , and
, and  values for subjects in each diagnostic category support the visual observations. The quantitative comparison between MCI/AD subjects and cognitively normal participants also demonstrated a gradual escalation and expansion of the 18F-AV-1451 binding (Table 2).
The difference between YCN and OCN groups, as measured by both  and
and  , was minimal across cortical regions but not in the putamen (Table 2). MCI subjects (all amyloid-β–positive in our study) showed elevation of the tracer deposition in all cortical regions except for the frontal lobe, with the most pronounced MCI versus OCN difference in temporal regions (
 = 1.38,
  > 0.1). AD subjects (all amyloid-β–positive in our study) demonstrated pronounced increases in 18F-AV-1451 uptake with respect to the cerebellum in all cortical regions, including the frontal lobe, corresponding to pathology-based AD staging (3,4). As seen in Table 2, the SDs reflecting intersubject variations in regional patterns were minimal for YCNs and the largest for AD participants.
In the last portion of Table 2, we present the slope of the linear regression line plotted through the four 80- to 100-min time frames (14 subjects in study A) for regional time–SUVR curves. This parameter reflects the rate of SUVR changes in the 80- to 100-min window, that is, the stability of regional  values. The mean values of this rate do not exceed 0.2/h for all ROIs across cognitively normal subjects (Table 2). For MCI and AD subjects, this slope was larger than for cognitively normal participants in cortical regions, reflecting a continued increase in SUVR for these categories in this time window.
The  and
and  from the putamen showed no signal for YCNs (1.00 and 0.08, respectively), but the values were increased for OCN (1.33 and 0.28, respectively) and further elevated for MCI (1.59 and 0.42, respectively) and AD (1.78 and 0.55, respectively). Unlike cortical regions, the SDs across subjects were similar for all 4 groups, and the rate of
  change did not exceed 0.2/h.
The  and
and  estimates in the putamen were significantly different in OCN subjects versus YCN subjects (P = 0.02 and 0.03, respectively). Amyloid-negative and amyloid-positive OCN participants were not significantly different for any region (P > 0.2 for all regional
  and
and  values).
  but not
  values were different between the MCI and OCN categories in mesial temporal (P = 0.02) and lateral temporal (P = 0.05) regions only. Between the AD and MCI groups, only
  was borderline significant in the lateral temporal region (P = 0.05).
Correlations Between Modeling Outcomes
BP correlated strongly with the corresponding  values (Table 3). R2 was > 0.86 for 34 AAL-based bilateral cortical subregions. Importantly, the slopes and intercepts of all
  /
/ regressions were found to be similar: slopes ranged between 0.48 and 0.58 and intercepts between −0.11 and −0.01. The intercept for the putamen (≈0.1) was larger than for other regions (Table 3), indicating that that
  ≈1 in this region corresponded to
  ≈-0.1.
Correlations Between Different Maps for 6 Target ROIs
We additionally illustrate the  /
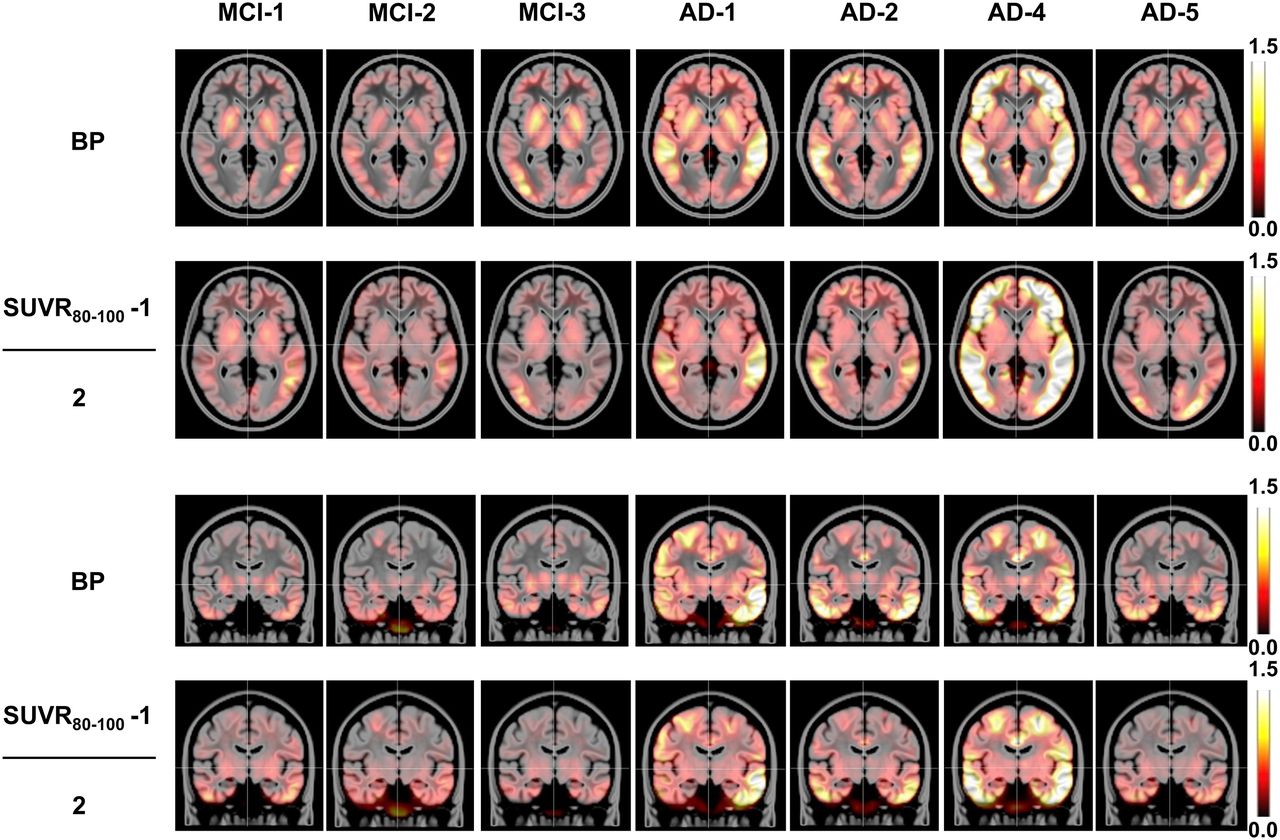
/ relationships in Figures 5 and 6. Figure 5 shows the actual regression lines for representative regions, and Figure 6 compares
  and
and  maps for MCI and AD subjects. All regional correlations presented in Figure 5 are significant, with P < 0.0001. In Figure 6, we compared
  with
with  , that is, we applied identical slopes of 0.5 and zero intercept to all presented
  maps. For better intersubject comparison, an identical scale 0–1.5 was applied to all images. As shown in Figure 6, this transformation demonstrated reasonable similarity between
  and
and  maps in cortical regions. The clear exception is that LGAR-based
  in the putamen area is greater than the signal in the corresponding
  images.

 and
and  values for 6 regions. Values corresponding to YCNs, OCNs, MCI, and AD subjects are marked by red, green, blue, and black dots, respectively. Linear regression lines are plotted across all subjects.

Transaxial and coronal slices of corresponding  and
and  images for 7 MCI and AD subjects. Mean regional values can be seen in Table 2.
The difference between cortical regions and putamen was emphasized by different correlations of  with
with  (Table 3). Indeed, the correlation between
  and
and  was found to be stronger in the putamen than in the cortex.
DISCUSSION
In this article, we report kinetic modeling results for dynamic 0- to 100-min scans with 18F-AV-1451 in 19 subjects across diagnostic categories. We observed that cortical (but not putamen) time–SUVR curves for the 18F-AV-1451 tracer may not plateau within 100 min for MCI or AD subjects (Fig. 4). As seen in Figures 3 and 4, the 80- to 100-min window provided better MCI/OCN separation, whereas AD subjects’ kinetics in cortical regions diverged from normal subjects approximately 30 min earlier. Although we found that 80–100 min would serve as one of the best options for a simplified acquisition amenable to clinical trials, other windows (e.g., 75–105 min) may be useful to evaluate. Moreover, the slope of the  estimated from dynamic scans may serve as an additional index of interest (Table 2).
To investigate kinetic meaningfulness of the  -based measurements, we compared
  images as surrogate metrics of the
  generated using LGAR from the dynamic 0- to 100-min scan. Our comparison of these maps demonstrated strong (Table 3) correlation for all cortical regions across 19 subjects. We hypothesized that this strong correlation would make
  -based cut-points, separating diagnostic stages, comparable with
  -based ones. It is possible that starting scans at a delayed time point (e.g., 80 min) instead of from tracer injection could limit the functional information measured. In particular, it prevents one from estimating wash-in characteristics, which may increase the diagnostic power of the 18F-AV-1451 scan.
When using Logan graphical analysis to investigate the utility of  images, one should take into account the features of the modeling methodology. In our analysis, LGAR was robust when modeling 18F-AV-1451 kinetics. Indeed, reasonable
  maps and regional
  values were obtained for all investigated cases, irrespective of the time–activity curve shapes and noise. Moreover, LGAR demonstrated sound performance over several parameter choices. For example, we tested the variability of
  by varying
  between 0.05/min and 0.25/min for several subjects with different time–activity curve behavior and found that
  reached plateau at
  = 0.15/min. Further, the difference between regional
  calculated at
  = 0.2/min and at
  = 0.25/min did not exceed 1% for all subjects, supporting the use of
  = 0.2/min as a safe input parameter. In addition to using a fixed value of
  = 40, we performed Logan analysis with individual
  values determined as a minimum time moment, beyond which all deviations between linear regression line and Logan plot did not exceed 5% (23). Importantly, this linearity condition was fulfilled for all analyzed scans and all considered ROIs with the starting point
  = 40. Therefore, we used the fixed value
  = 40 min in all our voxelwise and regional calculations. LGAR also provided stable and consistent
  estimates for numerous tests with different spatial normalizations and reference regions.
Our analysis showed that slower cortical wash-out with respect to the cerebellum for MCI and AD subjects was attributed not only to increasing (less stable)  values (Fig. 4; Table 2), but also to the more convex Logan plot and, correspondingly, to increasing (less stable)
  and
and  estimates. These observations are illustrated in Figure 7 for 3 ROIs and 4 subjects from each diagnostic group. The time–activity curves corresponding to these scans can be found in Figure 2. For YCN-2 and OCN-3, the major parts of Logan plots in the lateral temporal region are linear (
 = 10 and 20 min, respectively), and the slopes of the regional regression lines (
 values) are close to 1. The slightly convex Logan plot in subject MCI-1 (
 = 35 min) is associated with an increased binding of
  = 1.18. Furthermore, the convexity of the lateral temporal plot for AD-1 subject is reflected by the delayed starting point of linearization (
 = 40 min) and elevated retention (
 = 1.80).
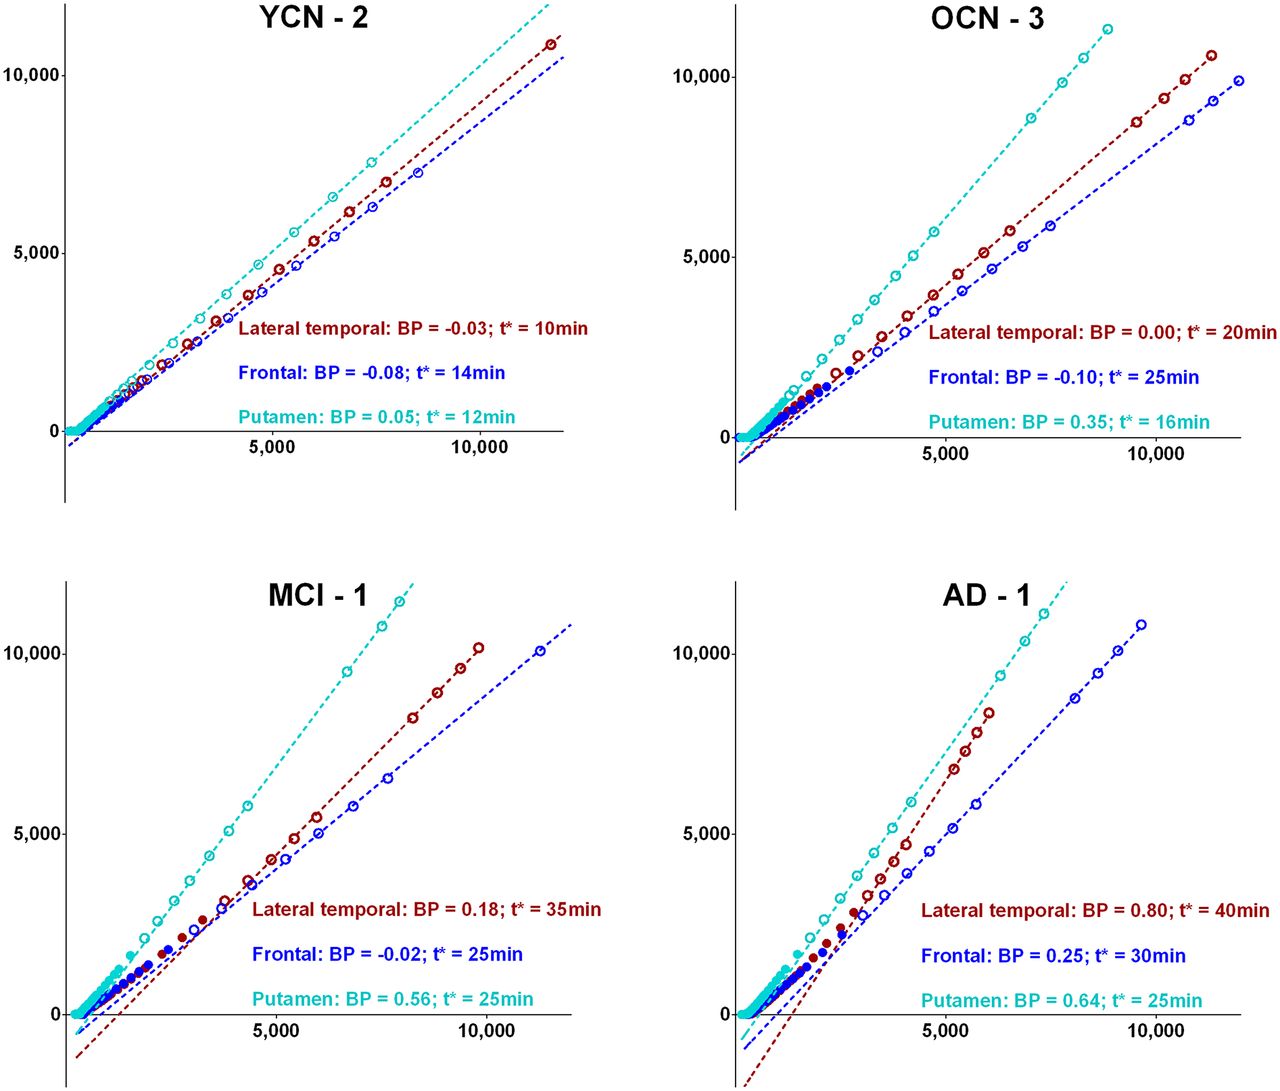
Regional Logan plots and linear regressions (dashed lines) for 4 representative subjects from each diagnostic category. Points included in linear part of Logan plots (t > t*) are marked by ○ and points that are not included (t < t*) by ●.
We found quite different kinetics in the putamen compared with cortical regions:  > 1, time–SUVR curves plateaued after 50 min for all categories, positive (≈0.1) intercept of the
  linear regression, and correlation (R2 = 0.48) between
  and
and  indicating that
  in the putamen may be partially driven by the uptake at early time frames. These observed differences suggest either additional off-target binding in the putamen or a second binding site with different kinetics. The mechanisms underlying these differences will be investigated in future studies.
This study has some important limitations. First, there were limited subject numbers (4 or 5) in each diagnostic group. Although we were able to detect some differences in the 18F-AV-1451 tracer kinetics between these small groups using simple t tests, the small sample sizes precluded more advanced statistical analyses.
Second, there are some limitations of the kinetic modeling technique used in this study. Blood sampling was not included in the acquisition protocol, and thus we generated a surrogate input function assuming negligible specific binding in the cerebellum crus. When applying LGAR, we did not expect to separate concentrations of specifically and nonspecifically bound 18F-AV-1451 tracer. Only a single composite index,  , representing tracer availability with respect to the cerebellum, was generated representing the combination of the compartmental kinetic parameters. Dynamic acquisitions with blood sampling and compartmental kinetic modeling may provide new insights on the tracer kinetics and, therefore, influence the design of an optimal imaging protocol.
Third, the bias caused by noisy time–activity curves is also frequently mentioned as a limitation of the voxelwise Logan graphical analysis. To address this issue, we compared regional  estimates generated from the voxelwise
  map and average regional time–activity curves and found high (R2 > 0.9) correlations for the different cortical regions, suggesting that noise-induced bias is not a fundamental concern for the analyses we report here.
Finally, another limitation that should be considered is the relatively short (0–100 min after injection) duration of dynamic scans. The observed behavior of the time–SUVR curves (Fig. 2) and Logan plots (Fig. 7) suggests that longer scans might be required to fully understand 18F-AV-1451 kinetics and determine the optimal scan duration for quantitatively accurate  estimates. The relationship between
  and BPs calculated from longer dynamic scans may provide additional insights on using
  as an endpoint for cross-sectional and longitudinal studies. On the other hand, substantial prolongation of the scanning time window should be made with caution because an increased noise due to the radioactive decay may affect image quality (11).
CONCLUSION
Logan graphical analysis using the cerebellum crus as a reference region served as an efficient tool for modeling of 18F-AV-1451 kinetics. The kinetics of the tracer in cortical regions, as examined in a small group of subjects, differed by diagnostic stage. For AD relative to controls, we observed earlier separation between cortical and cerebellar time–activity curves as well as slower and spatially nonuniform clearance from cortical regions leading to focal uptake and elevated retention in 80- to 100-min images. A delayed 80- to 100-min scan provided a reasonable substitute for a dynamic 0- to 100-min acquisition for cortical regions. The slope of the  estimated from dynamic 80- to 100- (4 × 5 min) or 75- to 105 (6 × 5 min)-min scans may serve as an additional index. Further dynamic studies are planned, and additional evaluation of kinetic modeling methodology is warranted.
DISCLOSURE
The costs of publication of this article were defrayed in part by the payment of page charges. Therefore, and solely to indicate this fact, this article is hereby marked “advertisement” in accordance with 18 USC section 1734. Sergey Shcherbinin and Adam J. Schwarz are employees of Eli Lilly and Company. Michael D. Devous Sr., Abhinay Joshi, Michael Navitsky, Matthew Flitter, and Mark A. Mintun are employees of Avid Radiopharmaceuticals, a wholly owned subsidiary of Eli Lilly and Company. William R. Shankle is an employee of Shankle Clinic and Cognitive Disorders Program, Hoag Neurosciences Institute, and UC Irvine Cognitive Science Department. No other potential conflict of interest relevant to this article was reported.
Footnotes
Published online May 5, 2016.
- © 2016 by the Society of Nuclear Medicine and Molecular Imaging, Inc.
REFERENCES
- Received for publication November 18, 2015.
- Accepted for publication April 4, 2016.


Jump to section
Related Articles
Cited By...
- Biostatistical Estimation of Tau Threshold Hallmarks (BETTH) Algorithm for Human Tau PET Imaging Studies
- The RSNA QIBA Profile for Amyloid PET as an Imaging Biomarker for Cerebral Amyloid Quantification
- Direct Comparison of the Tau PET Tracers 18F-Flortaucipir and 18F-MK-6240 in Human Subjects
- Effect of Off-Target Binding on 18F-Flortaucipir Variability in Healthy Controls Across the Life Span
- Development of a mnemonic discrimination task using naturalistic stimuli with applications to aging and preclinical Alzheimer's disease
- Flortaucipir tau PET imaging in semantic variant primary progressive aphasia
- Test-Retest Reproducibility for the Tau PET Imaging Agent Flortaucipir F 18
- Subthreshold Amyloid Predicts Tau Deposition in Aging
- Preclinical Evaluation of 18F-RO6958948, 11C-RO6931643, and 11C-RO6924963 as Novel PET Radiotracers for Imaging Tau Aggregates in Alzheimer Disease
- 18F-Flortaucipir PET/MRI Correlations in Nonamnestic and Amnestic Variants of Alzheimer Disease
- Entorhinal Tau Pathology, Episodic Memory Decline, and Neurodegeneration in Aging
- Kinetic Modeling of the Tau PET Tracer 18F-AV-1451 in Human Healthy Volunteers and Alzheimer Disease Subjects
- Preclinical Evaluation of 18F-JNJ64349311, a Novel PET Tracer for Tau Imaging
- Pharmacokinetic Evaluation of the Tau PET Radiotracer 18F-T807 (18F-AV-1451) in Human Subjects