


Abstract
18F-AV-1451 is currently the most widely used of several experimental tau PET tracers. The objective of this study was to evaluate 18F-AV-1451 binding with full kinetic analysis using a metabolite-corrected arterial input function and to compare parameters derived from kinetic analysis with SUV ratio (SUVR) calculated over different imaging time intervals. Methods: 18F-AV-1451 PET brain imaging was completed in 16 subjects: 4 young healthy volunteers (YHV), 4 aged healthy volunteers (AHV), and 8 Alzheimer disease (AD) subjects. Subjects were imaged for 3.5 h, with arterial blood samples obtained throughout. PET data were analyzed using plasma and reference tissue–based methods to estimate the distribution volume, binding potential (BPND), and SUVR. BPND and SUVR were calculated using the cerebellar cortex as a reference region and were compared across the different methods and across the 3 groups (YHV, AHV, and AD). Results: AD demonstrated increased 18F-AV-1451 retention compared with YHV and AHV based on both invasive and noninvasive analyses in cortical regions in which paired helical filament tau accumulation is expected in AD. A correlation of R2 > 0.93 was found between BPND (130 min) and SUVR-1 at all time intervals. Cortical SUVR curves reached a relative plateau around 1.0–1.2 for YHV and AHV by approximately 50 min, but increased in AD by up to approximately 20% at 110–130 min and approximately 30% at 160–180 min relative to 80–100 min. Distribution volume (130 min) was lower by 30%–35% in the YHV than AHV. Conclusion: Our data suggest that although 18F-AV-1451 SUVR curves do not reach a plateau and are still increasing in AD, an SUVR calculated over an imaging window of 80–100 min (as currently used in clinical studies) provides estimates of paired helical filament tau burden in good correlation with BPND, whereas SUVR sensitivity to regional cerebral blood changes needs further investigation.
The accumulation of folded hyperphosphorylated tau is 1 pathologic hallmark for Alzheimer disease (AD) and forms the basis of the neuropathologic staging of Alzheimer-related pathology in the brain (1). 18F-AV-1451 (18F-T807, flortaucipir) (2) is a PET radiotracer with high affinity and specificity for tau aggregates, while lacking affinity for concomitant amyloid-β plaques in human AD (3,4). Several additional PET agents have been proposed for the imaging of tau in the brain, in particular 11C-PBB3 (5,6), 18F-THK-5117 (7), 18F-T808 (8), 18F-PI-2014 (9), and more recently 11C-RO6924963, 11C-RO6931643, 18F-RO6958948 (10), 18F-THK-5351 (11), 18F-GTP1 (12), and 18F-MK6240 (13), and have been or are being characterized and evaluated in humans. Currently, 18F-AV-1451 has been the most widely used and characterized PET tracer (2–4,14,15) in clinical studies. Early clinical evaluation has demonstrated heterogeneous and asymmetric brain uptake of the radiotracer (2) consistent with the earlier reports by Braak and Braak (1) showing distribution of tau that follows discrete patterns in cross-sectional postmortem analyses generally correlating with AD severity.
Validation of a quantitative PET outcome measure for 18F-AV-1451 is necessary to address questions relevant to drug development and the primary pathophysiology of AD. SUV ratio (SUVR) has been widely used as a semiquantitative outcome measure, because it can be obtained using simplified methods of acquisition and analysis. Quantification using this method may be influenced by confounding factors such that assessment of 18F-AV-1451 signal or longitudinal changes of signal may not solely reflect the actual tau density in brain tissue.
In this report, we have compared the validity of SUVR to more robust quantitative measurements obtained through kinetic modeling of the PET data. Recently, SUVR was compared with a tissue-based method (15). In this study, an arterial input function corrected for metabolites was obtained in both healthy volunteers (HV) and subjects with AD, and classic pharmacokinetic modeling of the 18F-AV-1451 PET data using plasma-based or tissue-based methods was performed.
MATERIALS AND METHODS
Radiochemistry
Radiolabeling and preparation of 18F-AV-1451 was described previously (16). All productions showed a radiochemical purity above 99% and specific activity exceeding 200 GBq/μmol. The average decay-corrected radiochemical yield was 15.4% ± 5.5% (n = 16) in 60 min.
Human Subjects
Sixteen subjects were enrolled and completed 18F-AV-1451 brain PET studies: 4 young healthy volunteers (YHV) (age, 26–37 y), 4 aged healthy volunteers (AHV) (age, 51–72 y), and 8 AD subjects (age, 57–85 y; Mini-Mental State Examination, 14–29) (Table 1). All subjects gave their written informed consent before participation in this study. The study protocol was reviewed and approved by the New England Institutional Review Board. The study was registered on ClinicalTrials.gov (NCT02370524).
Demographics and Clinical Characteristics
Individuals with mild and moderate AD were required to meet the criteria based on the National Institute of Neurologic and Communicative Disorders and Stroke/Alzheimer Disease and Related Disorders Association and Diagnostic and Statistical Manual of Mental Disorders (17) for study eligibility. All HVs were required to have no evidence of cognitive impairment or early dementia as judged by the investigator. AHVs and AD subjects underwent 18F-florbetapir amyloid imaging at screening and required a visual analysis positive for AD (18) and negative for AHV.
Brain PET Studies
PET images were acquired on an ECAT EXACT HR+ camera (Siemens). Subjects were administered intravenously a single dose of 18F-AV-1451 (Table 1) over 2 min, followed by a 10-mL saline flush.
Dynamic 3-dimensional brain PET images were acquired over 210 min as 3 imaging sessions of 50 min each (0–50, 80–130, and 160–210 min) with 30-min breaks between sessions. The first session consisted of 21 frames (6 × 0.5, 4 × 1, 4 × 2, 7 × 5 min), and the second and third sessions consisted of 10 frames (10 × 5 min). A 68Ge rod source transmission scan was obtained before each emission for attenuation correction. PET data were corrected for randoms, dead time, scatter, and attenuation, and PET images were reconstructed using ordered-subset expectation maximization algorithm (4 iterations, 16 subsets, 5-mm gaussian postprocessing filter).
A structural 3-dimensional T1-weighted MR image was acquired for all subjects on a Espree 1.5-T scanner (Siemens) (magnetization-prepared rapid gradient-echo; inversion time, 1.1 s; repetition time, 1.97 s; echo time, 3.17 ms; flip angle, 15°).
Blood Sampling and Analysis
Arterial blood samples were collected throughout the 210 min of acquisition (every 30 s until 4 min after injection with decreasing frequency thereafter) and whole blood and plasma radioactivity measured in a well-type γ-counter (Wallac 2480; Perkin Elmer). Radiometabolites were measured in a subset of samples (4, 8, 15, 30, 60, 90, 130, 170, and 210 min) by reversed-phase high-performance liquid chromatography, and plasma protein binding free fraction was measured by ultrafiltration (Centrifree; Millipore).
The parent fraction profile was fitted with a monoexponential plus constant function using measurements up to 130 min (last 2 samples at 170 and 210 min suffered from low count statistics and were excluded from the fit), and extrapolated thereafter. The arterial plasma concentration curve was time multiplied by the fitted curve to correct for radiometabolites.
Image Processing and Analysis
Images were analyzed in PMOD 3.607 software (PMOD Technologies). All realignment procedures used normalized mutual information. PET images were motion-corrected within and between imaging sessions by realigning each image to the initial flowlike (15 min) average image. The subject MR image was segmented into gray and white matter maps. The initial flowlike average PET image was used to align the whole PET series onto the MR image, and subsequently both MRI and PET series were spatially normalized to the standard Montreal Neurologic Institute space. Hammers volume-of-interest atlas (19) was applied to normalized PET images, and time–activity curves were extracted for the following brain regions (left- and right-side regions separately): frontal (middle, inferior, superior), parietal, occipital, temporal (superior lateral, inferior lateral, mesial), putamen, caudate nucleus, globus pallidus, thalamus as well as cerebellar cortex, with cortical and cerebellar cortex regions constrained to gray matter voxels. The cerebellar cortex region was eroded away from other regions by 8 mm to minimize spill-over, in particular from the temporal and occipital regions.
The standard 2-tissue-compartment model (2T), 1-tissue-compartment model (1T), and Logan graphical analysis (LGA; t* = 80 min) plasma-based methods were used with the radiometabolite-corrected arterial plasma input function to estimate distribution volume (VT) in specific brain regions (20,21). 1T and 2T used a fixed blood volume of 5%. The binding potential (BPND) was calculated indirectly as (VT – VND)/VND, where VND is the nondisplaceable volume of distribution as estimated in the cerebellar cortex. The noninvasive simplified reference tissue model (SRTM) (22) and noninvasive LGA (NI-LGA; k2' = 0.05 min−1, t* = 80 min) (21) were used to determine directly BPND using the cerebellar cortex as the reference region. For NI-LGA, k2' was fixed to the average value across regions and subjects of k2' calculated with SRTM. VT and BPND were estimated for 130 min (first 2 imaging sessions) and 210 min of data (whole acquisition), and unless specified otherwise the reported results are for 130 min due to the increased input function uncertainty and PET data noise at later times.
SUVs were calculated by normalizing the uptake values by the injected dose divided by the subject weight. Target–to–cerebellar cortex SUVRs were calculated for 4 time intervals (80–100, 110–130, 160–180, and 190–210 min) and compared with BPND.
RESULTS
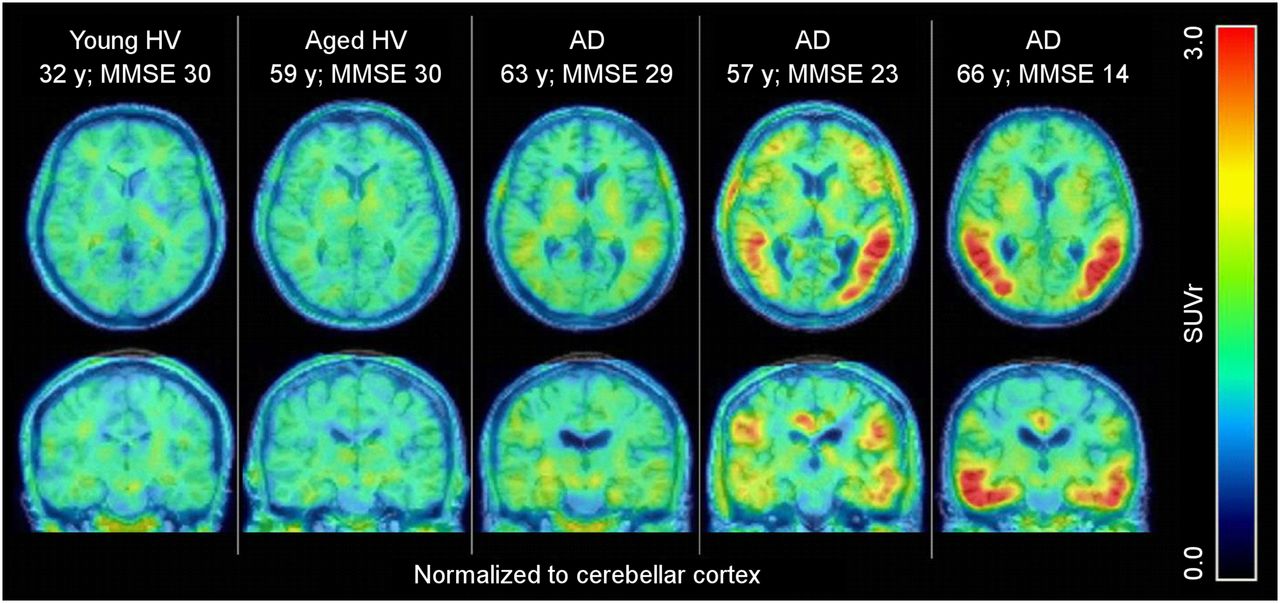
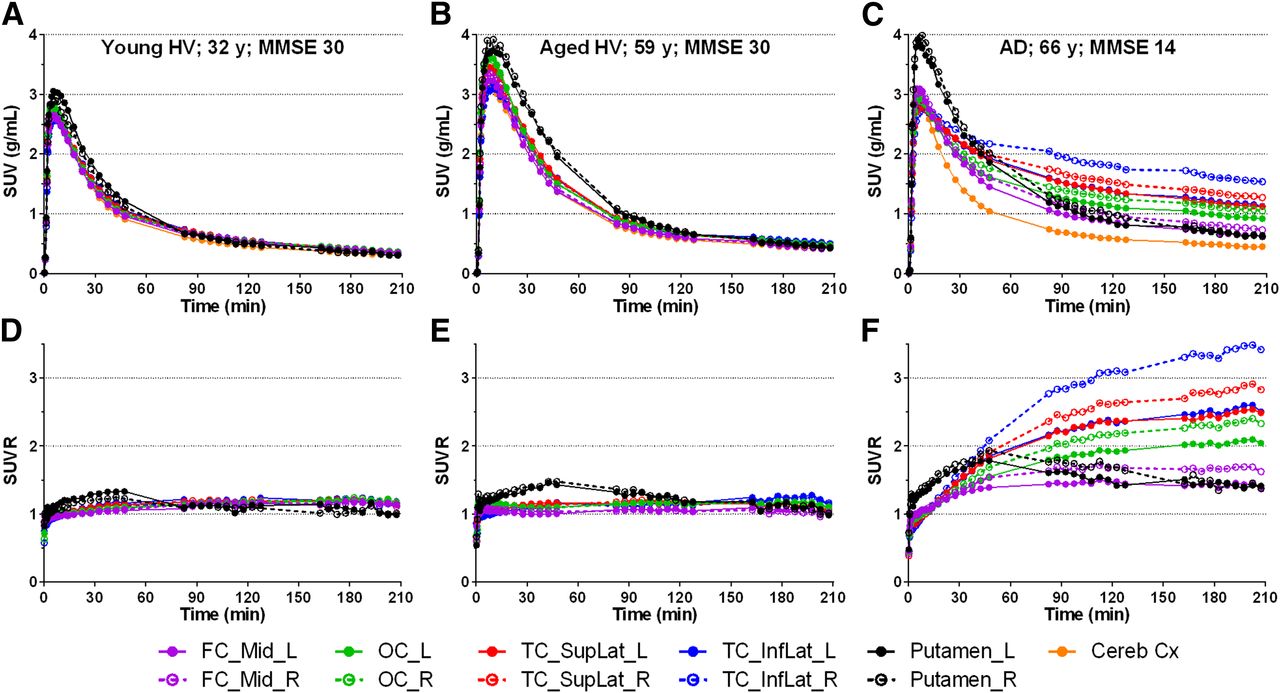
Representative average 18F-AV-1451 SUVR images (80–100 min) are shown in Figure 1 for 1 YHV, 1 AHV, and 3 AD subjects, visually demonstrating increased retention in AD compared with HV. Time–activity and SUVR curves are shown in Figure 2 for 1 YHV, 1 AHV, and 1 AD subject. YHVs and AHVs display rapid uptake and clearance of the tracer across all brain regions, with putamen uptake slightly elevated initially in YHVs and clearly elevated in AHVs. Retention of the tracer was observed in AD in cortical regions with noticeable region-specific and asymmetrical signal, with further elevated putamen uptake exhibiting different kinetics compared with cortical regions with high initial uptake and much faster clearance. Pseudoequilibrium was not reached at 210 min after injection with SUVR curves still increasing. Additional across-subject comparison of SUVR curves per region are provided in Supplemental Figures 1–6 (supplemental materials are available at http://jnm.snmjournals.org).

18F-AV-1451 SUVR images (80–100 min) superimposed onto subject’s MR image in transaxial (top row) and coronal (bottom row) views in 1 YHV, 1 AHV, and 3 AD subjects.

18F-AV-1451 time–activity and SUVR curves in YHV (A and D), AHV (B and E), and AD subject (C and F). Closed symbols and solid lines = left side; open symbols and dashed lines = right side; cereb Cx = cerebellar cortex; FC_Mid = frontal middle cortex; OC = occipital cortex; TC_InfLat = inferior lateral temporal cortex; TC_SupLat = superior lateral temporal cortex.
Moderately fast metabolism of 18F-AV-1451 was observed (Fig. 3A), with 2 main radiometabolites much more polar than the parent. At 90 min after radiotracer injection, the parent fraction in arterial plasma was 17.3% ± 7.0% across all subjects (n = 16). No difference was observed among the 3 groups. The free fraction in plasma was low at 0.19% ± 0.12% (n = 16). The average metabolite-corrected arterial plasma is also shown in Figure 3B.
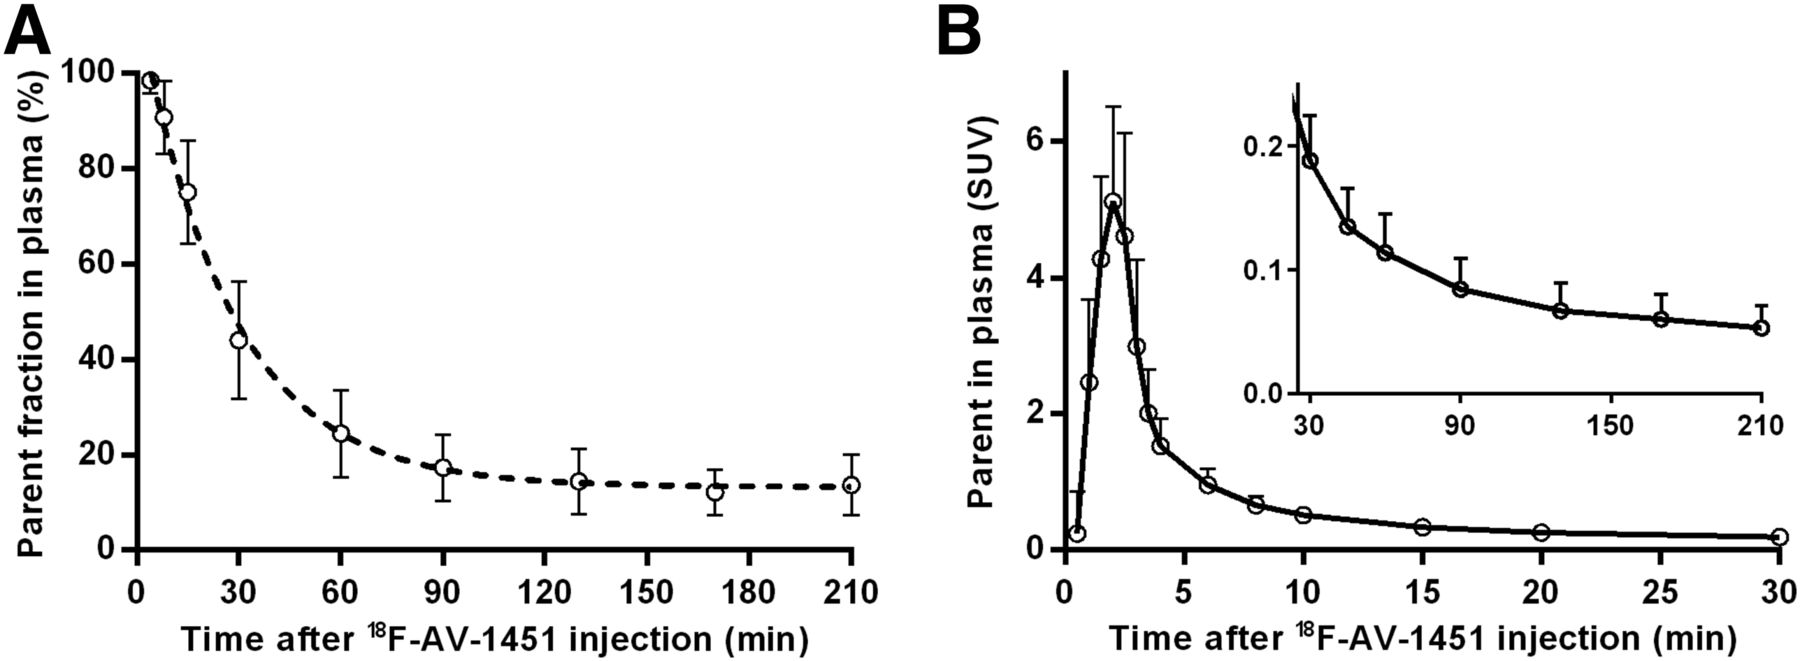
(A) Average (mean ± SD) parent fraction profile in arterial plasma after intravenous administration of 18F-AV-1451. Dashed line represents monoexponetial plus constant fit up to 130 min. (B) Average (mean ± SD) radiometabolite-corrected arterial plasma concentration of 18F-AV-1451 (input function).
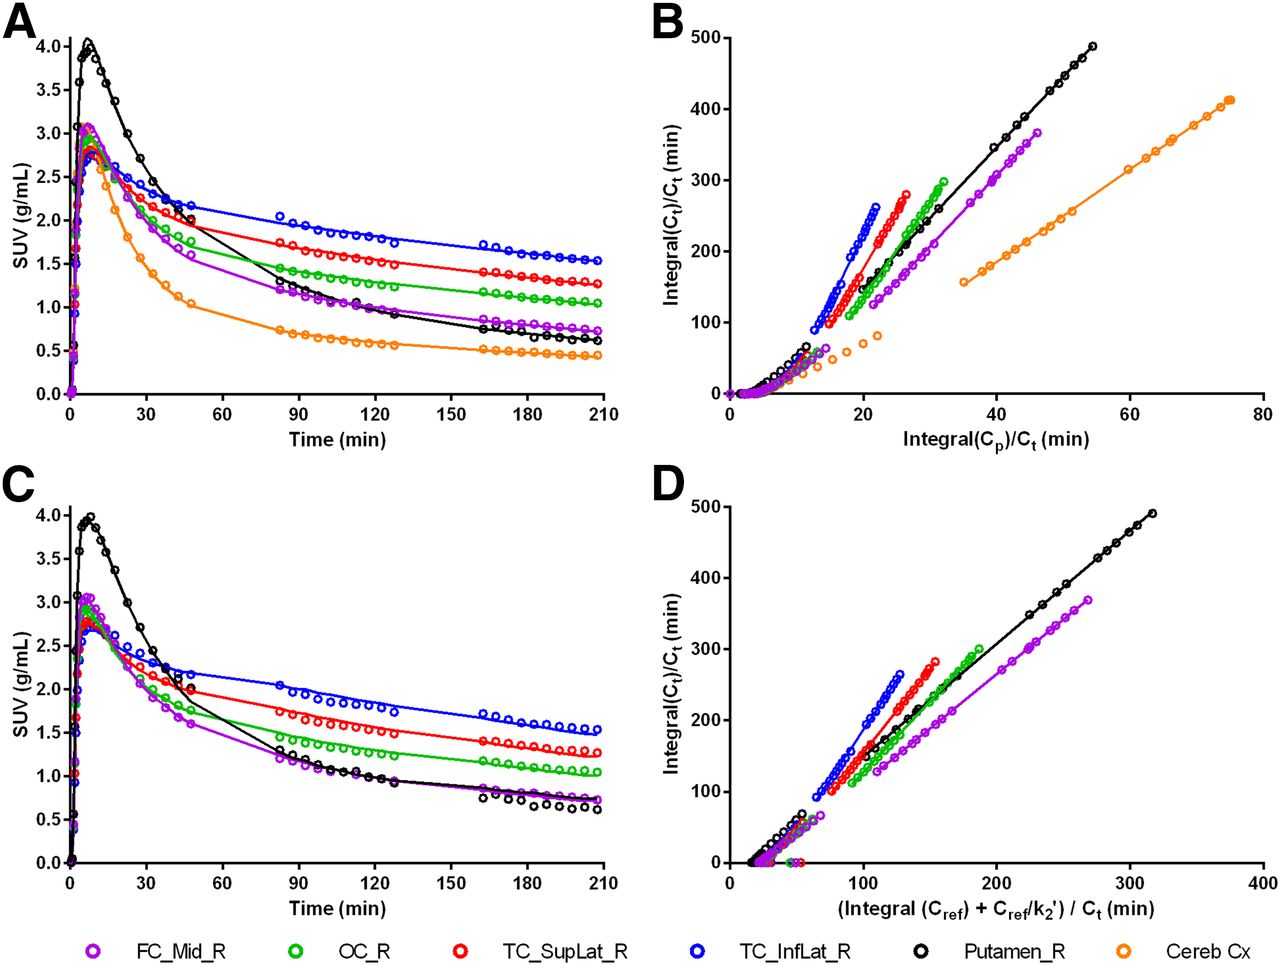
Examples of fits/linear regression for 210 min of data are shown in Figure 4 for an AD subject. 2T described adequately the data up to 210 min. 1T gave poor fits for all subjects and regions, including the cerebellar cortex (data not shown) and is not reported further. LGA or NI-LGA plots are close to linearity for the last 2 imaging sessions. SRTM did not describe the data as well over 210 min, with some convergence or fit difficulties in some regions while showing excellent agreement with NI-LGA (R2 > 0.99, linear regression on top of identity line), and is therefore not reported further.

Compartmental and graphical analysis for AD for 210 min of scanning data: 2T fits (A), LGA linear regression (B), SRTM fits (C), and noninvasive LGA linear regression (D). Open symbols = measured data; solid lines = fitted curve/line; Cereb Cx = cerebellar cortex; FC_Mid = frontal middle cortex; OC = occipital cortex; TC_InfLat = inferior lateral temporal cortex; TC_SupLat = superior lateral temporal cortex.
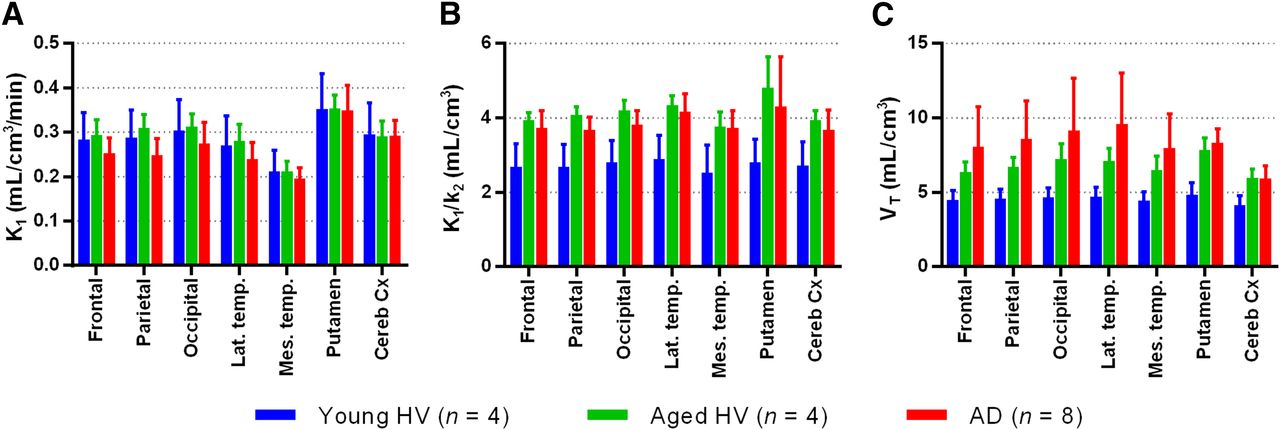
Detailed results of the 2T analysis are given in Table 2 and Figure 5. K1 was regionally different, highest in the putamen, but appeared similar in YHVs and AHVs in all regions (within ∼3%) and across the 3 groups in the cerebellar cortex and putamen, whereas it was lower by approximately 10%–15% in the cortical regions of AD subjects, similar to previous findings (23). K1/k2 was clearly lower by about 30% in YHVs including in the cerebellar cortex (2.7 mL/cm3) compared with AHVs (3.9 mL/cm3) and AD subjects (3.7 mL/cm3). VT was elevated in the cortical regions of AD subjects (as expected) but similar between AHVs and AD subjects in the cerebellum (6.0 and 5.9 mL/cm3, respectively), whereas it was noticeably lower by again 30%–35% in YHVs, with 4.1 mL/cm3 for the cerebellar cortex. A regression analysis (Fig. 6) showed a correlation between VT and the subject's age, with an R2 greater than 0.87 (n = 8, YHV and AHV) and a higher increase with age in the putamen (slope of ∼0.095) compared with other regions (slope of ∼0.06–0.08). K1 and VT were well identified, with parameter errors of 2%–4%. The identifiability for k2 was decreased (error up to ∼7%), but the ratio K1/k2 maintained an acceptable error of approximately 4%, except in the mesial temporal and putamen. k3 and k4 were not well identified (errors up to ∼25%), in particular for k3 in the mesial temporal and putamen (30%–35%), whereas k3/k4 was better defined (∼10%), except in the mesial temporal and putamen (15%–25%), where the increased errors in these regions is likely caused by higher correlation between k2 and k3 (24).
Estimates of 2T Parameters and Macroparameters Using 130 Minutes of Scanning Data

2T parameters using 130 min of scanning data. Values are mean ± SD within each group. Average of left and right regions; frontal = average of inferior, superior, and middle; lateral temporal = average of superior and inferior.

Linear regression of VT (2T, 130 min) against subject’s age in lateral temporal cortex (A), parietal cortex (B), putamen (C), and cerebellar cortex (D). Blue symbols = YHV; green symbols = AHV; solid line = linear regression. AD (gray symbols) were excluded from regression analysis and are shown for information only: open symbols = Mini-Mental State Examination > 25 (low tau signal), closed symbols = Mini-Mental State Examination < 25.
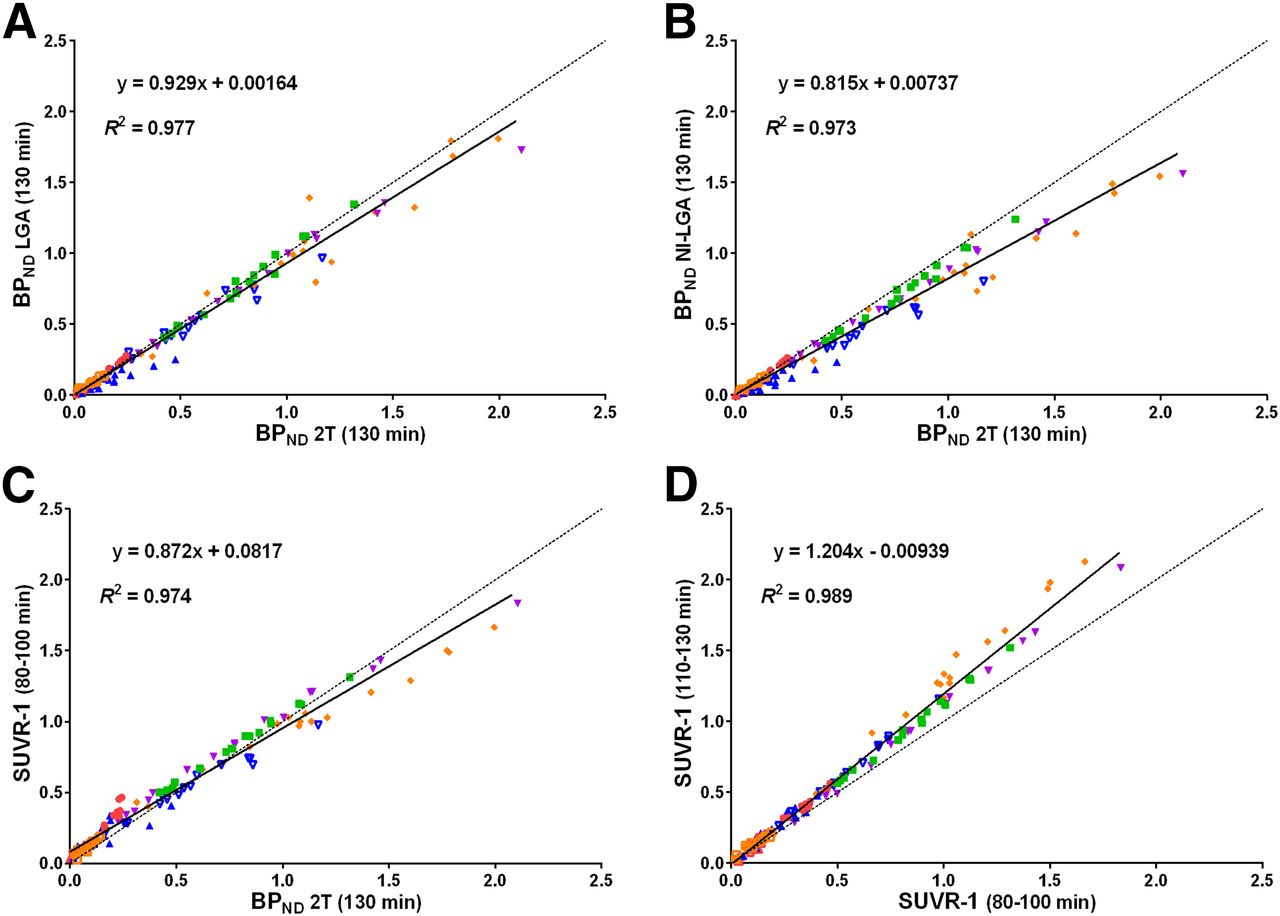
Results of BPND and SUVR are summarized in Supplemental Table 1, and correlation analyses between these measurements in cortical regions (AD only) are provided in Table 3 and shown in Figure 7. Overall, a good correlation was found between all methods and scan durations with an R2 greater than 0.96. LGA and NI-LGA underestimated BPND by approximately 10% and 20%, respectively, compared with 2T. The agreement between 2T and SUVR-1 in terms of R2 was similar for 80–100 min and 110–130 min, whereas it was slightly better for 110–130 min when compared with LGA or NI-LGA estimates, although when additionally considering a slope closer to unity and a smaller bias (introduced through the intercept) the 110- to 130-min interval performed better. Within-method comparison showed a time-dependency of the estimates, with BPND increasing by 15%, 10%, and 12% for 2T, LGA, and NI-LGA, respectively, and VT increasing by about 20% for both 2T and LGA (with a higher R2 for the graphical methods) when using 210 min of data, likely because of nonequilibrium between plasma and brain regions. LGA VT correlated strongly with 2T (R2 > 0.98), with, however, an underestimation of about 5%.
Linear Regression Analysis of BPND and SUVR Estimates Across Methods and Scanning Duration (130 and 210 Minutes) in AD (n = 8)

Regression analysis in AD (n = 8) between BPND 2T (130 min) and BPND LGA (130 min) (A), BPND NI-LGA (130 min) (B), and SUVR-1 (80–100 min) (C), and between SUVR-1 (80–100 min) and SUVR-1 (110–130) (D). Colors indicate different subjects; solid line = linear regression; dashed line = line of identity.
DISCUSSION
We report the kinetic analysis of 18F-AV-1451 using an arterial input function to evaluate its pharmacokinetic properties in the brain. AD demonstrated increased 18F-AV-1451 retention compared with HV visually in cortical regions in which paired helical filament tau accumulation is expected in AD, as well as quantitatively based invasive (2T and LGA) and noninvasive (NI-LGA and SUVR) analyses. Subjects with presumed negligible or low tau exhibited evidence of equilibration with constant tissue ratios attained, whereas those with presumed substantial tau showed steady accumulation beyond 210 min. Despite these kinetic characteristics, a comparison between the invasive 2T and SUVR showed a strong linear correlation (R2 > 0.96) between BPND and SUVR-1 across subjects and across regions. Both imaging time intervals of 80–100 min and 110–130 min gave comparable results, in agreement with previous findings (25), with a bias of less than 10%–15% compared with BPND, although overall the latter (110–130 min) interval performed slightly better. The observed linearity between SUVR and BPND suggests that SUVR would provide robust estimates across levels of tau for cross-sectional or longitudinal imaging studies, although further studies with dynamic image acquisition may be warranted to confirm the linearity of the relationship across a wider range of tau load. In this study, other factors such as the SUVR reproducibility at different time intervals or its sensitivity to blood flow were not taken into consideration. The impact of regional cerebral blood flow changes, likely to happen in AD (26), on SUVR but also BPND, needs further investigation through computer simulations, BPND being likely less sensitive but requiring dynamic data acquisition not always feasible in clinical studies. Additionally, our results highlight the time dependence of SUVR (Fig. 7D), and the scan imaging time should be controlled, particularly in longitudinal or drug-development studies, so that additional variability in ΔSUVR assessments is not introduced.
A different kinetic profile was observed in the putamen, globus pallidus, and thalamus compared with cortical regions (Supplemental Figs. 5 and 6), suggesting that 18F-AV-1451 may bind to a different site in these regions, with a higher (about double) k4 than in cortical regions (Table 2). Furthermore, similar to our findings of elevated signal in the putamen and globus pallidus in AHVs and AD subjects compared with YHVs, an increased SUVR in older subjects was recently reported (27) where it was hypothesized that the higher uptake was due to an increased capillary permeability in the putamen and globus pallidus, but not in the cerebellar cortex. An increased capillary permeability would imply an increased extraction and in turn, under passive transport condition through the blood–brain barrier, an increased K1 and k2 that would produce an initial higher uptake (higher K1) followed by a faster washout (higher k2). However, our kinetic modeling results showed similar K1 across the 3 groups in the putamen and cerebellar cortex with, on the other hand, a lower k2 (higher K1/k2) in AHVs and AD subjects compared with YHVs.
VT was increased in AHVs and AD subjects not solely in the putamen but in all brain regions investigated, including the cerebellar cortex (Fig. 5; Table 2). Furthermore, this increase was found to be age dependent (Fig. 6). This age-dependent VT increase appears through the k2 parameter (negative correlation), although because of parameter identifiability (correlation between k2 and k3) (24), it was more pronounced for VT. Although the age dependency mostly normalized out when calculating SUVR or BPND with, for instance, a remaining correlation between the subject’s age and SUVR (80–100 min) of R2 = 0.79 in the putamen (P < 0.001, increase of 0.0060/y) and of R2 = 0.31 in the lateral temporal cortex (not significant, P = 0.1; increase of 0.0017/y), these findings suggest that HVs should be age-matched with AD subjects when using SUVR or BPND because VT increased in the cerebellar cortex. One interpretation of these results would be of an age-dependent increase of nonspecific signal or binding to a secondary target not kinetically separated from the nondisplaceable signal, although it is not clear what a widespread secondary binding increasing with age would be. Another interpretation would be a change of the tracer efflux to plasma (27), although this would imply some transport mechanism through the blood–brain barrier other than passive diffusion.
CONCLUSION
18F-AV-1451 retention is currently assessed in clinical studies of AD at 80–100 min after injection. Simplified methods of image acquisition or analysis often require a trade-off between accuracy and simplicity, and given the good correlation between BPND and SUVR-1, our data suggest that SUVR estimates in this imaging window provide information of tau burden, with an underestimation of 10%–15% for higher tau load, although the later imaging window of 110–130 min performed slightly better. Consideration should be given to imaging time in longitudinal or drug-development studies so that additional variability in the assessment of tau load changes is not introduced, and SUVR sensitivity to changes in regional cerebral blood or clearance should be further investigated.
DISCLOSURE
This study was sponsored by Molecular Neuroimaging, a division of inviCRO, and funded by Roche. Olivier Barret, David Alagille, Caroline Papin, Thomas Morley, Ken Marek, John P. Seibyl, Gilles D. Tamagnan, and Danna Jennings are employees of Molecular Neuroimaging. Robert A. Comley, Edilio Borroni, and Nicholas Seneca are employees of Roche; Sandra Sanabria and Robby M. Weimer are employees of Genentech; and Mark Mintun is employee of Avid. No other potential conflict of interest relevant to this article was reported.
Acknowledgments
We thank Julie C. Price for reading the manuscript and providing suggestions.
Footnotes
Published online Dec. 1, 2016.
- © 2017 by the Society of Nuclear Medicine and Molecular Imaging.
REFERENCES
- Received for publication August 19, 2016.
- Accepted for publication November 22, 2016.


Jump to section
Related Articles
Cited By...
- CenTauR: Towards a Universal Scale and Masks for Standardizing Tau Imaging Studies
- The RSNA QIBA Profile for Amyloid PET as an Imaging Biomarker for Cerebral Amyloid Quantification
- {alpha}-Synuclein PET and Parkinson Disease Therapeutic Trials: Ever the Twain Shall Meet?
- An optimized reference tissue method for quantification of tau protein depositions in diverse neurodegenerative disorders by PET with 18F-PM-PBB3 (18F-APN-1607)
- Evaluation of Dosimetry, Quantitative Methods, and Test-Retest Variability of 18F-PI-2620 PET for the Assessment of Tau Deposits in the Human Brain
- Effect of Off-Target Binding on 18F-Flortaucipir Variability in Healthy Controls Across the Life Span
- Evaluation of 18F-RO-948 PET for Quantitative Assessment of Tau Accumulation in the Human Brain