


Abstract
18F-(E)-N-(3-iodoprop-2-enyl)-2β-carbofluoroethoxy-3β-(4′methylphenyl)nortropane (18F-FE-PE2I) is a newly developed dopamine transporter (DAT) PET radioligand. Full quantification methods rely on dynamic acquisition of 18F-FE-PE2I, but in a clinical setting a simplified protocol is preferable. The aims of this study were to identify the optimal acquisition time window for 18F-FE-PE2I and to validate the specific binding ratio (SBR) as a simplified quantification method. Methods: Ten Parkinson disease (PD) patients and 10 controls were included. Ninety-three-min dynamic PET measurements with 18F-FE-PE2I were conducted using the high-resolution research tomograph (HRRT). The dynamic measurement was also smoothed to the resolution of a clinical PET system (HR). Regions of interest for the caudate, putamen, ventral striatum, substantia nigra (SN), and cerebellum were manually drawn on coregistered MR images. The outcome measure was the SBR, and the gold standard was the binding potential obtained with wavelet-aided parametric imaging (WAPI BPND). The cerebellum was used as a reference region. In a preliminary analysis, SBR was computed for 8 time windows (SBRdyn). Linear regression analysis and Bland–Altman plots were used to select the optimal acquisition time window. An average image from the selected time window was created, from which new SBR values (SBR calculated on the average image on the HRRT and SBR calculated on the average image on the simulated HR images) were calculated and compared with WAPI BPND. The effect size was calculated. Results: SBRdyn values for the time window between 16.5 and 42 min correlated best with WAPI BPND (r2 = 0.98, P < 0.001). Significant correlations (P < 0.001) were observed between SBRHR and WAPI-BPND (r2 = 0.95 in controls and 0.97 in PD patients). In the striatum, SBRHR values were 37% lower than BPND in controls, 29% in PD patients, whereas in the SN the underestimation was 22% in controls and 15% in PD patients. Similar effect sizes for BPND and SBRHR were found in the caudate (0.6), putamen (1.7 and 1.4), ventral striatum (0.7), and SN (0.5 and 0.4). Conclusion: A single 18F-FE-PE2I acquisition between 16.5 and 42 min provides the best outcome measure for simplified DAT quantification. Despite underestimation of the BPND, the SBR can be used in a clinical setting as a valid quantification method for DAT using 18F-FE-PE2I, because it provides differentiation similar to BPND between controls and PD patients.
The dopaminergic system has a crucial role in the pathogenesis of several psychiatric and neurodegenerative diseases (1–6) and has been the focus of research for decades. The link between dopaminergic degeneration and the pathophysiology of motor symptoms in Parkinson disease (PD) has been known for more than a century (7), and despite this acquired knowledge the dopaminergic system is still an active field of research.
The dopamine transporter (DAT), a presynaptic membrane protein responsible for dopamine reuptake, plays a key role in regulating the intensity and duration of the dopaminergic neurotransmission (8,9). Imaging of the DAT is a marker of presynaptic neuronal integrity and is a valuable tool for understanding the relationship between the nigrostriatal dopaminergic degeneration and the clinical manifestations in PD (10,11). Several studies have demonstrated the utility of DAT imaging in clinical applications, and numerous SPECT and PET radioligands targeting the DAT have been developed (12).
18F-(E)-N-(3-iodoprop-2-enyl)-2β-carbofluoroethoxy-3β-(4′methylphenyl)nortropane (18F-FE-PE2I) is a radioligand for the DAT recently developed at the Karolinska Institutet PET Centre. In nonhuman primates, 18F-FE-PE2I showed favorable kinetic properties, such as high target-to-background ratio, fast washout from the brain, early peak equilibrium, and favorable metabolic profile, with less abundance of radiometabolites that could cross the blood–brain barrier. 18F-FE-PE2I showed in vitro and in vivo selectivity for the DAT as compared with other monoaminergic transporters, as well as a suitable affinity for the DAT (12 nM measured in vitro) (13–15). Noninvasive quantification methods, namely simplified reference tissue model (SRTM) and Logan graphical analysis (LoganRef), provide accurate quantification of DAT availability and binding potential (BPND) values in close agreement with those obtained using the arterial input function (16).
Studies conducted on healthy human subjects confirmed that SRTM, using the cerebellum as a reference region, is an accurate noninvasive quantification method, providing reliable quantification of DAT availability (17,18). The first applied study using 18F-FE-PE2I in PD patients demonstrated that the radioligand has a similar metabolism in PD patients and control subjects and that it enables accurate quantification of DAT availability both in the striatum, at the axonal terminal level, and in the substantia nigra (SN), where the cell bodies of the dopaminergic neurons are located (19).
The validated noninvasive methods for DAT quantification (SRTM and LoganRef) rely on PET dynamic acquisitions, and this aspect consistently limits their use in clinical settings, in which dynamic acquisitions are not always feasible. The purpose of this study was therefore to validate the specific binging ratio (SBR) as a simplified quantification method for 18F-FE-PE2I, identifying the optimal acquisition time window that can be used in a clinical setting.
MATERIALS AND METHODS
Subjects and PET Procedure
The study was approved by the Ethics Committee of the Stockholm Region and by the Radiation Safety Committee of the Karolinska University Hospital, Solna, Stockholm, Sweden. Written consent was obtained from each subject after detailed explanation of the study procedures. Ten control subjects were recruited by an advertisement in a local newspaper. They were considered healthy after negative physical examination, blood tests, electrocardiogram, brain MRI, and history of psychiatric conditions. The control subjects were chosen to match for age and sex 10 PD patients recruited at the Movement Disorder Clinic of the Karolinska University Hospital, Huddinge, Stockholm, Sweden. PD patients satisfied the clinical diagnosis of PD according to the U.K. Parkinson Disease Society Brain Bank diagnostic criteria. All characteristics of control subjects and patients as well as the PET experimental procedure have been previously described (19). Relevant demographic and clinical data are shown in Table 1. Briefly, 208 ± 11 and 198 ± 19 MBq of 18F-FE-PE2I were injected in control subjects and PD patients, respectively. Specific radioactivity at the time of injection was 129 ± 47 GBq/μmol in control subjects and 179 ± 124 GBq/μmol in PD patients. A 93-min PET dynamic acquisition was obtained using the High-Resolution Research Tomograph (HRRT) system (Siemens Medical Solutions) (20). MRI scans, obtained for all participants using a 3-T unit (Discovery MR750; GE Healthcare), were used as part of the initial evaluation, to delineate anatomic brain regions of interest (ROIs) and for coregistration with PET images. Five ROIs were manually drawn on the caudate, putamen, ventral striatum (VS), SN, and cerebellum.
Demographic and Clinical Data of Controls and PD Patients
DAT Quantification
The clinical outcome measure that we intended to validate as a simplified quantification method for 18F-FE-PE2I was the SBR. The cerebellum was used as a reference region (REF). The SBR was obtained as the difference between the SUV in the ROI and the SUV in the REF, divided by the SUV in the REF: SBR = (SUVROI – SUVREF)/SUVREF. To reproduce conditions equivalent to a clinical setting, the original HRRT dynamic images were smoothed to the resolution of a clinical PET system using a gaussian filter with a value determined experimentally using National Electrical Manufacturers Association phantom studies conducted in the lower resolution ECAT EXACT HR PET system (Siemens Medical Solutions) and the HRRT systems.
Parametric images were generated using wavelet-aided parametric imaging (WAPI) (21). WAPI uses the LoganRef to compute BPND in every voxel. The cerebellum was used as a reference region. The ROIs were projected to the parametric images using the MR-to-PET transformation to estimate regional BPND (19).
In this study, the gold standard outcome measure was the BPND obtained from parametric images. This approach was selected because in small brain regions such as the SN, accurate PET quantification relies on the use of WAPI that can help to decrease the intrinsic noise of the dynamic data (21). In addition, PET data were analyzed using the regular ROI-based models, SRTM and LoganRef, using the cerebellum as a reference region. The quantitative analysis was performed with PMOD software (version 3.3; PMOD Group).
Optimal Acquisition Time Window Selection and Statistical Analysis
Eight different time windows were selected, and from the extracted regional time–activity curves, SBRdyn was calculated for each time window (Table 2; Supplemental Fig. 1 [supplemental materials are available at http://jnm.snmjournals.org]). Linear regression analysis and Bland–Altman plots were used to select the time window providing SBRdyn values in closest agreement with voxel-based WAPI BPND, which was used in our study as the gold standard outcome measure. Bland–Altman plots were generated for each time window by plotting on the x-axis the mean value between BPND and SBR and on the y-axis the difference between BPND and SBR. The closest agreement was defined as that providing r2 closer to 1 and slope of the Bland–Altman plot closer to 0. The time window that provided the best agreement was then used to create an average image from the corresponding time frames in the original HRRT dynamic image as well as from the HR image. These new sets of images were realistic simulations of what a clinical static examination would look like in 2 different systems, given the optimal time window for acquisition. The SBR was computed in each ROI directly on the average images (SBRHRRT and SBRHR [SBR calculated on the average image on the HRRT and SBR calculated on the average image on the simulated HR images, respectively]) and compared with the WAPI BPND using linear regression analysis and r2. The percentage difference between SBRHRRT, SBRHR, and WAPI BPND was calculated using the following formula: Cohen effect size was used to assess the ability of the SBR to differentiate PD patients from controls and was calculated using the following formula:
 Effect size was computed for SBRHR, SBRHRRT, SRTM, LoganRef, and WAPI BPND. The effect size was thus examined also with BPND values obtained from ROI-based and kinetic analyses, because this approach would be more appropriate in a clinical setting in which parametric images of BPND are not typically obtained.
WAPI BPND and SBRdyn Correlation for 8 Different Time Windows
RESULTS
Optimal Acquisition Time Window and Statistical Analysis
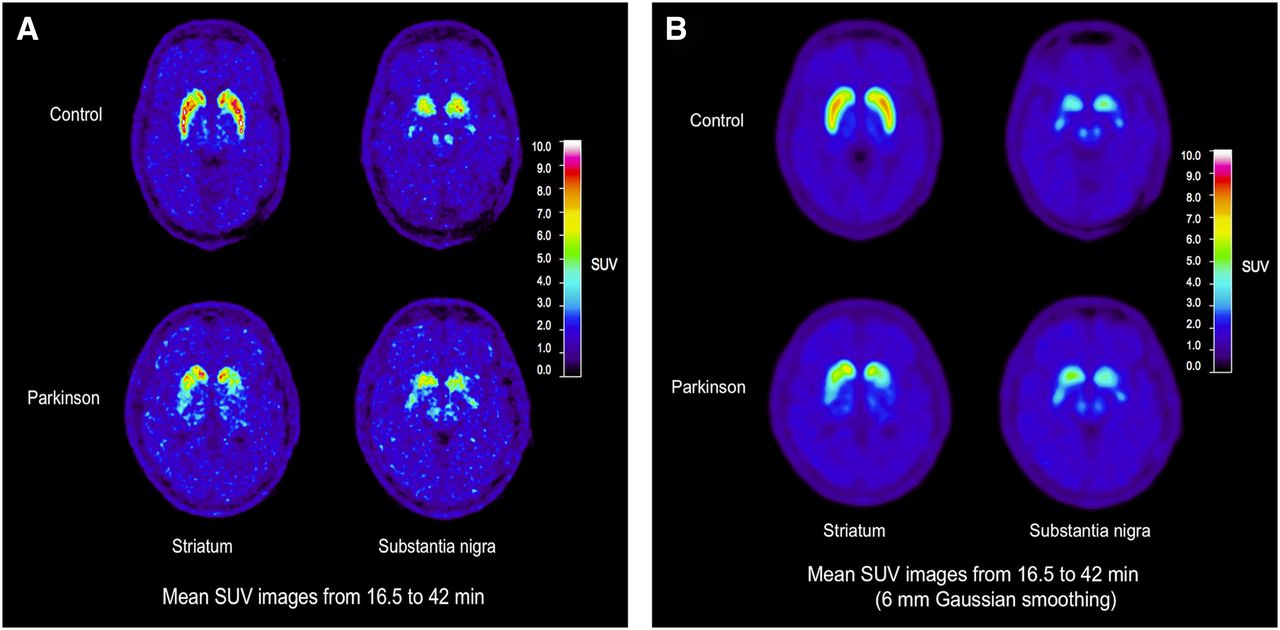
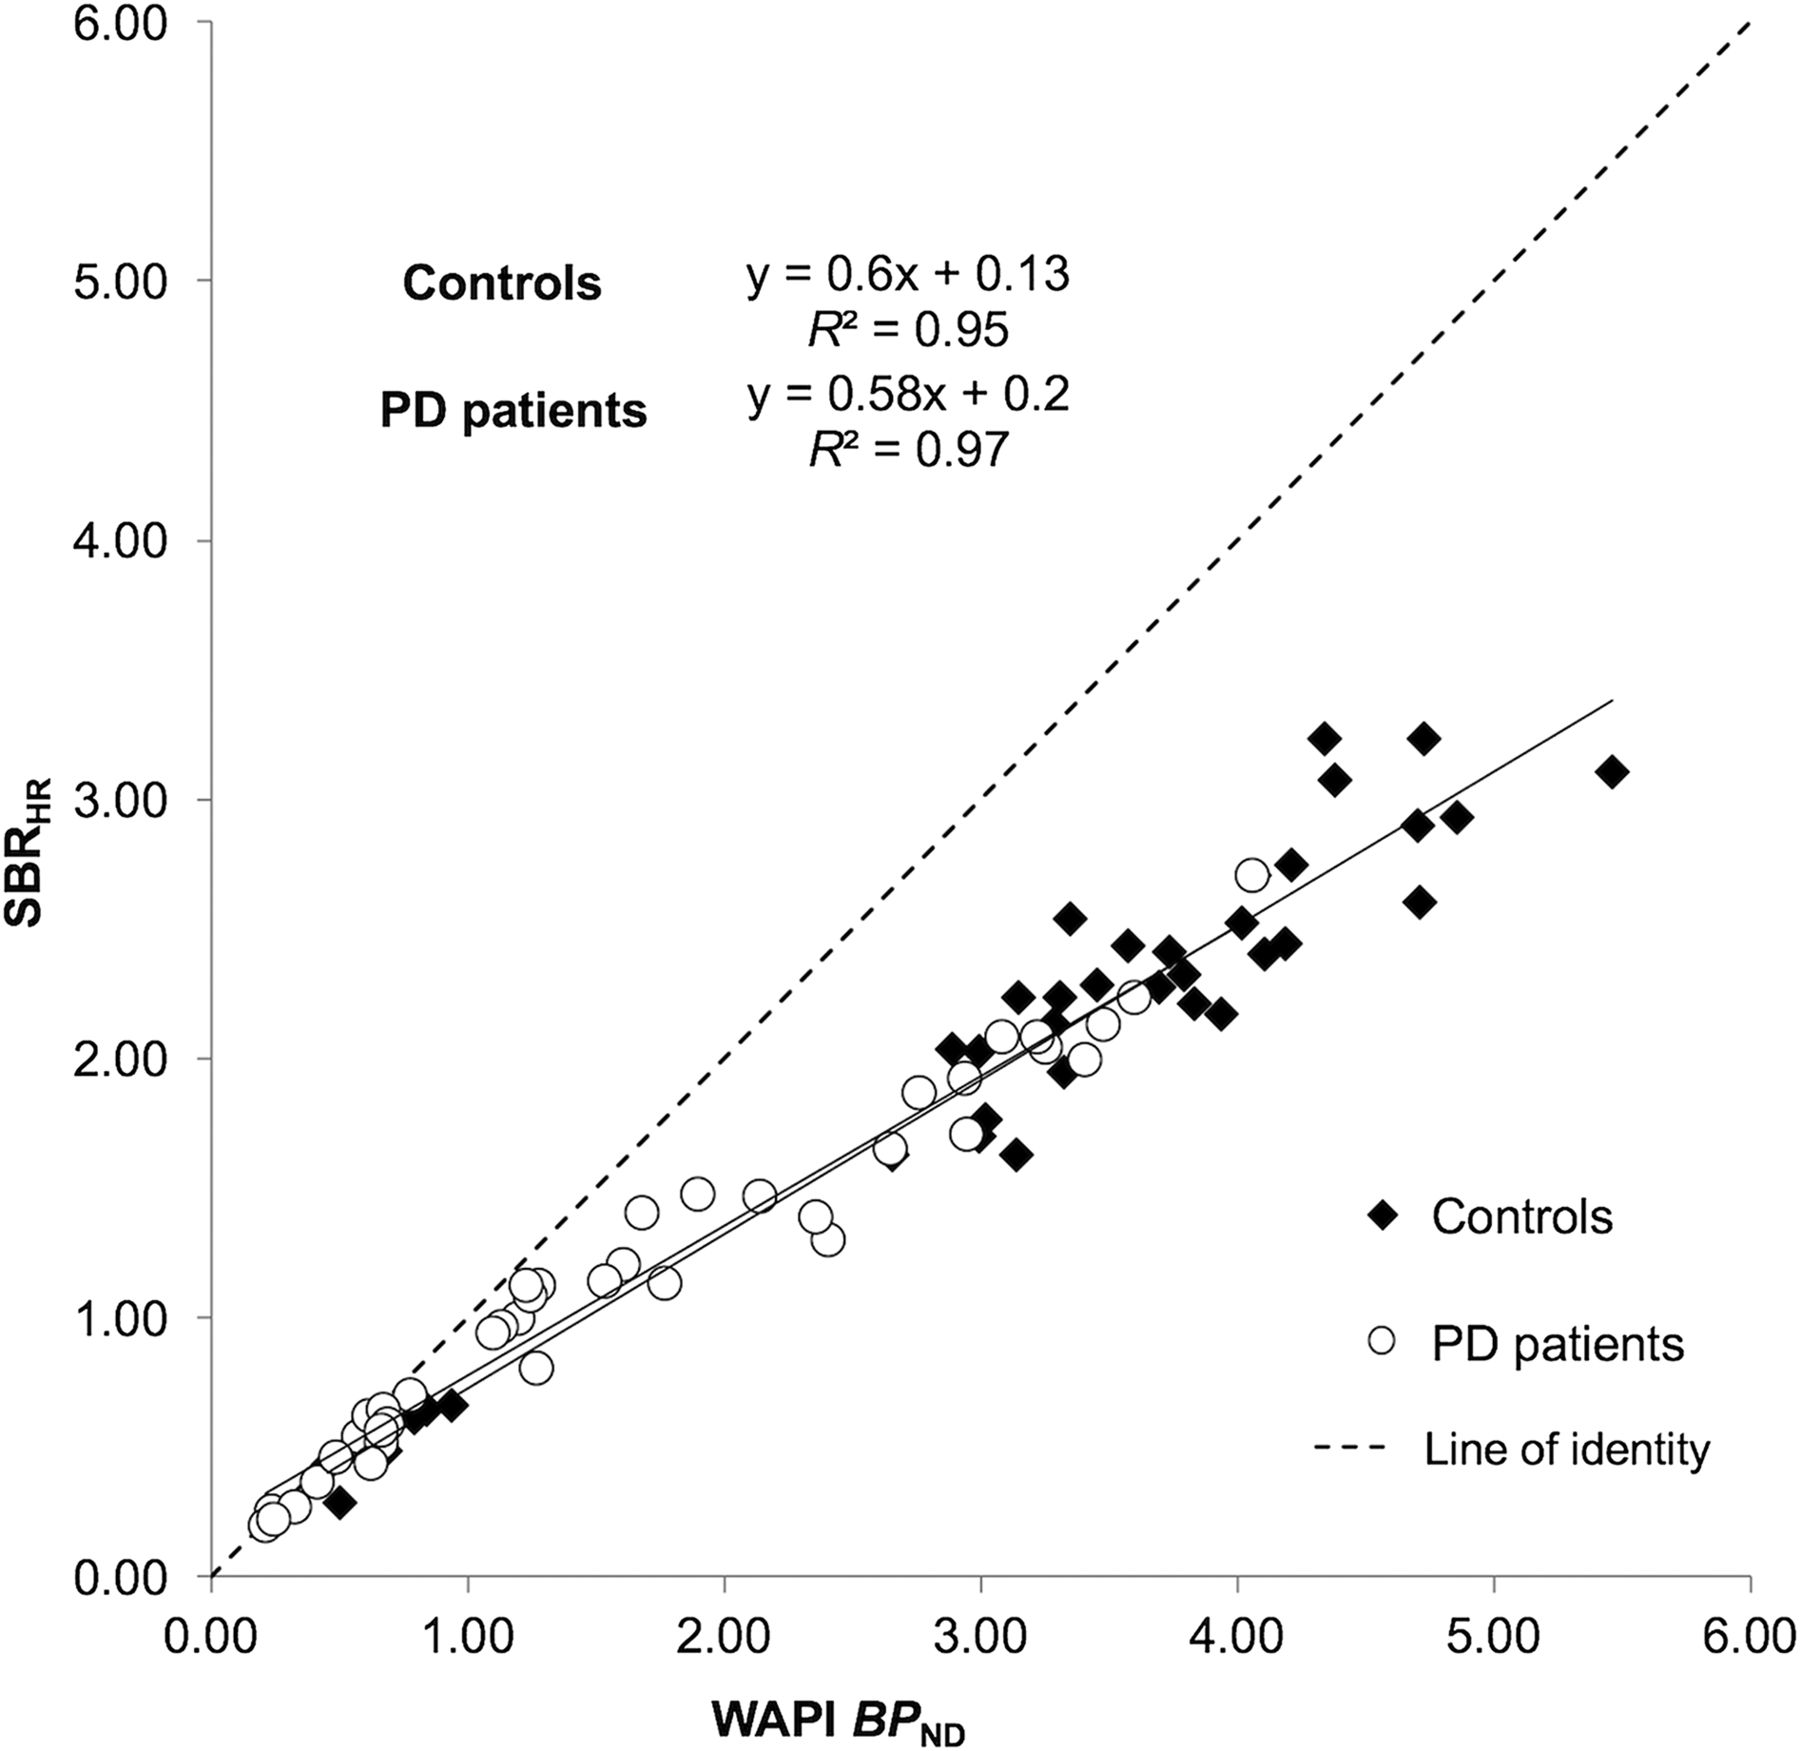
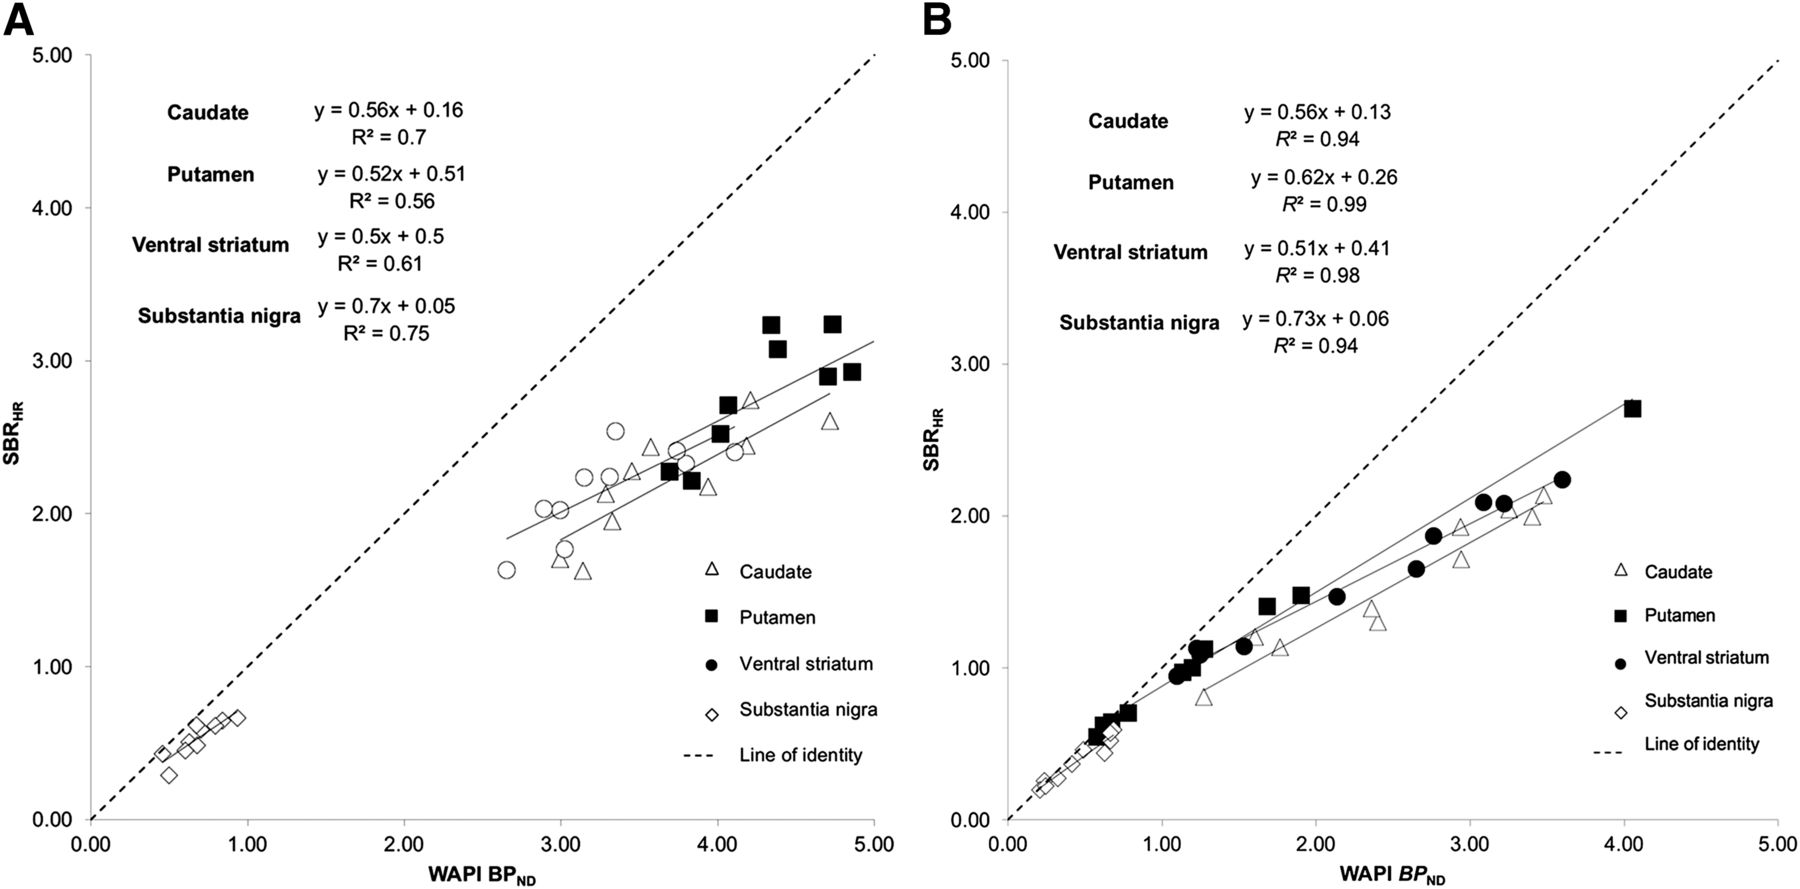
A significant correlation was found between WAPI BPND and SBR values obtained for all 8 time windows (r2 values were between 0.95 and 0.99, P < 0.001; Supplemental Fig. 2). SBRdyn values in closest agreement to WAPI BPND were those calculated for a time window between 16.5 and 42 min (r2 = 0.98, and slope of Bland–Altman plot = 0.15) (Table 2; Supplemental Figs. 3 and 4). The other time window for which SBRdyn values were in close agreement to WAPI BPND was the one between 30 and 42 min (r2 = 0.98, and slope of Bland–Altman plot = −0.14; Supplemental Fig. 3). SBRdyn values obtained with this time window tended to be higher than BPND in the range of control values (slope of regression line and of Bland–Altman plot in Table 2). To avoid possible overestimation of differences between control subjects and PD patients, the time window between 30 and 42 min was not selected for further analysis. The average images obtained using the selected time window for both HRRT and simulated HR data enabled the visualization of the striatum and of the SN in the midbrain, both in controls and in PD patients (Fig. 1). SBRHRRT and SBRHR values showed a strong correlation with WAPI BPND values (r2 = 0.98 and 0.97 for SBRHRRT and SBRHR, respectively, P < 0.001) (Fig. 2). When SBRHR values of controls and PD patients were compared with WAPI BPND separately, the correlation was strong in both groups (r2 = 0.95 and 0.97, respectively, P < 0.001) (Fig. 3). The linear regression analysis comparing SBRHR and BPND separately for each ROI showed the highest r2 values in the putamen of PD patients (r2 = 0.98, P < 0.001) and the lowest value in the putamen of controls (r2 = 0.56, P < 0.05) (Figs. 4A and 4B).

HRRT average image (A) and HR average image (B) obtained using selected optimal acquisition time window. Axial images are at level of striatum and midbrain (SN).

Linear regression analysis of WAPI BPND and SBR calculated on average images obtained using selected time window (from min 16.5 to 42), on HRRT and simulated HR systems.

Linear regression analysis of WAPI BPND and SBRHR in controls and PD patients. SBRHR was obtained from average images using selected time window.

Linear regression analysis of SBRHR and WAPI BPND for controls (A) and PD patients (B) in all regions examined. SBRHR was obtained from average images using selected time window.
Regional Differences in Controls and PD Patients and Effect Size
SBRHRRT values were lower than WAPI BPND values in all ROIs except the SN (Table 3). SBRHR values were lower than WAPI BPND values in all ROIs, both in controls and in PD patients (Table 3). For both SBRHRRT and SBRHR, the underestimation of WAPI BPND, evaluated in percentage difference, was smaller in PD patients than in controls. Despite this underestimation, similar effect sizes for BPND, SBRHRRT, and SBRHR were found in the caudate, putamen, VS, and SN (Table 4). The ROI showing the highest effect size, indicating a large difference between controls and PD patients’ values, was the putamen, in agreement with the putamen being the area mostly affected by the nigrostriatal degeneration in PD patients (Table 4). The effect sizes for SBRHRRT and SBRHR were also similar to BPND estimated with SRTM and LoganRef.
Percentage Difference Between WAPI BPND and SBR values (SBRHRRT and SBRHR) in Controls and PD Patients
Cohen Effect Size for All ROIs
DISCUSSION
18F-FE-PE2I is a promising imaging tool for in vivo quantification of DAT availability by means of PET (17,19), but so far the radioligand has not been investigated in conditions resembling a clinical setting. The noninvasive quantification methods previously validated for 18F-FE-PE2I (SRTM, LoganRef, and WAPI) rely on the acquisition of a PET dynamic scan, which is not always feasible in nuclear medicine departments.
The main aim of our study was therefore to define the optimal acquisition time window for 18F-FE-PE2I to be used in a clinical setting with a simplified PET protocol. Our results show that a 25-min PET acquisition, starting 16 min after intravenous injection of the radioligand, can be used to obtain an outcome measure that is in close agreement with regional BPND obtained after 93-min dynamic acquisition followed by pharmacokinetic modeling of the time–activity curves. The quantification performed using a simplified PET protocol, a simulated clinical PET system, and estimation of a simplified outcome measure (SBR) provides a differentiation similar to that of BPND between controls and PD patients, despite an underestimation of actual DAT availability. Thus, this simplified acquisition protocol can be used for semiquantitative analysis of 18F-FE-PE2I PET studies in a clinical setting.
Simplified Quantification
Accuracy of quantification using SBR seems to be related to several factors: spatial resolution of the PET tomograph, density of the DAT in the ROI, and time of peak equilibrium. SBR values calculated from HRRT and simulated HR images are both strongly correlated to BPND values. However, the SBRHR, due to the simulated lower spatial resolution of the HR tomograph, as expected was systematically lower than BPND in all ROIs and in all study subjects.
The correlation between BPND and SBR was found to be stronger in PD patients than in controls, and this can be explained with a better accuracy of quantification in regions with a lower density of the DAT. The strongest correlation between BPND and SBR was indeed found in the putamen of PD patients (r2 = 0.98), the region mostly affected in early stages of disease by the dopaminergic degeneration, and the weakest correlation was found in the putamen of controls (r2 = 0.56), the region with a highest density of DAT in healthy subjects. Although SBR showed a strong correlation with BPND and a similar rank order for the different regions examined, the SBR measure does introduce a proportionality bias. Because of this bias, brain regions with higher DAT availability are affected to a larger extent than regions with lower DAT availability.
Another aspect that influences the accuracy of DAT quantification using the SBR is the time of peak equilibrium in the ROI. The selected time window allows a more accurate quantification if it includes the time of peak equilibrium in the ROI. Recently, Ikoma et al. (22) reported that the SUVR measured with data acquired from 70 to 90 min after injection provided a good agreement with BPND measured with a 2-tissue-compartment model using simulated data and data acquired in healthy subjects. The SUVR measured between 70 and 90 min, however, largely overestimated BPND. This overestimation has been found also in the present study, whereas the SBR measured between 16.5 and 42 min provided the best agreement and the lowest proportional bias as compared with the gold standard BPND. This was shown in both HRRT and HR data suggesting that, if 18F-FE-PE2I is used to measure DAT availability in PD patients and controls, SBR seems to provide an effect size similar to BPND independently of the resolution of the PET system.
Therefore, despite clear limitations of SBR as quantitative outcome measure, the following aspects should be considered to support its possible utility in a clinical setting. The selected time window of 25 min starting 16 min after injection could in principle permit more than 1 PET examination using a single production of 18F-FE-PE2I, with considerable advantages in terms of costs and patient throughput. A 25-min acquisition is a PET protocol most likely well tolerated by most of the patients, considering that the SPECT scans conducted with 123I-ioflupane do not last less than 25 min even using triple-head SPECT systems. Finally, the PET images obtained between 16 and 42 min can be used to qualitatively assess the DAT distribution in the striatum and for visual read, to evaluate the presence of dopaminergic deficit.
It must be reminded, though, that the SBR is lower than BPND. Therefore, in a clinical trial aimed at examining the effect of neuroprotective or neurorestorative treatments on the dopaminergic system, as well as in longitudinal studies aimed at measuring the rate of DAT decline, BPND should be the outcome measure of choice. Future studies are needed to evaluate whether SBR can be a surrogate outcome measure instead of BPND for clinical trials or research purposes.
CONCLUSION
18F-FE-PE2I is a suitable imaging tool for the in vivo quantification of DAT availability and a useful aid for diagnosis of PD. A simplified PET protocol, requiring a 25-min acquisition starting 16 min after injection of the radioligand, can be used in a clinical setting. The SBR, despite being numerically lower than BPND, and having therefore decreased sensitivity to detect nigrostriatal deficit, is a valid simplified quantification method for 18F-FE-PE2I because it provides a differentiation similar to that of BPND between controls and PD patients.
DISCLOSURE
The costs of publication of this article were defrayed in part by the payment of page charges. Therefore, and solely to indicate this fact, this article is hereby marked “advertisement” in accordance with 18 USC section 1734. This study was supported by funds from the Swedish Foundation for Strategic Research (SSF), from the Parkinson Research Foundation in Stockholm, and from the AstraZeneca Translational Science Centre at Karolinska Institutet. No other potential conflict of interest relevant to this article was reported.
Acknowledgments
Results of this work were presented in abstract form at the Congresses of the Society of Nuclear Medicine and Molecular Imaging (SNMMI) and of the European Association of Nuclear Medicine (EANM) in 2015. We thank all members of the Karolinska Institutet PET Centre for the excellent help in the conduction of the PET studies.
Footnotes
Published online May 26, 2016.
- © 2016 by the Society of Nuclear Medicine and Molecular Imaging, Inc.
REFERENCES
- Received for publication December 15, 2015.
- Accepted for publication April 7, 2016.


