


Abstract
Alzheimer disease (AD) is characterized by β-amyloid (Aβ) plaques and tau neurofibrillary tangles. There are several PET imaging biomarkers for Aβ including 11C-PiB and 18F-florbetapir. Recently, PET tracers for tau neurofibrillary tangles have become available and have shown utility in detection and monitoring of neurofibrillary pathology over time. Flortaucipir F 18 is one such tracer. Initial clinical studies indicated greater tau binding in AD and mild cognitive impairment patients than in controls in a pattern consistent with tau pathology observed at autopsy. However, little is known about the reproducibility of such findings. To our knowledge, this study reports the first data regarding test–retest reproducibility of flortaucipir F 18 PET. Methods: Twenty-one subjects who completed the study (5 healthy controls, 6 mild cognitive impairment, and 10 AD) received 370 MBq of flortaucipir F 18 and were imaged for 20 min beginning 80 min after injection and again at 110 min after injection. Follow-up (retest) imaging occurred between 48 h and 4 wk after initial imaging. Images were spatially normalized to Montreal Neurological Institute template space. SUVRs were calculated using AAL (Automated Anatomical Labeling atlas) volumes of interest (VOIs) for parietal, temporal, occipital, anterior, and posterior hippocampal, parahippocampal, and fusiform regions, as well as a posterior neocortical VOI composed of average values from parietal, temporal, and occipital areas. Further, a VOI derived by discriminant analysis that maximally separated diagnostic groups (multiblock barycentric discriminant analysis [MUBADA]) was used. All VOIs were referenced to a subsection of cerebellar gray matter (cere-crus) as well as a parametrically derived white matter–based reference region (parametric estimate of reference signal intensity [PERSI]). t test, correlation analyses, and intraclass correlation coefficient were used to explore test–retest performance. Results: Test–retest analyses demonstrated low variability in flortaucipir F 18 SUVR. The SD of mean percentage change between test and retest using the PERSI reference region was 2.22% for a large posterior neocortical VOI, 1.84% for MUBADA, 1.46% for frontal, 1.98% for temporal, 2.28% for parietal, and 3.27% for occipital VOIs. Further, significant correlations (R2 > 0.85; P < 0.001) were observed for all regions, and intraclass correlation coefficient values (test–retest consistency) were greater than 0.92 for all regions. Conclusion: Significant test–retest reproducibility for flortaucipir F 18 was found across neocortical and mesial temporal lobe structures. These preliminary data suggest that flortaucipir F 18 tau imaging could be used to examine changes in tau burden over time.
Tauopathies are a group of neurodegenerative conditions characterized by the pathologic accumulation of microtubule-associated protein tau aggregates in the brain. Alzheimer disease (AD) is the most common tauopathy, affecting approximately 10.6 million people in the United States and Europe (1). The pathology of AD is characterized by both tau-containing neurofibrillary tangles (2) and amyloid plaques composed largely of aggregated β-amyloid (Aβ) fragments (3,4). Although amyloid pathology is invariably present in AD, it is not consistently associated with the severity of clinical features or disease duration (5). In contrast, tau burden correlates with symptom severity as well as progression (6,7). Similarly, neocortical Aβ plaques and age-related limbic neurofibrillary tangles are common in nondemented individuals, but neocortical neurofibrillary tangles are much less prevalent (8–10).
Molecular imaging of neurodegenerative disorders is a rapidly evolving field. The key role of tau in neurodegeneration has inspired the development of specific therapeutic strategies aimed at either inhibiting tau hyperphosphorylation/aggregation or at direct stabilization of microtubules (11–13). A molecular imaging probe for tau might therefore provide a useful biomarker for both diagnosis and monitoring response to therapy. Several groups have recently reported progress in developing PET tracers for imaging tau deposition. These include a series of 18F-labeled arylquinoline derivatives (14,15) and 11C-labeled phenyl/pyridinyl-butadienyl-benzothiazoles/benzothiazoliums (16). A third group described the 5H-pyrio[4,3-b] indole (formerly 18F-T807, later named 18F-AV-1451, flortaucipir F 18) as a potential PET tracer for detection of tau pathology (17,18). In vitro autoradiography studies showed that flortaucipir F 18 binds with a dissociation constant of 14.6 nM using brain sections from the frontal lobe of AD patients (17). Companion immunohistochemical staining showed colocalization with paired helical filament (PHF)-tau pathology but not with Aβ on adjacent sections, indicating that the flortaucipir F 18 autoradiography signal is most likely due to selective binding to tau pathology.
Initial clinical studies (18–23) indicated that there was both rapid uptake of flortaucipir F 18 into the brain and subsequent clearance from the white matter (in contrast to white matter retention with amyloid imaging agents). They also observed greater tau binding in AD and mild cognitive impairment (MCI) cases than in controls, particularly in the hippocampus and mesial and lateral temporal lobes in a pattern consistent with the distribution of tau pathology observed at autopsy (24,25). However, little is known about the within-subject reproducibility of such findings. To our knowledge, this study reports the first data regarding test–retest reproducibility of flortaucipir F 18.
MATERIALS AND METHODS
Twenty-four subjects, who were recruited from 2 sites (Hoag Neurosciences Institute, Newport Beach, CA, and Molecular NeuroImaging, New Haven, CT), participated in this trial (NCT01992380). Demographic characteristics of the sample are detailed in Table 1. Clinical diagnoses were cognitively normal, MCI, or dementia thought to be due to AD. At the initial imaging session (test), all subjects received approximately 370 MBq of flortaucipir F 18 (range, 330–400.7 MBq [8.92–10.83 mCi]) and were imaged for 20 min (4 × 5 min frames) beginning at approximately 80 min after injection. A second PET image was acquired also for 20 min (4 × 5 min frames) at 110 min after injection. In addition to the 2 PET imaging sessions, a T1-weighted volumetric MRI scan was acquired on a separate day. Each subject underwent a second PET imaging session (retest) after at least 48 h and within 4 wk after the test session. At retest, the same 80- and 110-min PET image acquisitions were collected with the same imaging protocol used on the test day. MR images were not acquired as a part of retest imaging session.
Subject Demographics
Of 24 subjects who had both test and retest imaging sessions, one subject on retest had a 10-min delay in both image acquisitions. In another subject, the 80-min image was not acquired on retest, but a 110-min image was completed. In one other subject, the retest scan session was done outside the 4-wk window. These 3 subjects are therefore not included in the primary efficacy population analyses.
All PET images were acquired using either ECAT HR+ PET (7 subjects) or Biograph 64 slice PET/CT (14 subjects) scanners (Siemens Medical Solutions). Fourteen subjects were scanned on the Siemens Biograph, and 7 were scanned on the Siemens HR+. There were no detectable scanner effects, though the per-scanner sample size was small. PET image data were reconstructed using iterative reconstruction to a 128 × 128 image matrix, pixel size of 2 mm, slice thickness of 2–2.42 mm, and a postsmoothing gaussian filter of 3–5 mm. PET images were next coregistered to subject-specific, T1-weighted MR images. MR images were spatially normalized to Montreal Neurological Institute (MNI) atlas space using the MNI152 T1-weighted MRI template (26) with SPM8, and the same transformation was applied to the coregistered PET data.
Reference Regions
Two reference regions were explored. The first reference region, representing nonspecific uptake of the tracer, was derived from AAL (Automated Anatomical Labeling atlas) volumes of interest (VOIs) for cerebellar gray matter, cere-crus-1, which was modified to avoid potential overlap with nonbrain structures by translating it inferiorly by 6 mm in the z-direction.
However, the distribution of nonspecific uptake patterns for tau imaging can vary across subjects, and areas of increased signal can also occur in the cerebellum, cortex, and white matter. Therefore, we developed a parametrically derived reference region. The parametric estimate of reference signal intensity (PERSI) reference region is a subject-specific, data-driven technique that identifies voxels with nonspecific flortaucipir F 18 uptake within an atlas-defined white matter region, based on the signal intensity histogram (voxel value vs. frequency) of the region (described separately in detail elsewhere (27)). Briefly, the PERSI reference region is derived for each subject by applying an atlas-based white matter mask, plotting the voxel intensity histogram within the white matter mask, and fitting the histogram to a bimodal gaussian distribution. The center and width of the first (lower count intensity) peak were used to determine the reference region voxels for that subject (i.e., voxels with values within the full width at half maximum for the first peak). This normalization strategy reduces contamination from blurring due to partial-volume effects (28,29), stabilizes SUVRs by maximizing the volume of the reference region, and also addresses concerns that positioning of the cerebellum can be problematic in some PET scanners, particularly noticeable in multisite clinical trials.
SUVR
VOIs for the individual hemispheric parcellations from the AAL atlas belonging to fusiform, parietal, temporal, occipital, and frontal areas were used to extract count data from the PET images normalized to MNI space. VOIs for subcortical areas (amygdala, hippocampus, parahippocampus, and fusiform) were also used and were further divided into anterior and posterior subsections to permit measurement of 18F-AV1451 focal uptake in these areas. Further, an average posterior neocortical region was created using the weighted average of parietal, temporal, and occipital VOIs. VOI size (number of voxels) was used to weight the contribution of each VOI to the combined posterior neocortical VOI. SUVRs for the individual and average posterior neocortical VOIs were calculated for both early and late imaging sessions acquired at test and retest. In addition, voxelwise SUVR images were created for each subject at test and retest from 80 and 110 min by dividing counts per voxel in the spatially normalized images by both the PERSI reference region and the posterior cerebellar gray matter reference region counts. SUVRs were then determined as the count ratio between a given VOI and each of the reference regions described above.
Finally, SUVR images modified from the data of Pontecorvo et al. (30) were entered into a multiblock barycentric discriminant analysis (MUBADA) to identify which regions provided maximal diagnostic group differences (31). MUBADA was developed as a statistical method to predict group membership from large datasets that are structured into coherent blocks of variables (e.g., voxels), when the data have far more variables than participants (as is typically the case with neuroimaging data). MUBADA is an extension of mean-centered partial least-squares correlation, often used in neuroimaging research (32,33). MUBADA when applied to 202 total subjects (55 Aβ– old cognitively normal, 43 Aβ– MCI, 54 Aβ+ MCI, 16 Aβ– AD, and 34 Aβ+ AD) yielded 2 dimensions (components), the first of which explained 95% of the variance. This first dimension provided maximal separation of groups by diagnosis and amyloid status (Fig. 1). A VOI representing the spatial distribution of the voxels contributing to dimension 1, which retained the individual voxel contributions (weights), was then derived and used in further test–retest analyses.

The 2 components revealed by MUBADA analyses. Dimension 1 separated groups by diagnosis and amyloid status. VOI describing spatial distribution of voxels contributing to dimension 1 is shown at bottom, color coded to represent their individual contributions (weights). OCN = old cognitively normal.
SUVRs for flortaucipir F 18 may not reach equilibrium by 130 min after injection (34). Further, the degree to which tracer binding changes over the 20-min duration of the acquisition is a function of the amplitude of specific binding (areas with more tau increase more over time; areas with little or no tau are at equilibrium by 80 min). Thus, differences in acquisition time after injection between test and retest studies could lead to artificial increases in apparent signal noise. To address this issue, we determined the slope of the SUVRs for each voxel for each image as derived from the four 5-min image acquisitions and adjusted the average SUVR for that acquisition to effectively represent 90 min at the midpoint for 80- to 100 -min acquisitions and to 120 min for 110- to 130-min acquisitions (35). Timing-corrected data are used throughout these analyses.
Statistical Analysis
Reproducibility of test–retest data at the 80- and 110-min imaging sessions was evaluated using t tests, correlation analyses, coefficients of variation, and intraclass correlation coefficients. The Kruskal–Wallis test was used to compare subjects’ demographics and baseline characteristics by clinical diagnostic group. Mean SUVR change (retest–test) across subjects and SD of that change were calculated for each VOI at 80 and 110 min. Mean percentage change (% change = 100 × (retest – test)/[(retest + test)/2]) and SD of that change across subjects were also calculated for each VOI at both 80- and 110-min images.
RESULTS
Control subjects were moderately but significantly younger than AD and MCI subjects, which did not differ by age. Groups did not differ by sex or education, but as expected Mini-Mental State Examination values were significantly lower in AD than in other groups (Table 1).
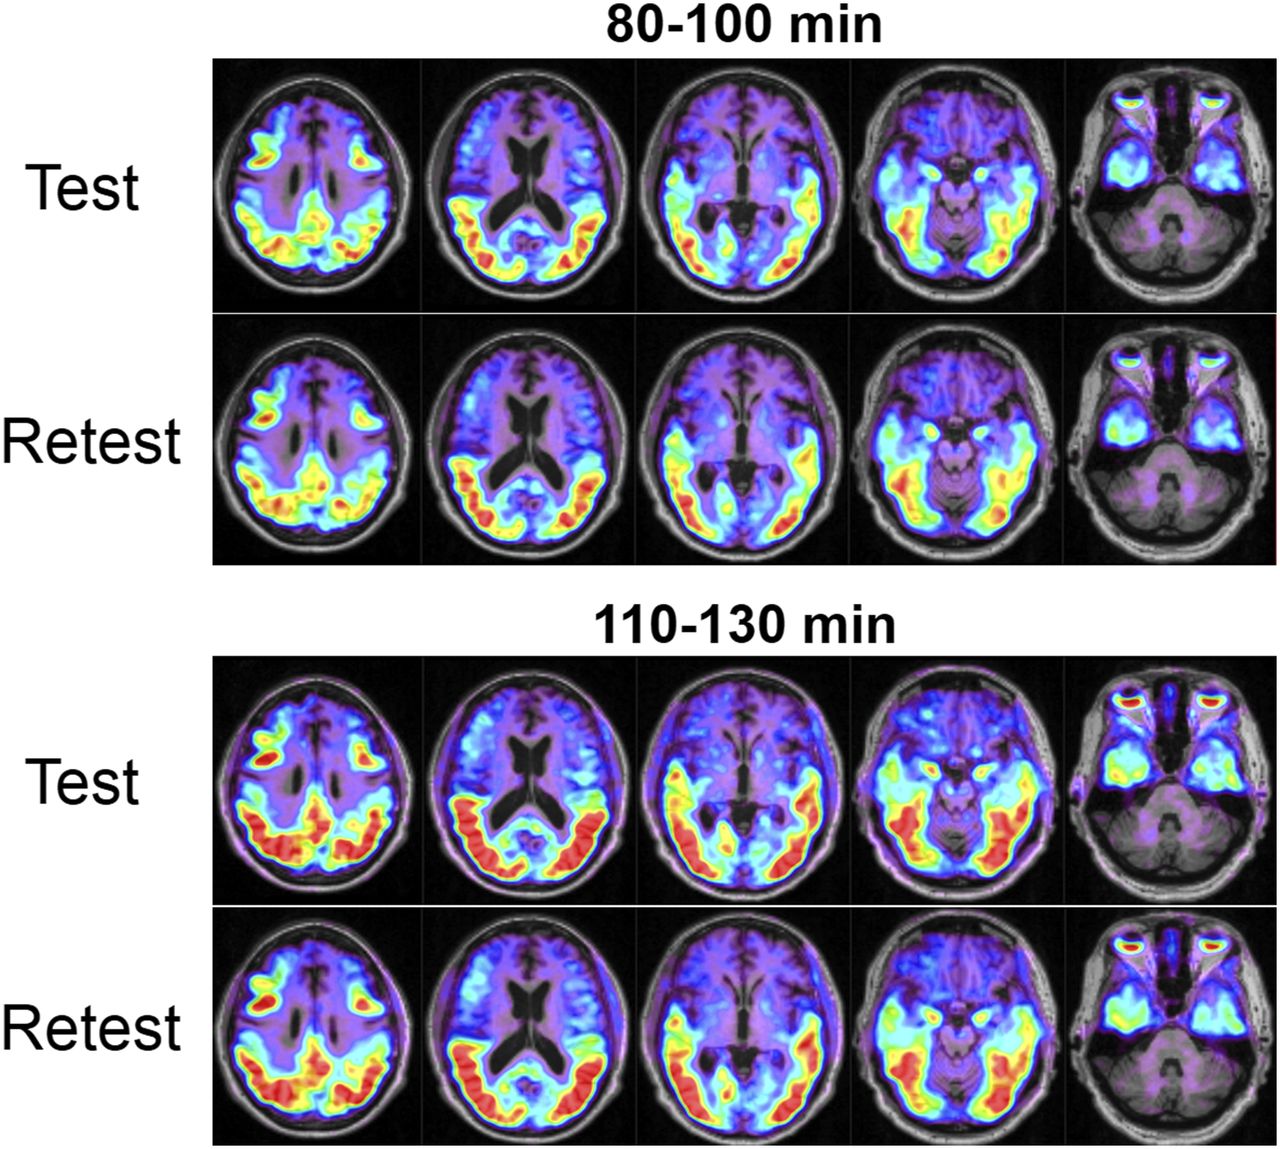
Typical timing-corrected test–retest SUVR images (relative to the PERSI reference region) overlaid on the corresponding MR image (80-min scan) from subjects with and without cortical flortaucipir F 18 uptake are shown in Figure 2. Figure 3 illustrates a single subject with test–retest SUVR images as a function of time after injection. In general, little difference between test and retest conditions were noted across subjects. Although time after injection affected the overall intensity of uptake, it did not alter the regional pattern or the similarity of AV1451 uptake at test and retest in these subjects.

Test–retest SUVR images 80 min after injection of flortaucipir F 18 from 2 subjects with cortical flortaucipir F 18 uptake (A) and 2 subjects without cortical uptake (B). Color scale represents SUVRs and is set to range between 1 and 2.5 for all subjects. SUVR images are overlaid on each subject’s T1-weighted MR image.

SUVR images overlaid on subject’s MR image from a single subject with test–retest images as function of time after injection.
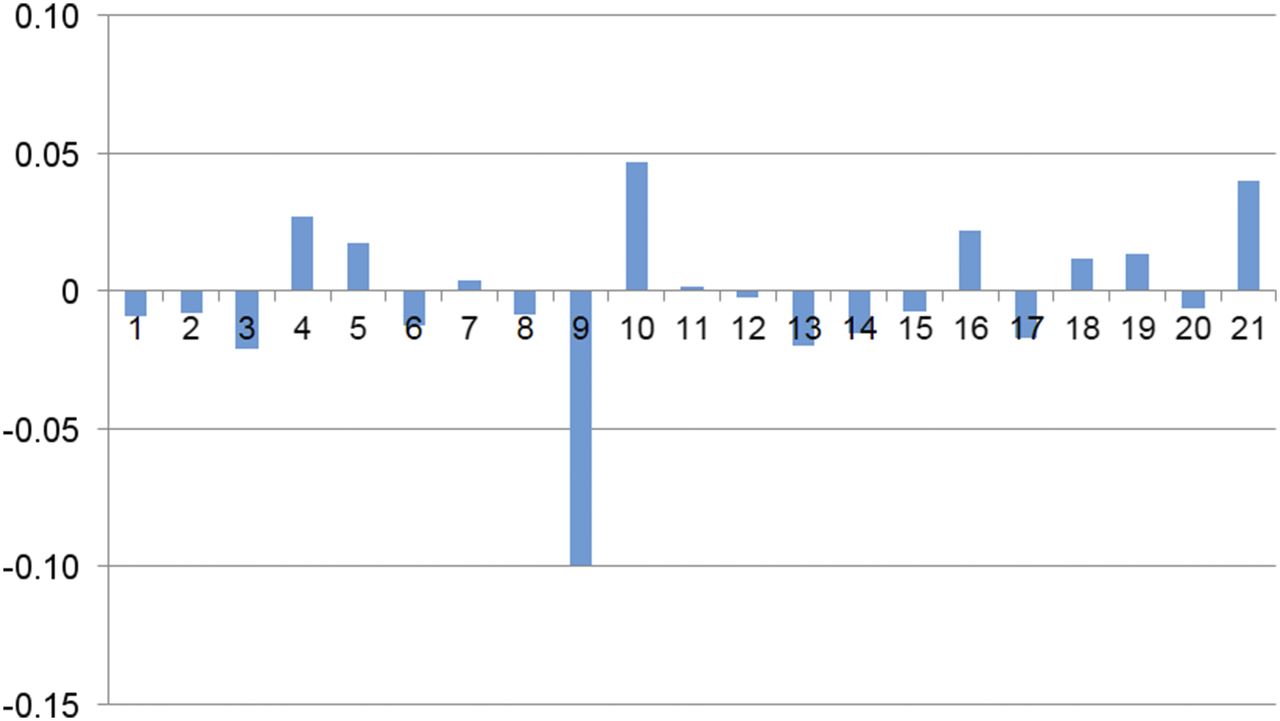
SUVR change (again relative to the PERSI reference region) across subjects for the combination posterior neocortical region is shown in Figure 4. Changes were generally less than 0.06 SUVR units, though a single subject (subject 9) was an outlier for both the 80- to 100-min and the 110- to 130-min scans. Regional SUVR (and SD) values at test, retest, and change (positive indicating greater SUVR on retest) are shown in Table 2.

SUVR change across subjects for combination posterior neocortical region. Single outlier was observed (shown here using 80- to 100-min scan data; 110- to 130-min scan data showed same outlier).
80- to 100-Minute Test–Retest SUVR Comparisons
Reproducibility for cortical regions (measured by the SD of the % change; PERSI reference region) ranged from 1.5% to 5.0% for the 80- to 100-min scans (Table 2) and from 2.3% to 4.5% for the 110- to 130-min scans (Table 3). Test–retest SUVR data also showed significant correlations (R2 > 0.85; P < 0.001) for all regions examined (Fig. 5). Similarly, intraclass correlation coefficient values (test – retest consistency) were greater than 0.92 for all regions.
110- to 130-Minute Test–Retest SUVR Comparisons
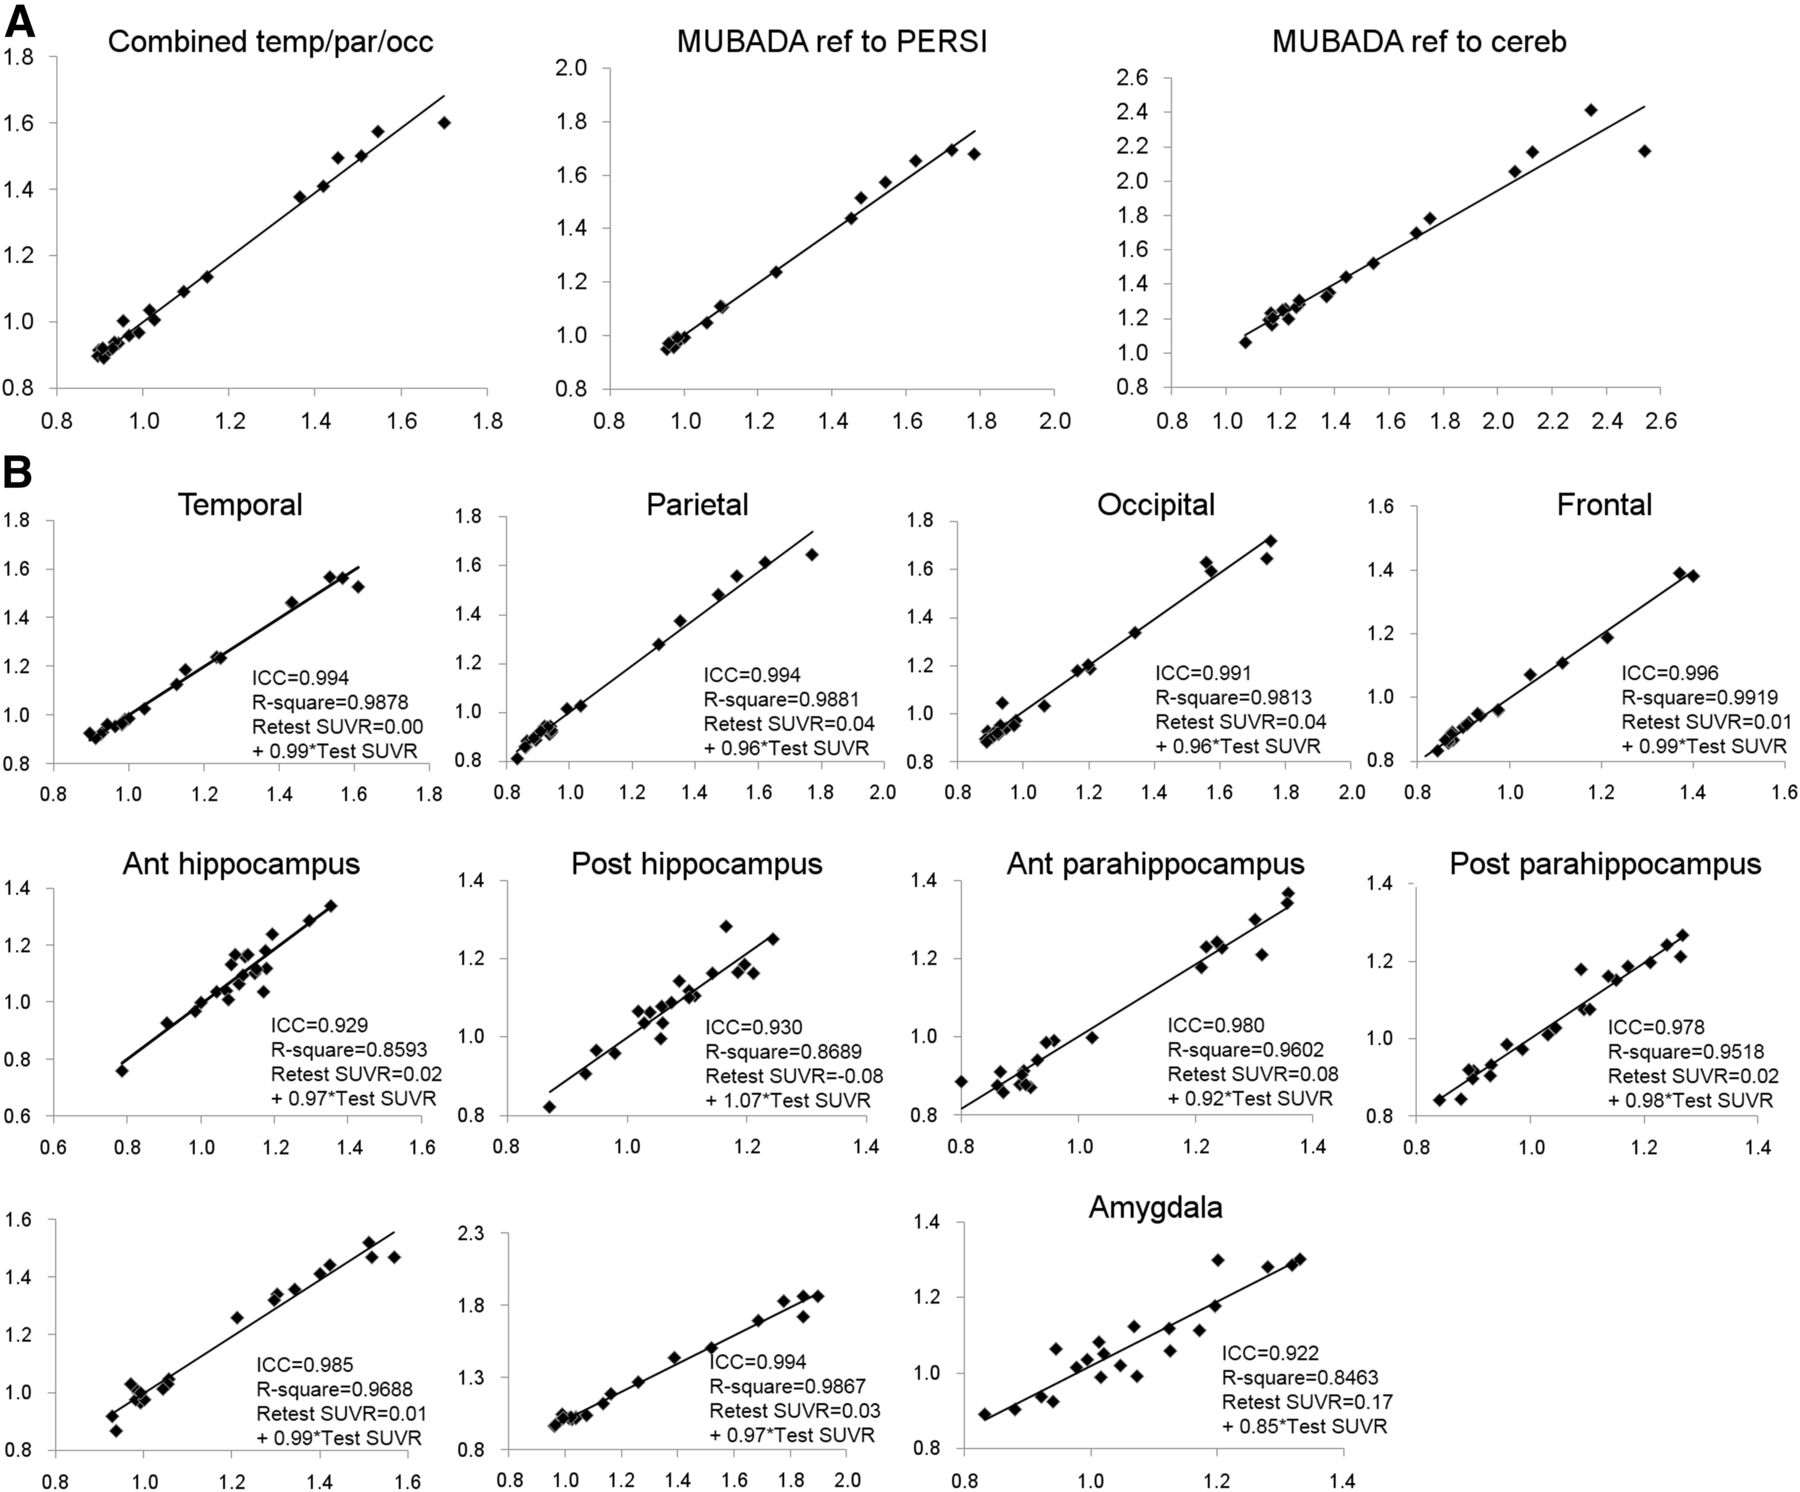
Scatterplots comparing test and retest SUVRs by VOI. (A) Results for posterior neocortical VOI and for MUBADA using either PERSI or cerebellum as reference region. (B) AAL regions. Regression equations, quality of fit (R2), and intraclass correlation coefficients are listed for each VOI.
DISCUSSION
Flortaucipir F 18 is among the first of a new generation of PET radiopharmaceuticals designed to image tau neuropathology (19–23,30,36,37). Because AD is characterized by both Aβ plaques and tau neurofibrillary tangles, it may be useful to assess the presence and extent of both pathologic biomarkers in vivo. There are several approved 18F amyloid imaging agents that have been well characterized (38). However, the field of tau imaging is in its nascency. Further, unlike amyloid pathology, tau burden correlates with symptom severity as well as progression in demented patients, increasing the relevance of antemortem assessment of tau pathology. As was the case for amyloid imaging, it will be important to characterize the reliability of tau imaging agents. This is the first report on test–retest performance of any tau imaging agent.
The test–retest behavior of flortaucipir F 18 was examined in 21 subjects ranging from healthy controls to patients with AD. Reproducibility was high across neocortical and mesial temporal lobe structures. There was somewhat greater variability in small mesial temporal structures (anterior hippocampus and amygdala) that are most susceptible to partial-volume effects subsequent to atrophy in AD. Assessment of reproducibility across a range of clinical presentations was a key component of the study design. Further, the PERSI reference region provided improved performance relative to cerebellar gray matter. In general, variability in the data (SD of % change) was substantially reduced and the mean % change was lowered by more than a factor of 2 (Table 4).
80- to 100-Minute Test–Retest SUVR Comparisons by Reference Region
There is limited literature (5 patients with THK5317) on reproducibility in tau imaging tracers (39). There is, however, a modest literature on this topic for amyloid imaging tracers (38). Test–retest variability of 11C-PIB SUVR in AD is 8.0% ± 7%, but can be improved to 3% using dynamic scans with reference tissue methods (40). The test–retest variability of 18F-flutemetemol is 1.5% ± 0.7% (41), of 18F-florbetapir 2.4% ± 1.4% (42), of 18F-florbetaben 6.2% (range, 0.6%–12.2%) (43), and of 18F-AZD4694 7.5% ± 6.5% (44). The reproducibility of flortaucipir F 18 (2.2% for the combined posterior neocortical VOI) is similar to that reported for PET amyloid imaging agents.
The intraclass correlations were also high (>0.93 for all regions). Amyloid imaging agents show similar results. 11C-Pittsburgh compound B demonstrates an intraclass correlation of 0.96 (40). 18F-flutemetamol has been reported to have an intraclass correlation of 0.96 (41), and 18F-florbetapir has an intraclass correlation of 0.99 (42).
There was a single outlier in the test–retest data, for which the retest scan was substantially lower than the test scan across all brain regions and with both reference regions. No technical reason for this reduction was identified, though a technical source seems the most likely cause. The short interval between test and retest argues against a biologic reduction in tau burden.
These data suggest that reliability is somewhat better for acquisitions beginning at 80 than 110 min after injection (Table 4). For example, the SD of % change for the combination region is 2.2 at 80 min versus 2.9 at 110 min. Similarly, for the frontal VOI SD of % change is 1.5 versus 2.3; temporal, 2.0 versus 2.3; parietal, 2.3 versus 3.3; and occipital, 3.3 versus 4.3. There is also greater mean % change at 110 min: combination region at 80 min was −0.10% versus −0.42% at 110 min; temporal, −0.28% vs −0.75%, though this was not universally true (e.g., frontal, −0.13% at 80 min vs. 0.07% at 110 min). Although SUVR continues to increase with time after injection in areas with a positive tau signal, the advantage of higher SUVR at 110 min is outweighed by the increased variance. Thus, acquisitions beginning 80 min after injection of flortaucipir F 18 have been chosen as the standard method for prospective studies.
CONCLUSION
Flortaucipir F 18 is a reliable PET tracer for imaging tau neuropathology. It will be important to gather data on longitudinal studies of subjects both with and without cortical tau neurofibrillary tangles to understand the capacity of this tracer to assess either pathologic increases in tau or responses to therapeutic interventions. However, these preliminary data suggest that the reliability of flortaucipir F 18 imaging will allow this agent to be used to examine changes in tau burden over time.
DISCLOSURE
Michael D. Devous. Sr., Abhinay D. Joshi, Michael Navitsky, Sudeepti Southekal, Michael J. Pontecorvo, and Mark A. Mintun are employees of Avid Radiopharmaceuticals a wholly owned subsidiary of Eli Lilly and Co. Avid Radiopharmaceuticals sponsored this study. William R. Shankle is an employee of Shankle Clinic and Cognitive Disorders Program, Hoag Neurosciences Institute, and UC Irvine Cognitive Science Department. No other potential conflict of interest relevant to this article was reported.
Acknowledgments
All procedures performed in studies involving human participants were in accordance with the ethical standards of the institutional or national research committee and with the 1964 Helsinki declaration and its later amendments or comparable ethical standards. The invaluable assistance of Andrew Siderowf, Nathanial Lim, and Matthew Flitter in data collection and trial design is gratefully acknowledged and much appreciated.
Footnotes
Published online Dec. 28, 2017.
- © 2018 by the Society of Nuclear Medicine and Molecular Imaging.
REFERENCES
- Received for publication August 14, 2017.
- Accepted for publication November 8, 2017.


Jump to section
Related Articles
Cited By...
- Development and Validation of a 18F-Flortaucipir PET Visual Stratification Method
- Improved Correlation of 18F-Flortaucipir PET SUVRs and Clinical Stages in the Alzheimer Disease Continuum with the MUBADA/PERSI-Based Analysis
- The Overlap Index as a Means of Evaluating Early Tau PET Signal Reliability
- Genistein effect on cognition in early Alzheimers disease patients. The GENIAL clinical trial
- Direct Comparison of the Tau PET Tracers 18F-Flortaucipir and 18F-MK-6240 in Human Subjects
- Cerebrospinal fluid p-tau217 performs better than p-tau181 as a biomarker of Alzheimers disease
- Progressive Tau Accumulation in Alzheimer Disease: 2-Year Follow-up Study