


Abstract
We present an approach for head MR-based attenuation correction (AC) based on the Statistical Parametric Mapping 8 (SPM8) software, which combines segmentation- and atlas-based features to provide a robust technique to generate attenuation maps (μ maps) from MR data in integrated PET/MR scanners. Methods: Coregistered anatomic MR and CT images of 15 glioblastoma subjects were used to generate the templates. The MR images from these subjects were first segmented into 6 tissue classes (gray matter, white matter, cerebrospinal fluid, bone, soft tissue, and air), which were then nonrigidly coregistered using a diffeomorphic approach. A similar procedure was used to coregister the anatomic MR data for a new subject to the template. Finally, the CT-like images obtained by applying the inverse transformations were converted to linear attenuation coefficients to be used for AC of PET data. The method was validated on 16 new subjects with brain tumors (n = 12) or mild cognitive impairment (n = 4) who underwent CT and PET/MR scans. The μ maps and corresponding reconstructed PET images were compared with those obtained using the gold standard CT-based approach and the Dixon-based method available on the Biograph mMR scanner. Relative change (RC) images were generated in each case, and voxel- and region-of-interest–based analyses were performed. Results: The leave-one-out cross-validation analysis of the data from the 15 atlas-generation subjects showed small errors in brain linear attenuation coefficients (RC, 1.38% ± 4.52%) compared with the gold standard. Similar results (RC, 1.86% ± 4.06%) were obtained from the analysis of the atlas-validation datasets. The voxel- and region-of-interest–based analysis of the corresponding reconstructed PET images revealed quantification errors of 3.87% ± 5.0% and 2.74% ± 2.28%, respectively. The Dixon-based method performed substantially worse (the mean RC values were 13.0% ± 10.25% and 9.38% ± 4.97%, respectively). Areas closer to the skull showed the largest improvement. Conclusion: We have presented an SPM8-based approach for deriving the head μ map from MR data to be used for PET AC in integrated PET/MR scanners. Its implementation is straightforward and requires only the morphologic data acquired with a single MR sequence. The method is accurate and robust, combining the strengths of both segmentation- and atlas-based approaches while minimizing their drawbacks.
Attenuation correction (AC) is one of the biggest challenges in achieving accurate PET quantification in combined PET/MR imaging (1,2). The goal of MR-based AC techniques is to address the challenge of converting the MR signal, related to the proton density and MR relaxation times of tissues, into linear attenuation coefficients (LACs), related to electron density, at PET energy levels (3).
The MR AC strategies can be broadly grouped into 3 classes: atlas-based approaches, segmentation-based approaches, and techniques aimed at simultaneously estimating the emission and attenuation data. In atlas-based methods, several pairs of coregistered MR and attenuation maps (μ maps) are combined to form a template set (4–8). Any new subject’s MR image is first coregistered to the MR template. The matched μ map from the atlas is then warped back into the subject’s space using the inverse transformation. These methods require matched MR and transmission maps (or CT images), which are not always available, and accurate inter- and intrasubject coregistration between the training datasets. Local anatomic mismatches from the template, due to either natural or disease-related anatomic variants (e.g., tissue remodeling or surgical procedures), tend to introduce biased estimations, which are difficult to address (2). Segmentation-based approaches involve segmentation of morphologic MR images into tissue classes to which approximate LACs are subsequently assigned (9–13). Local anatomic variations are usually better addressed on segmentation-based approaches; however, errors are introduced because of, among other factors, the inability of these methods to classify all the different tissue classes and the use of a handful of averaged LACs that may not represent accurately the subject-specific tissue properties (2,13). Finally, the simultaneous emission and μ-map estimation is based on iterative methods following maximum a posteriori schemes with different correction terms (penalties) (14–17). Such approaches usually require time-of-flight information and determine the attenuation sinogram up to a constant offset (2,16,18). Because the estimation of the LACs from the emission data is a “very ill-posed problem” (16), the iterative solution is highly dependent on both the initialization and the penalty terms introduced and could potentially lead to bias and inaccurate estimation (16,18). Furthermore, in the case of tracers with very specific uptake, the PET emission data may not provide complete information to estimate accurate LACs in all the voxels (16). New transmission-based techniques have recently been redesigned to allow simultaneous emission and transmission acquisition (19). However, they involve additional radiation exposure and require time-of-flight detector capabilities to simultaneously detect the events from the subject and the transmission source.
We present an approach for MR AC based on the widely available Statistical Parametric Mapping 8 software (SPM8; Wellcome Trust Centre for Neuroimaging, University College London) that allows accurate AC for brain PET studies. Our approach combines the strengths of the segmentation- and atlas-based approaches (e.g., use of accurate segmentation of tissue classes to enable precise nonrigid coregistration to form a template), which in principle could help minimize some of their specific drawbacks. The technique has been successfully tested on datasets acquired at 2 different institutions using integrated PET/MR scanners (Biograph mMR; Siemens Healthcare). The performance of the method was compared with both that of the AC method provided by the manufacturer (the Dixon-based segmented method (10)) and that of the gold standard for PET/CT imaging (CT-based AC).
MATERIALS AND METHODS
Image Acquisition
Atlas Generation Data
CT and MR images of 15 subjects diagnosed with glioblastoma were retrospectively analyzed to create the template. The MR images were acquired on a 3-T MAGNETOM Trio (Siemens Healthcare). T1-weighted 3-dimensional magnetization-prepared rapid gradient echo (MPRAGE) MR images were acquired after administration of an MR contrast agent (Magnevist [gadopentetate dimeglumine]; Bayer HealthCare) (details are provided in the supplemental materials, available at http://jnm.snmjournals.org).
All subjects underwent CT examinations within 1 mo of their MR imaging scans (LightSpeed QX/I; GE Healthcare). No surgical interventions were performed in the interval between the CT and MR imaging sessions. All subjects gave written informed consent, and the local Institutional Review Board approved the study.
Atlas Validation Data
Sixteen CT and PET/MR datasets from subjects diagnosed with different grades of brain tumor (n = 12) or mild cognitive impairment (n = 4) were retrospectively included in the study and became the validation dataset. These data were collected at Copenhagen University Hospital, Denmark (n = 7), and Technische Universität München, Germany (n = 9). The PET and MR images were acquired simultaneously using the Biograph mMR scanner (20). All subjects gave written informed consent, and the local Institutional Review Boards approved the study.
The emission data were acquired 74.5 ± 19.9 min (mean ± SD) after administration of 199.5 ± 25.4 MBq of 18F-FDG (n = 9) or 18F-O-(2-18F-fluoroethyl)-l-tyrosine (FET) (n = 7). Data were acquired in 3-dimensional mode for 15 min (16.8 ± 2.19 min) and were reconstructed using the 3-dimensional ordered-subsets expectation maximization algorithm with 3 iterations and 21 subsets, with corrections for random coincidences, variable detector sensitivity, dead time, isotope decay, scatter, and photon attenuation. Images were reconstructed into a 344 × 344 × 127 matrix with voxel sizes of 2.09 × 2.09 × 2.03 mm (n = 9) and 0.835 × 0.835 × 2.03 mm (n = 7).
MR data were acquired simultaneously with the PET data using MPRAGE and dual-echo Dixon volume-interpolated breath-hold examination (VIBE) sequences. Low-dose CT images were acquired at both sites without contrast material for all subjects on the day of the PET/MR sessions using a Biograph 64 scanner (Siemens) (the supplemental material provides data acquisition details).
MR and CT Image Preprocessing
All MR images were intensity-normalized following a previously described method (21) using FreeSurfer, version 5.2 (http://surfer.nmr.mgh.harvard.edu), to allow better image segmentation and therefore a better template formation.
CT images were then coregistered to the MR images using the SPM8 affine automatic coregistration. Finally, CT images were resliced into the MR (MPRAGE) space to allow for comparisons of the μ-map generation and AC methods.
Atlas Generation
The template was formed by nonrigid coregistration of all 15 subjects from the atlas generation dataset. SPM8 was used to perform the 3 steps involved in the template formation: MR image segmentation into tissue classes, nonrigid coregistration of these tissue classes, and warping of the CT images into the same (atlas) space (these steps are described in more detail in the supplemental materials). The final CT template was created by averaging all the warped CT images.
Atlas Validation
To validate the atlas generation methodology, we used the leave-one-out cross-validation approach with the 15 datasets used for constructing the template.
The final template (generated from all 15 datasets) was further validated using the 16 validation subjects. To obtain an atlas-based CT image for a new subject, the tissue classes derived from the intensity-normalized MR image were warped into the template space and then the final CT template was inversely warped into the subject space. This was achieved by following the same 3 steps used in the atlas generation procedure: MR image segmentation (SPM8 New Segment), nonrigid coregistration of the tissue classes to the previously created template (SPM8 DARTEL [Diffeomorphic Anatomical Registration Through Exponentiated Lie Algebra] Existing Template), and finally inverse warping of the final CT template image into the subject space (SPM8 Create Inverse Warped). This final image becomes the image used for the atlas-based AC method.
AC
To compare our AC method with the CT AC, the Hounsfield units of the atlas-based and resliced CT images generated from the validation subjects were converted to LACs using the bilinear transformation (22) to generate the corresponding μ maps: μatlas and μCT, respectively. Gaussian smoothing with a 4-mm kernel was applied to these μ maps to match the PET spatial resolution. Additionally, the μ maps generated using the method currently available on the Biograph mMR scanner (μDixon) (10) were also available for comparison. Briefly, in the case of head imaging, the images acquired with the Dixon VIBE sequence are segmented into 3 tissue classes: air, fat, and soft tissue. LACs of 0, 0.0854, and 0.1000 cm−1, respectively, are then assigned to these tissue classes. Bone tissue is not segmented using this method. AC factors in sinogram space were generated from all these μ maps and used to correct the PET data for the validation subjects. The resulting PET volumes were named PETatlas, PETCT, and PETDixon, corresponding to the atlas-, CT- and Dixon-based AC methods, respectively.
Image Analysis
Voxel- and region-based analyses were performed to assess the accuracy of the μ maps and reconstructed PET images. Only voxels included in the head mask created by performing binary and morphologic operations (supplemental materials) on each subject’s intensity-normalized MR image head mask were used for comparisons. Bland–Altman plots, bias, and variability Pearson correlation coefficients were calculated for all comparisons. Absolute RCs were defined as follows:
where X is the AC method (Dixon or atlas); IX corresponds to either the PET images (PETDixon or PETatlas) or the μ maps (μDixon or μatlas); and Igs corresponds to the gold standard image (PETCT or μCT for PET and μ-map comparisons, respectively). Nonabsolute RCs were calculated similarly but without taking the absolute value of the difference.
For the region-based analysis, 10 gray matter regions of interest (ROIs) obtained from the Automatic Anatomic Labeling template (i.e., frontal, insula, cingulate, limbic, occipital, parietal, basal ganglia, thalamus, temporal, and cerebellum), 1 white matter ROI, and 1 cerebrospinal fluid ROI were selected to cover most of the brain (>90%). Because the frontal region is more prone to errors because of its proximity to the sinuses, where bone and air segmentation is difficult, the frontal ROI was further segmented into 28 Automatic Anatomic Labeling subregions for detailed analysis. A brain mask obtained from the subject-specific gray matter, white matter, and cerebrospinal fluid tissue probability maps was derived to calculate the voxel-based absolute differences. A brain cortex mask was additionally created for the validation dataset from the 5 outermost voxels of the brain mask (e.g., those adjacent to bone tissue) to assess the accuracy of the method in this challenging area.
Mean and maximum tumor-to-brain ratios (T/B) were calculated for all the 18F-FET patients (n = 7) following a previously published method (23) (supplemental materials).
Statistical Analysis
The different methods were compared using paired Student t tests. A P value of less than 0.05 was considered to indicate statistical significance. Mean and SD percentage values for absolute RCs and nonabsolute RCs were computed across subjects. For ROI analysis, minimum and maximum percentage values for the average RCs across subjects were also calculated.
RESULTS
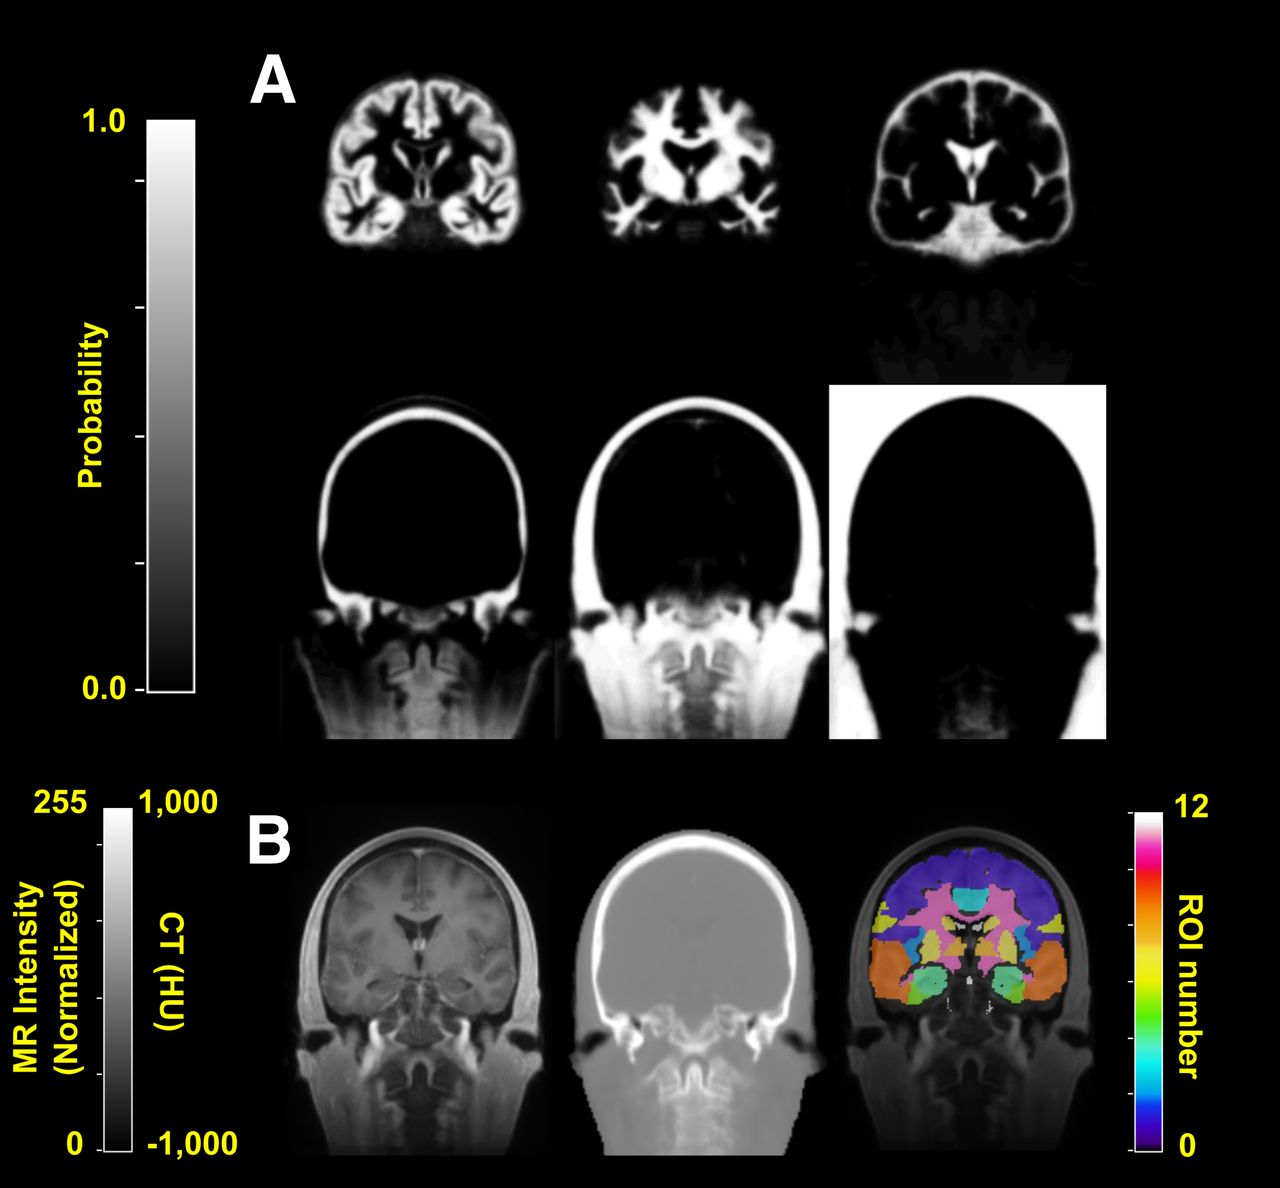
The tissue classes and template images generated using the iterative diffeomorphic image registration approach and the Automatic Anatomic Labeling ROIs used in this study are shown in Figure 1.

Template images generated for atlas method. (A) Tissue classes at final iteration of diffeomorphic nonrigid coregistration method (DARTEL). From left to right are gray matter, white matter, and cerebrospinal fluid (top row) and bone, soft tissue, and air (bottom row). (B) Template MR (left) and CT (middle) images and Automatic Anatomic Labeling regions (right) used for ROI analysis overlaid on MR template image.
The leave-one-out cross-validation analysis of the 15 subjects included in the atlas generation dataset showed that the mean RC was 1.38% ± 4.52% for all brain voxels and 0.75% ± 1.6% for all ROIs (range, 0.16%–1.78%).
Figure 2 shows μ maps obtained with the 3 methods for one of the validation subjects, demonstrating excellent correspondence between μatlas and μCT and the obvious misclassification of bone tissues in the μDixon. The difference maps between the MR-based (μatlas and μDixon) and CT-based μ maps are shown in Supplemental Figure 1. More detailed results of the ROI-based analysis are provided in Supplemental Figure 2.
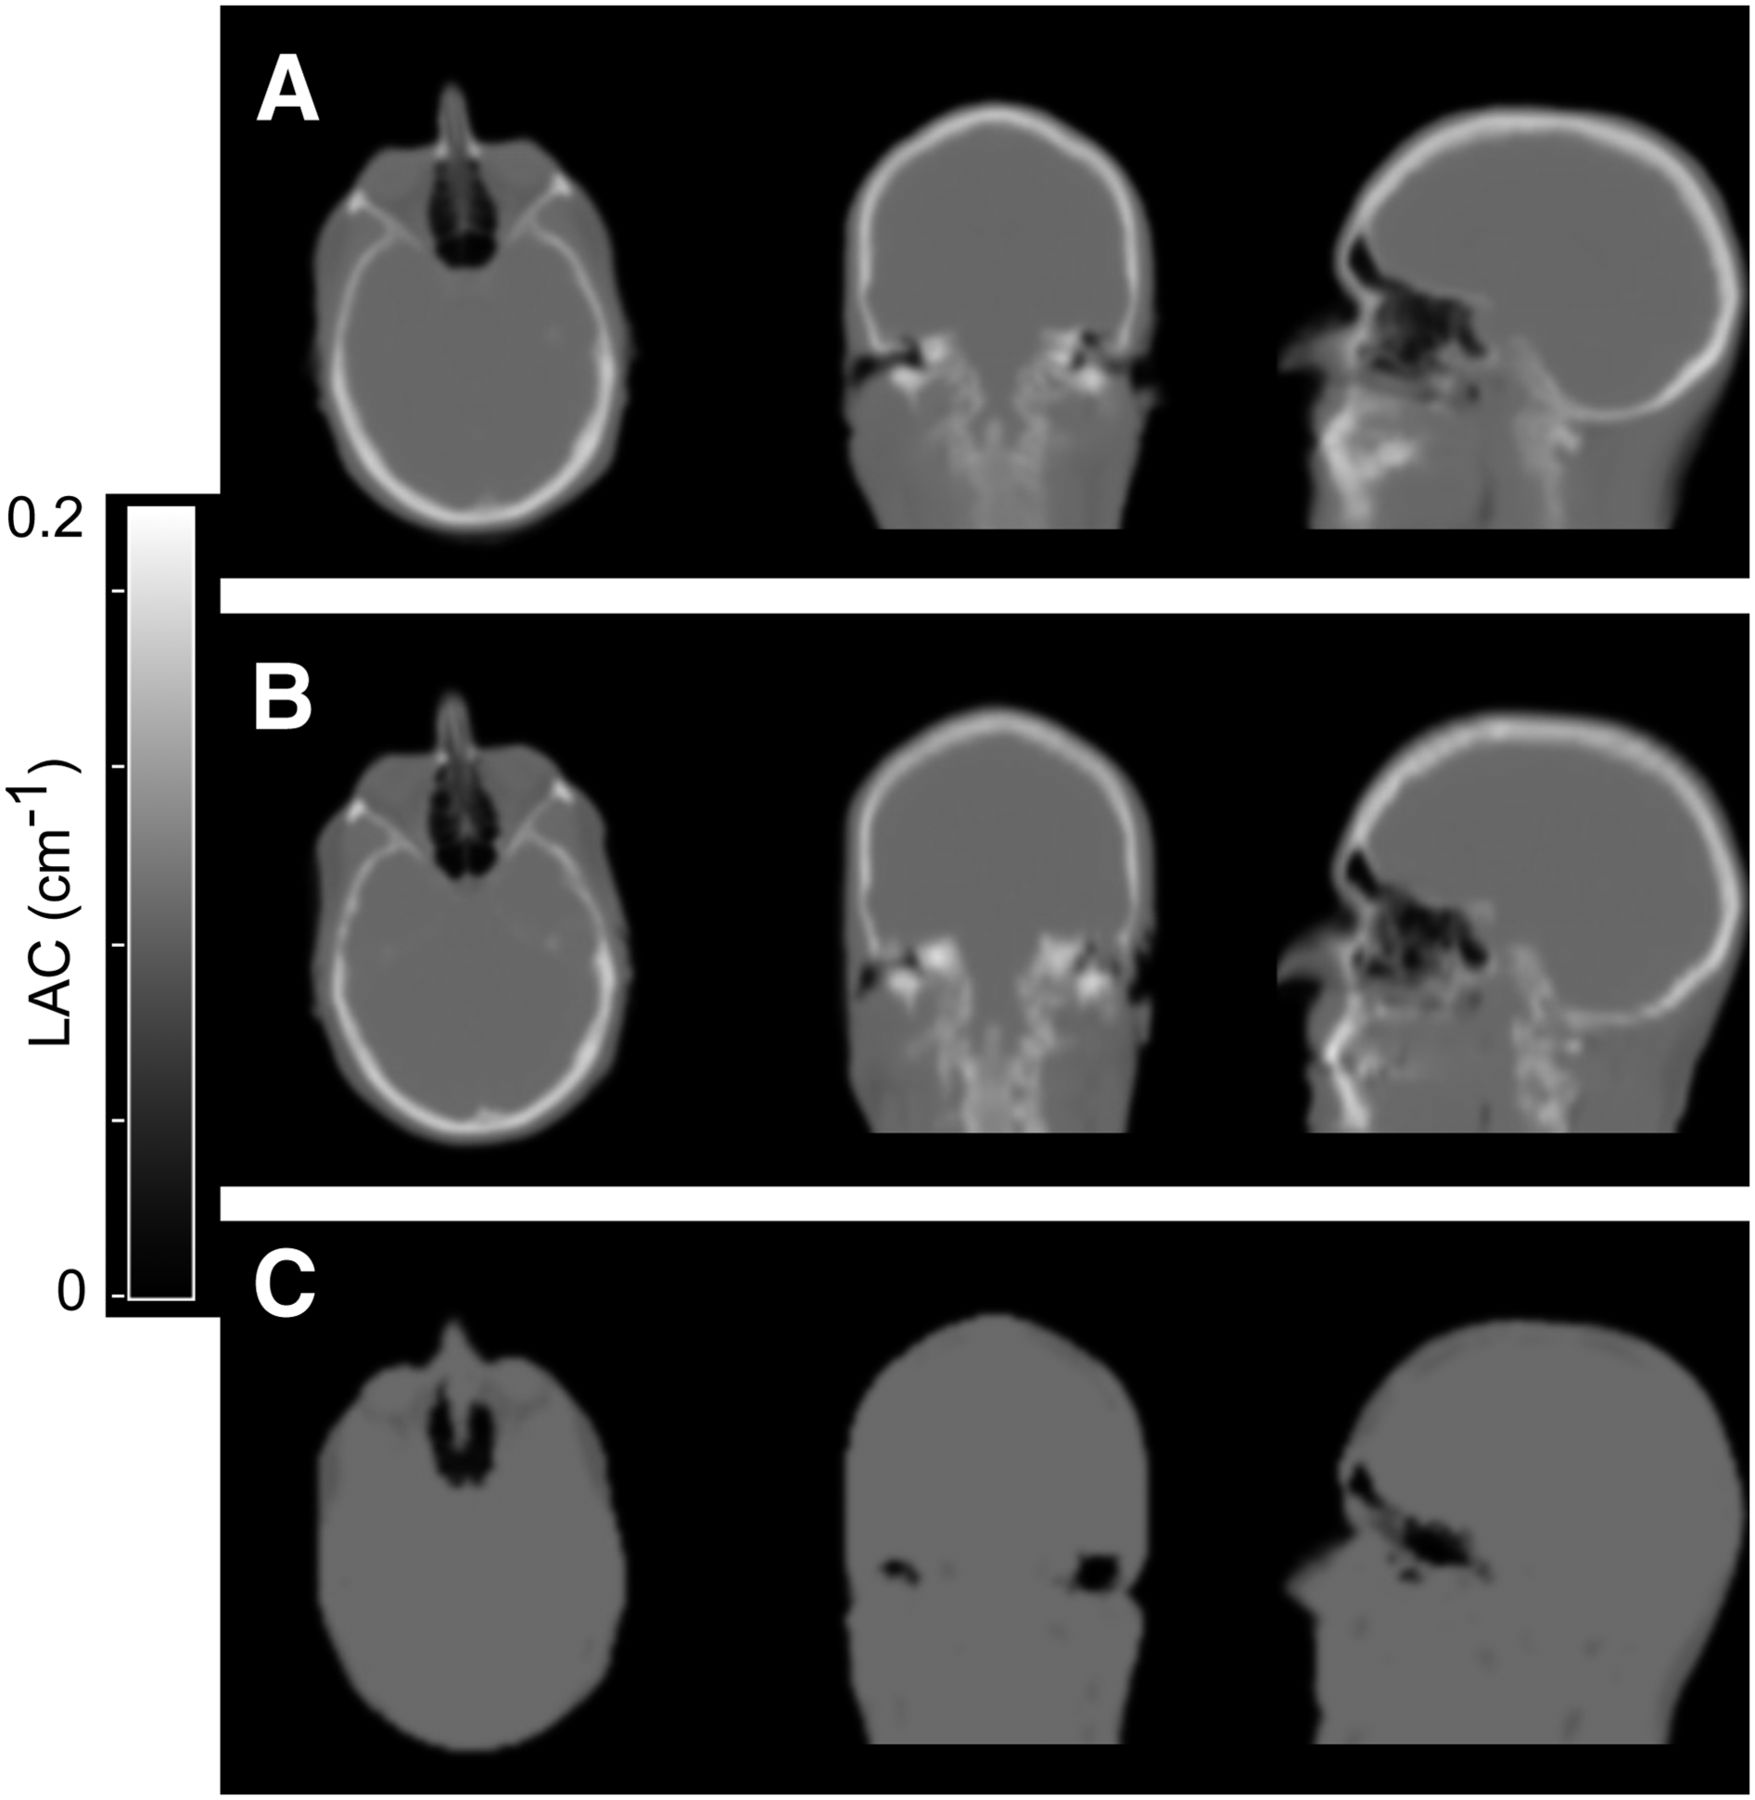
Comparison of attenuation maps for representative atlas-validation subject. μatlas (A), μCT (B), and μDixon (C) are displayed in 3 orientations.
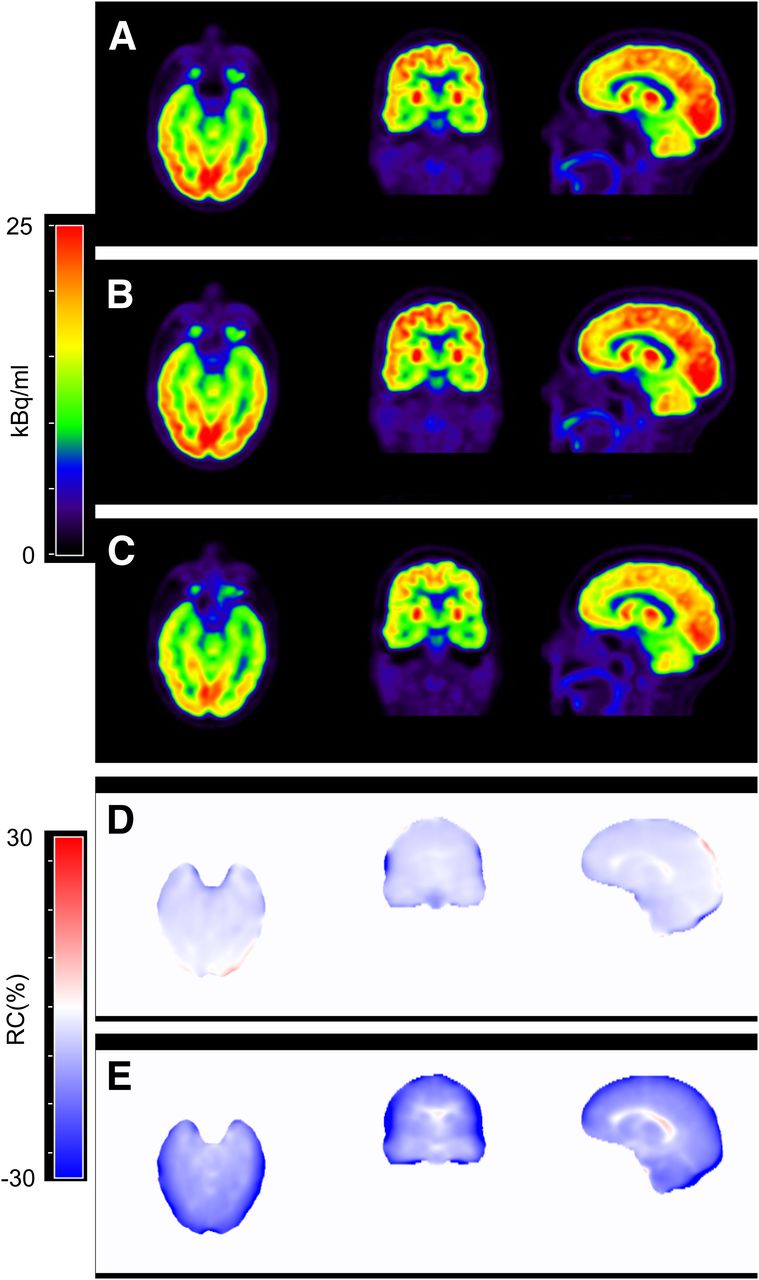
A comparison of the reconstructed PET images corrected with the 3 AC methods for one of the validation subjects is shown in Figure 3. As expected, the largest errors in the brain occurred in cortical areas, near the skull. The results of the quantitative ROI- and voxel-based analyses are summarized in Table 1. Comparable results, in terms of tendency, were observed when either absolute or nonabsolute RCs were calculated (Table 1), with nonabsolute RCs showing much reduced biases in all cases. The errors in the 5 outermost voxels of the brain mask were 9.41% ± 8.58% for PETatlas and 28.15% ± 13.36% for PETDixon, similar to the underestimations previously reported in this area using the Dixon-based approach (24).

(A–C) Comparison of PET images reconstructed with the 3 AC methods for 1 validation subject: PETatlas (A), PETCT (B), and PETDixon (C). (D and E) Corresponding RC images (masked to highlight only brain area) for PET data reconstructed with atlas AC (D) and Dixon AC (E) with respect to CT AC method.
Summary of ROI- and Voxel-Based Analysis Changes for Whole-Brain Area
Figures 4A and 4B show the Bland–Altman plots for the voxel-based analyses for all validation subjects, comparing PETDixon (Fig. 4A) and PETatlas (Fig. 4B) with PETCT.
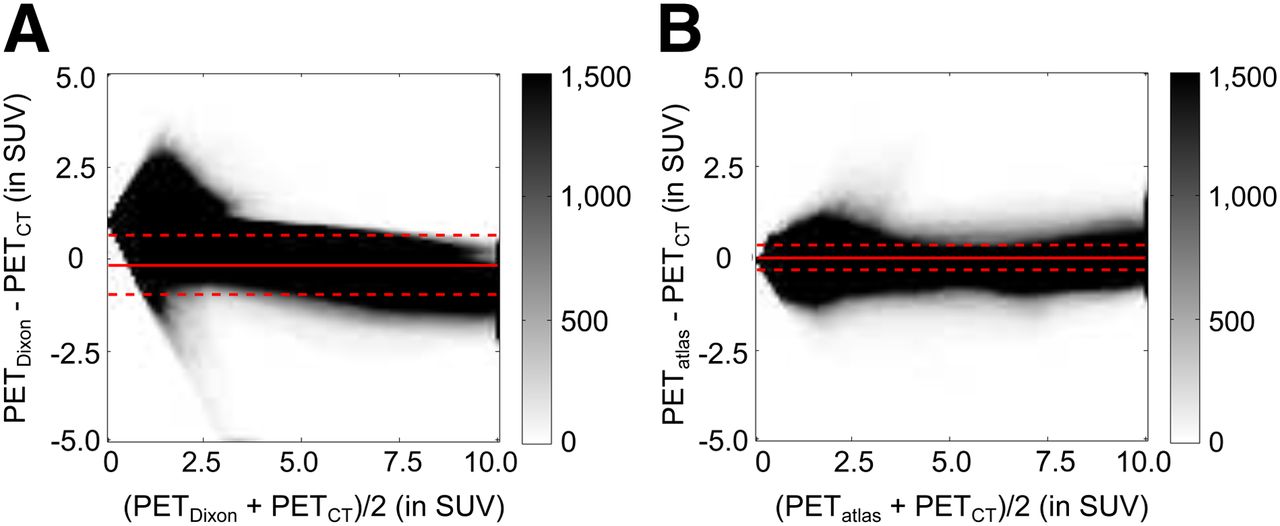
Bland–Altman plots showing voxel-based comparisons (for all validation subjects) between PETDixon and PETCT (A) and between PETatlas and PETCT (B). Color bar shows density of voxels on histogram grid.
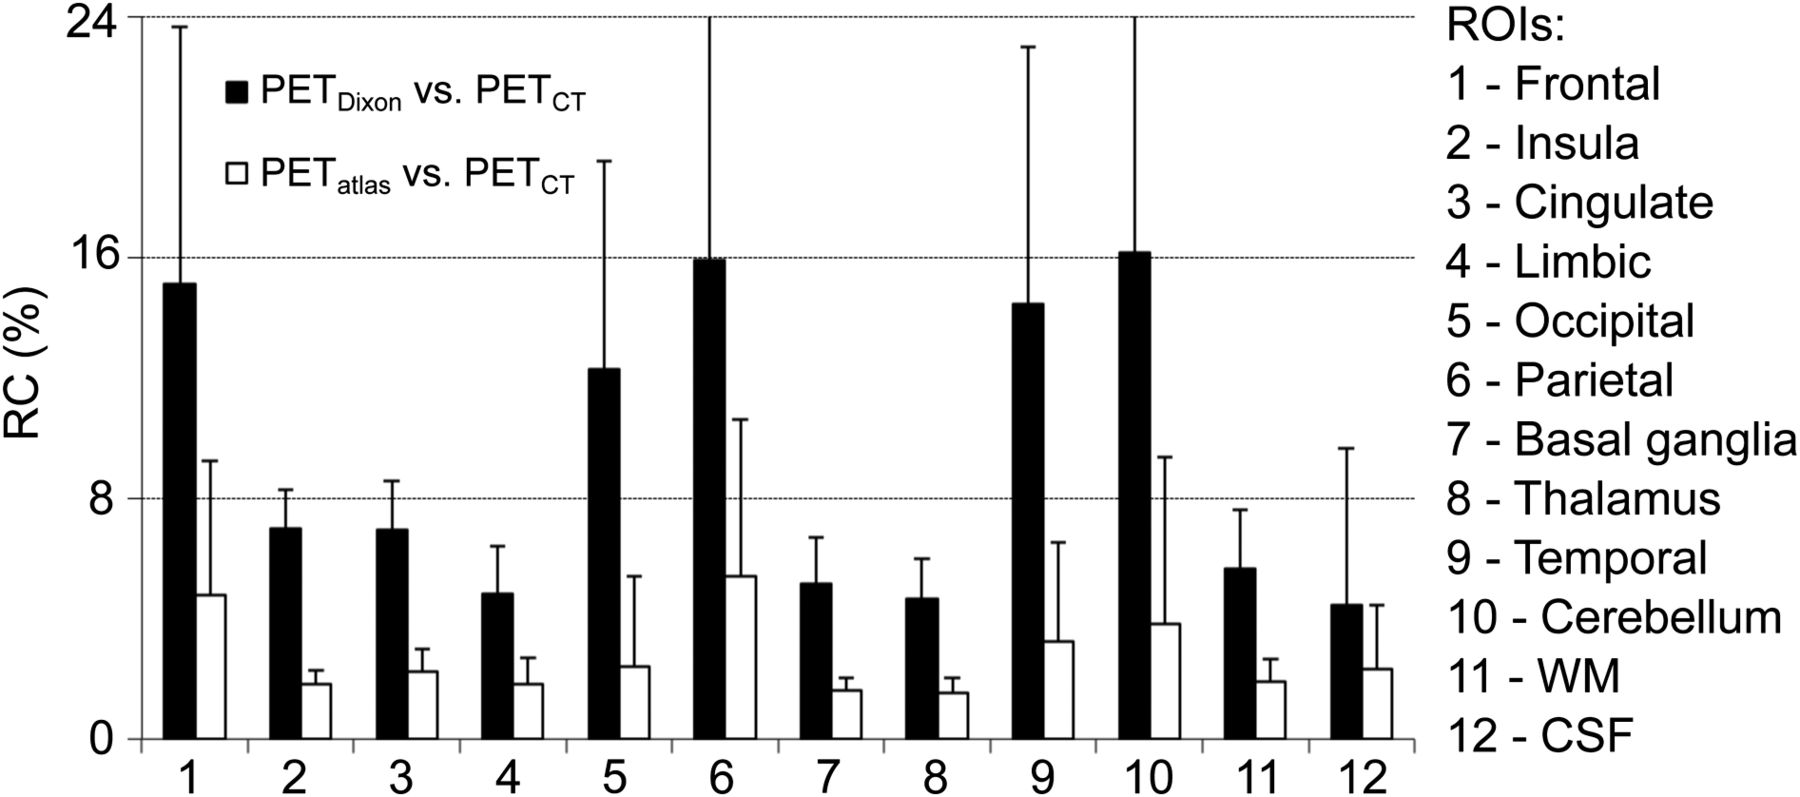
The ROI-based comparison for the 12 ROIs is presented in Figure 5. Similar results were obtained in the 28 Automatic Anatomic Labeling frontal subregions (Supplemental Table 1).

ROI-based analysis for all validation subjects of absolute RCs in PET images when using MR-based AC methods (PETatlas and PETDixon) vs. CT-based approach (PETCT). CSF = cerebrospinal fluid; WM = white matter.
The mean and maximum T/Bs and standardized uptake values (SUVs) for the tumor and reference ROIs are given in Table 2. No significant differences were observed when mean and maximum T/B and SUV were compared between PETatlas and PETCT. Underestimation of mean and maximum T/B on PETDixon just failed to reach statistical significance when compared with either PETCT or PETatlas, whereas both mean and maximum SUV were significantly underestimated with PETDixon compared with either PETCT or PETatlas (Table 2).
Summary of T/B Results for 18F-FET Subset (n = 7)
DISCUSSION
We have proposed and implemented a head MR AC approach for correcting the PET data acquired on integrated PET/MR scanners. In our approach, we combined features from both segmentation- and atlas-based techniques to implement a robust and flexible method for brain imaging. The method is based on the widely popular SPM software and uses the diffeomorphic image registration algorithm, DARTEL, as implemented in SPM8 (25,26). The use of 6 segmented tissue classes (gray matter, white matter, cerebrospinal fluid, soft tissue, bone, and air) instead of the classic intensity-based MR images facilitates the nonrigid coregistration step: not only is more information available to perform the registration but the accuracy of the image segmentation enables better coregistration of the tissue classes. Because the DARTEL nonrigid coregistration method relies on these segmentations, our approach could in principle overcome local anatomic variants given appropriate segmentation and has the potential to perform more robustly than other purely atlas-based approaches in terms of both accuracy of LACs and adaptability to local anatomic features (3 examples of patients from the atlas-generation dataset with large tumors close to bone and with surgical procedures are shown in Supplemental Figs. 3–5). However, further studies in even more challenging subjects are required to fully demonstrate this potential advantage.
In terms of feasibility, our approach is easy to implement under MATLAB (MathWorks) and requires only free software (SPM and FreeSurfer) to generate a μ map in less than 30 min on a standard computer.
The similar results (in terms of RC) obtained for the postcontrast atlas generation and the precontrast validation datasets (Table 1) suggest that the use of contrast-enhanced MR images to generate the template does not affect the outcome. The differences between the mean RCs obtained from the analysis of the AC maps and the PET reconstructed images (Table 1) are due to the 3-dimensional cumulative effect that inaccurate μ maps have on the reconstructed images.
Some of the differences observed could be due to inaccuracies in the CT-derived μ map. Although currently accepted as the gold standard, CT AC can be affected by CT image artifacts, being one of the sources of errors in PET quantification (27). For example, artifacts commonly appear around metallic dental fillings, implants, and braces (Supplemental Fig. 6). In most cases, these produce streak artifacts in the CT images, whereas in the MR images they typically generate an ovoid signal void due to the magnetic susceptibility. Although the CT streak artifacts directly affect the resulting μ maps, they do not appear in the maps derived using the atlas-based method (Supplemental Fig. 6). However, further studies are required to fully understand the potential benefits and drawbacks of the MR-based approach in this context.
Although mean SUV (and maximum SUV for tumor ROIs) were significantly underestimated for both tumor and reference ROIs when PETDixon was compared with either PETCT or PETatlas, mean or maximum T/B also showed a consistent underestimation but just failed to reach statistical significance (Table 2). This could be due to two reasons: first, both reference and tumor ROIs were underestimated for PETDixon in terms of SUV, and therefore by taking their ratio, we could compensate for some (but not all) of the underestimation effects; and second, the small sample of subjects analyzed (n = 7), especially considering the first point (a compensation of underestimation factors when the ratio is taken), prevented the T/B from reaching statistical significance. Because bone is not considered in the Dixon approach, highly statistically significant underestimations occur on the PETDixon images that could severely bias the quantification and potential clinical diagnosis.
The results suggest that our method provides more accurate quantification than do previously proposed MR AC methods, in terms of both the accuracy of the μ maps and PET quantification. Segmentation-based approaches have shown differences (compared with either CT AC or transmission-based AC) of around 10% or higher for brain imaging (11,12,28). A comparison between a segmentation- and an atlas-based method with 2 different nonrigid algorithms was performed by Malone et al. on 10 control subjects (8). The authors reported that the atlas methods offered better results than transmission-based AC, with mean differences smaller than 2%. Results similar to ours were also presented by Johansson et al. and Larsson et al. with a machine learning method based on a mixture of gaussians (29,30) and by Navalpakkam et al. with a support vector machine (31). The authors obtained accurate LACs, with mean differences in PET reconstructed images of around 2%–3% in both studies compared with CT AC PET image reconstruction. The practical applicability of the methods may be reduced, however, by their requirement for multidimensional training image space including multiple MR images (T2-weighted VIBE and dual-echo ultrashort echo times) in addition to the corresponding CT images. Additionally, these methods relied on similar MR image intensities for different subjects to produce accurate results, which may be challenging across institutions. Kops et al. and Malone et al. previously presented an atlas-method based on the SPM2 nonrigid registration algorithm (4,8). The mean differences reported compared with transmission-based AC revealed an overestimation of 9%. In contrast, our method uses 6 tissue classes instead of intensity images and a diffeomorphic image registration approach, which was already shown to provide accurate results in the brain (26) and is more accurate than the coregistration algorithm included in SPM2 used by Kops et al. (4).
A limitation of our method is that the segmentation of the 6 different classes is less precise in the neck area, and hence the resulting μ maps are less accurate in this region. This is because the segmentation step relies heavily on prior anatomic information (included in the SPM software) and the New Segment tool in SPM8 is primarily focused on the head, being less accurate in other areas. Fortunately, as only a small fraction of the lines of response traverse both the neck area and parts of the brain, the effect on the final PET reconstructed brain images is minimal. The method could in principle be adapted to other body regions, assuming that an accurate segmentation of tissue classes (e.g., bone, soft tissue, fat, air, and lungs) can be performed.
CONCLUSION
We have presented an SPM8-based approach for deriving the head μ map from anatomic MR images that could, in principle, be used in any PET/MR scanner. The method combines the strengths of both segmentation- and atlas-based methods while minimizing their drawbacks. Its implementation is straightforward and, unlike other approaches, requires only the data acquired with a single MR sequence (MPRAGE). Compared with the method currently available on the Biograph mMR scanner, PET image quantification is improved by 70%, on average. The improvement is the largest in areas adjacent to cortical bone (e.g., brain cortex), which are of interest in numerous neurologic disorders. A package containing the necessary software to generate the μ maps from newly acquired MR images will be provided to interested users on request.
DISCLOSURE
The costs of publication of this article were defrayed in part by the payment of page charges. Therefore, and solely to indicate this fact, this article is hereby marked “advertisement” in accordance with 18 USC section 1734. Funding for this work was provided by NIH grants R01CA137254 and 1R01EB014894. No other potential conflict of interest relevant to this article was reported.
Footnotes
Published online Oct. 2, 2014.
- © 2014 by the Society of Nuclear Medicine and Molecular Imaging, Inc.
REFERENCES
- Received for publication December 12, 2013.
- Accepted for publication August 4, 2014.


Jump to section
Related Articles
Cited By...
- Simultaneous EEG-PET-MRI identifies temporally coupled, spatially structured hemodynamic and metabolic dynamics across wakefulness and NREM sleep
- Nigrostriatal Dopaminergic Neurotransmission and Resilience to Peripheral Systemic Risk Factors for Gait Slowing upon Transition to Uneven Surfaces in Older Adult
- On the analysis of functional PET (fPET)-FDG: baseline mischaracterization can introduce artifactual metabolic (de)activations
- Generation of synthetic TSPO PET maps from structural MRI images
- Robust deep learning estimation of cortical bone porosity from MR T1-weighted images for individualized transcranial focused ultrasound planning
- Neuroinflammation in post-acute sequelae of COVID-19 (PASC) as assessed by [11C]PBR28 PET correlates with vascular disease measures
- The functional and structural associations of aberrant microglial activity in major depressive disorder
- Multimodal Investigation of Neuroinflammation in Aviremic Patients With HIV on Antiretroviral Therapy and HIV Elite Controllers
- Characterization and Mitigation of Model Bias in Parametric Mapping of Dopamine Response to Behavioral Challenge
- Assessment of Motion Bias on the Detection of Dopamine Response to Challenge
- A Simultaneous [11C]Raclopride Positron Emission Tomography and Functional Magnetic Resonance Imaging Investigation of Striatal Dopamine Binding in Autism
- Epigenetic Signatures of Human Myocardium and Brown Adipose Tissue Revealed with Simultaneous Positron Emission Tomography and Magnetic Resonance of Class I Histone Deacetylases
- Moving Toward Multicenter Therapeutic Trials in Amyotrophic Lateral Sclerosis: Feasibility of Data Pooling Using Different Translocator Protein PET Radioligands
- Imaging of neuroinflammation in migraine with aura: A [11C]PBR28 PET/MRI study
- Synthesis of Patient-Specific Transmission Data for PET Attenuation Correction for PET/MRI Neuroimaging Using a Convolutional Neural Network
- Dixon-VIBE Deep Learning (DIVIDE) Pseudo-CT Synthesis for Pelvis PET/MR Attenuation Correction
- An Efficient Approach to Perform MR-Assisted PET Data Optimization in Simultaneous PET/MR Neuroimaging Studies
- Pseudoreference Regions for Glial Imaging with 11C-PBR28: Investigation in 2 Clinical Cohorts
- PET/MRI in the Presence of Metal Implants: Completion of the Attenuation Map from PET Emission Data
- Dopamine in the medial amygdala network mediates human bonding
- Clinical Evaluation of Zero-Echo-Time Attenuation Correction for Brain 18F-FDG PET/MRI: Comparison with Atlas Attenuation Correction
- Insights into neuroepigenetics through human histone deacetylase PET imaging
- Multi-Atlas-Based Attenuation Correction for Brain 18F-FDG PET Imaging Using a Time-of-Flight PET/MR Scanner: Comparison with Clinical Single-Atlas- and CT-Based Attenuation Correction
- Dixon Sequence with Superimposed Model-Based Bone Compartment Provides Highly Accurate PET/MR Attenuation Correction of the Brain
- MRI-Based Attenuation Correction for PET/MRI Using Multiphase Level-Set Method
- Evaluation of Atlas-Based Attenuation Correction for Integrated PET/MR in Human Brain: Application of a Head Atlas and Comparison to True CT-Based Attenuation Correction
- Fast Patch-Based Pseudo-CT Synthesis from T1-Weighted MR Images for PET/MR Attenuation Correction in Brain Studies
- MR-Based Attenuation Correction Using Ultrashort-Echo-Time Pulse Sequences in Dementia Patients