


Abstract
The translocator protein (TSPO) is a commonly used imaging target to investigate neuroinflammation. Although TSPO imaging demonstrates great promise, its signal exhibits substantial interindividual variability, which needs to be accounted for to uncover group effects that are truly reflective of neuroimmune activation. Recent evidence suggests that relative metrics computed using pseudoreference approaches can minimize within-group variability and increase sensitivity to detect physiologically meaningful group differences. Here, we evaluated various ratio approaches for TSPO imaging and compared them with standard kinetic modeling techniques, analyzing 2 different disease cohorts. Patients with chronic low back pain (cLBP) or amyotrophic lateral sclerosis (ALS) and matching healthy controls received 11C-PBR28 PET scans. The occipital cortex, cerebellum and whole brain were first evaluated as candidate pseudoreference regions by testing for the absence of group differences in SUV and distribution volume (VT) estimated with an arterial input function. The SUV from target regions (cLBP study, thalamus; ALS study, precentral gyrus) was normalized with the SUV from candidate pseudoreference regions (i.e., occipital cortex, cerebellum, and whole brain) to obtain SUVRoccip, SUVRcereb, and SUVRWB. The sensitivity to detect group differences in target regions was compared using various SUVR approaches, as well as distribution volume ratio (DVR) estimated with (blDVR) or without arterial input function (refDVR), and VT. Additional voxelwise SUVR group analyses were performed. We observed no significant group differences in pseudoreference VT or SUV, excepting whole-brain VT, which was higher in cLBP patients than controls. Target VT elevations in patients (P = 0.028 and 0.051 in cLBP and ALS, respectively) were similarly detected by SUVRoccip and SUVRWB, and by refDVR and blDVR (less reliably by SUVRcereb). In voxelwise analyses, SUVRoccip, but not SUVRcereb, identified regional group differences initially observed with SUVRWB, and in additional areas suspected to be affected in the pathology examined. All ratio metrics were highly cross-correlated, but generally were not associated with VT. Although important caveats need to be considered when using relative metrics, ratio analyses appear to be similarly sensitive to detect pathology-related group differences in 11C-PBR28 signal as classic kinetic modeling techniques. The occipital cortex may be a suitable pseudoreference region, at least for the populations evaluated, pending further validation in larger cohorts.
A growing body of work indicates that neuroinflammation, and more specifically glial activation, plays an important role in the pathophysiology of many neurologic disorders, ranging from schizophrenia to chronic pain (1). Arguably, the most commonly evaluated target for in vivo visualization of glial activation is translocator protein (TSPO) (2). TSPO is strongly upregulated in activated microglia and reactive astrocytes during brain and spinal neuroinflammatory states (3) and can be imaged with PET radiotracers such as 11C-PBR28.
Using 11C-PBR28 with classic kinetic modeling measures, various groups have detected elevated PET signal in a variety of conditions with a known or suspected inflammatory component, including Alzheimer disease (4,5), HIV (6), and epilepsy (7), among others. Despite these promising results, interpretation of TSPO PET signal is often complicated by substantial interindividual variability. For instance, large variability is commonly observed when 11C-PBR28 binding is quantified by distribution volume (VT) estimation with arterial input function (AIF) (8), which is considered by many to be the gold standard for quantification of TSPO binding. Such variability, which may be associated with multiple factors not necessarily linked to neuroinflammation, including genetically explained differences in radioligand binding affinity (9), variability in vascular TSPO binding (10), or binding to plasma protein (11), needs to be accounted for to identify group effects that are truly reflective of neuroimmune activation. However, whereas the effect of genotype on TSPO PET signal is well documented (9,12,13), the extent to which variability in vascular or plasma binding affects TSPO PET data remains to be characterized.
One way to account for such global variability is to scale 11C-PBR28 uptake (either estimated using kinetic modeling or through simplified methods such as SUV) by a normalizing factor. Of course, the use of relative outcome measures precludes the absolute quantification of protein expression, which is a strength of PET imaging. However, previous work showing that ratio metrics can detect group differences with a sensitivity similar to traditional kinetic modeling (4) suggests that these approaches may be beneficial under certain circumstances. Several studies have normalized 11C-PBR28 uptake with average signal of the whole brain (WB) or whole gray matter (6,8,14–18). Although this approach may improve the detection of focal effects by robustly reducing between-subject variability, it also carries a penalty in that it reduces sensitivity to detect spatially extended effects. This becomes particularly problematic when the condition investigated is characterized by global, rather than regional, inflammation (e.g., neurologic disorders demonstrating widespread neurodegeneration, and exposure to lipopolysaccharide challenge), and thus the reference region signal will contain signal from target regions. Therefore, the identification of a more focal reference region is desirable (4). Because of the lack of a true TSPO reference region devoid of specific binding (19), a suitable pseudoreference region, relatively unaffected by pathology, must be identified.
In the present investigation, we evaluated analytic approaches using different pseudoreference regions for 11C-PBR28 PET imaging and compared them with standard kinetic modeling techniques.
MATERIALS AND METHODS
Study Design
In this study, we reanalyzed 2 disease cohorts from previously reported datasets, chronic low back pain (cLBP) (14) and amyotrophic lateral sclerosis (ALS) (17), along with corresponding healthy control subjects. We evaluated cerebellum, occipital cortex, and WB as putative pseudoreference regions. The cerebellum was chosen to evaluate the generalizability to other disorders of the results by Lyoo et al. (4), who had shown this region to be a viable pseudoreference for 11C-PBR28 studies in Alzheimer disease. The occipital cortex was chosen because it is thought to be relatively spared from pathology in patients with either chronic pain (20,21) or ALS (22,23). The WB has been used to normalize signal in the original cLBP and ALS publications, as well as in other studies (14,15,17,18). To compare the effect of the regional pseudoreference approach with the original analyses, which used SUV normalized by WB (SUVRWB), the same preprocessing and group analyses from the original studies were replicated, preserving the existing across-studies differences in design and image processing.
Detailed information about the analytic strategies used are presented here. In brief, initial characterization of candidate pseudoreference regions was performed by testing for the absence of group differences in VT, estimated with AIF and traditional 2-tissue-compartmental modeling and SUV. Subsequently, the sensitivity to detect SUVR region-of-interest (ROI) group differences in target regions (that is, regions showing the largest group differences in the original studies: bilateral thalamus [cLBP] and bilateral precentral gyrus [ALS]) was compared with that using VT. Additional SUVR group analyses were performed in a WB voxelwise approach. The pseudoreference region providing the greatest sensitivity to detect group differences in the preliminary SUVR analyses (i.e., occipital cortex, see the “Results” section) was then further assessed, by computing distribution volume ratio estimated with (blDVRoccip) or without AIF (refDVRoccip).
All datasets were acquired at the Athinoula A. Martinos Center for Biomedical Imaging at Massachusetts General Hospital. All protocols were approved by the Institutional Review Board and Radioactive Drug Research Committee, and all subjects signed a written informed consent form.
Subjects
Demographic information from the participants has previously been published (14,17). Briefly, the cLBP study consisted of 10 patients and 9 healthy controls, evaluated in a matched-pairs design (with 2 patients matched to the same control). The ALS study consisted of 10 patients and 10 controls (8 of whom were scanned as part of the cLBP study) demographically matched but not individually paired with ALS patients (Supplemental Table 1; supplemental materials are available at http://jnm.snmjournals.org).
Image Acquisition
Ninety-minute dynamic 11C-PBR28 scans were obtained with an integrated PET/MRI scanner consisting of a dedicated brain avalanche photodiode-based PET scanner in the bore of a Siemens 3-T Tim Trio MRI (24). A multiecho magnetization prepared rapid acquisition gradient echo (MPRAGE) volume was acquired before tracer injection (repetition time/echo time 1 [TE1]/TE2/TE3/TE4 = 2,530/1.64/3.5/5.36/7.22 ms, flip angle = 7°, voxel size = 1 mm isotropic) for the purpose of anatomic localization, spatial normalization of the imaging data, and generation of attenuation-correction maps (25). For either cohort, mean injected dose and injected mass were not significantly different across groups (Supplemental Table 1).
Arterial Plasma and Metabolite Analysis
For the first 3 min after injection, arterial blood samples were collected at 6- to 10-s intervals, followed by additional samples at 5, 10, 20, 30, 60, and 90 min for plasma and metabolite analysis. The parent fraction in plasma was determined as follows. Arterial blood was centrifuged immediately after collection to separate plasma. A 600-μL plasma aliquot was removed and added to 600 μL of acetonitrile to cause protein precipitation. After centrifugation, a 300-μL aliquot of supernatant was removed and diluted into 4 mL of water. This sample was loaded on a HyperSep C18 solid extraction cartridge (500 mg of medium) that had been prewashed with ethanol and equilibrated with aqueous trifluoroacetic acid (0.1%). The flow-through was collected as elution volume 1 and the column was eluted in 7 additional steps (4 mL of eluent) at the following acetonitrile percentages: 0, 10, 20, 30, 40, 70, 100, with the balance being 0.1% trifluoroacetic acid. The unmetabolized compound (assigned by control experiments) was collected in elution volumes 5 through 8. The ratio of summed radioactivity in elution volumes 5 through 8 (parent compound) was taken relative to the total radioactivity eluted to determine the parent fraction for each time point. Five plasma outliers were excluded, as they fell outside the range of median ± 2.5 × median absolute deviation (26). Another 2 subjects’ data were excluded because of technical complications that prevented completion of arterial sampling.
Data Analysis
Static Image Generation
SUV images (60–90 min) were generated as described previously (14,17). MPRAGE-based attenuation correction was performed according to published methods (25). SUV maps were transformed to Montreal Neurological Institute space and smoothed with a gaussian kernel of 8 mm (cLBP) or 6 mm (ALS) in full width at half maximum, as in the respective original analyses (14,17). Finally, SUV frames were normalized by average uptake in cerebellum (SUVRcereb) and occipital cortex (SUVRoccip) for comparison against previously reported SUVRWB.
Dynamic Image Generation
Dynamic 11C-PBR28 scans were reconstructed using in-house software with the following time frames: 8 × 10, 3 × 20, 2 × 30, 1 × 60, 1 × 120, 1 × 180, 8 × 300, and 4 × 600 s. Frame-by-frame motion correction was performed, and data were converted to SUV by dividing by injected radioactivity/lean body mass. To characterize dynamic activity in candidate pseudoreference regions and WB, SUV time–activity curves were extracted from images in subject-space. Dynamic data were unavailable for 1 control in the ALS cohort, and this subject was excluded from all dynamic analyses.
Kinetic Modeling
VT was estimated for all target and reference regions using 2-tissue-compartmental modeling with a fixed blood volume of 5% (19). For plasma processing, parent plasma fraction curves were fitted to a biexponential function. Plasma curves were fitted to a triexponential function and combined with interpolated parent fractions to yield a metabolite-corrected plasma curve (Supplemental Fig. 1 shows example fits for both parent fraction and plasma input function). Arterial plasma data were unavailable for 1 cLBP and 1 ALS patient (for technical difficulties during the scan, as mentioned above); therefore, these subjects were excluded from all blood-based analyses. As the occipital cortex emerged as the preferred candidate for pseudoreference region (see the “Results” section), we proceeded with kinetic modeling of ratio metrics using only this brain area. Occipital DVR was estimated in 2 ways with in-house Matlab (The MathWorks) code, both implementing Logan graphical analysis (reference-based (27) and blood-based (28)) with t* = 15 min. First, we used the occipital time–activity curve as an input function to obtain DVR (refDVRoccip). Then, we computed AIF-derived DVR (blDVRoccip) by dividing target VT by occipital cortex VT. We chose Logan-based methods as primary analytic approaches for ratio metrics, as in previous 11C-PBR28 studies (29,30), because they allow a direct comparison of VT estimations with AIF as well as blood-free pseudoreference tissue inputs (a secondary aim in the present study).
Statistical Analysis
To evaluate the viability of putative pseudoreference candidate regions, we first sought to demonstrate that PET signal in these regions was not different across groups, which would preclude their utility as pseudoreference regions. To this end, we compared VT and SUV across groups for the cerebellum, occipital cortex, and WB. For SUV analyses, we used the same nonparametric tests used in the previous publications (Wilcoxon signed-rank test for cLBP (14); Mann–Whitney U test for ALS (17)). Subsequently, we used the same statistical tests to evaluate the ability of different ROI-based analytic approaches (SUVR, refDVR) to detect group differences in target regions. Because outlier exclusion unbalanced the relative proportion of high- and mixed-affinity binders in both cLBP and ALS groups, an unpaired 1-way ANOVA with group and genotype as fixed factors and a group*genotype interaction term were used to assess group differences in blDVR and VT.
Group differences were interrogated with target region SUVR and compared with differences obtained with VT. Receiver-operating-characteristic (ROC) curves were then used to further characterize the ability of each candidate pseudoreference region to distinguish patients from controls based on mean target region SUVR, in comparison to target VT. Area under the ROC curve (AUROC) was used as an outcome measure (AUROC = 1 represents perfectly accurate group classification, or 100% specificity and sensitivity, and AUROC = 0.5 indicates discriminatory power equivalent to chance). WB voxelwise SUVR analyses were also performed for comparison with the SUVRWB data previously reported (14,17). Briefly, these analyses were conducted using the randomize tool from the FSL suite, with threshold-free cluster enhancement (31), and a corrected threshold of P < 0.05. Relationships between VT, SUV, SUVR, and DVR were assessed with Pearson r. In the cLBP dataset, because 2 patients matched the same control, the SUVR ROI and voxelwise group comparisons were repeated in 2 separate matched-pairs analyses, using 1 of the 2 patients matched control, as described previously (14). Because results using both patients were similar, we present here group comparisons using the best match (in terms of age). However, because 1 of these 2 cLBP matching patients lacked arterial plasma data, the VT and blDVR (and, for consistency, refDVR) analyses were performed only with the patient for whom these data were available. In the unpaired group and correlation analyses, all available data were used.
RESULTS
Descriptive statistics for all outcome measures are shown in Table 1.
Descriptive Statistics for All Outcome Measures
SUV and VT in Candidate Pseudoreference Regions
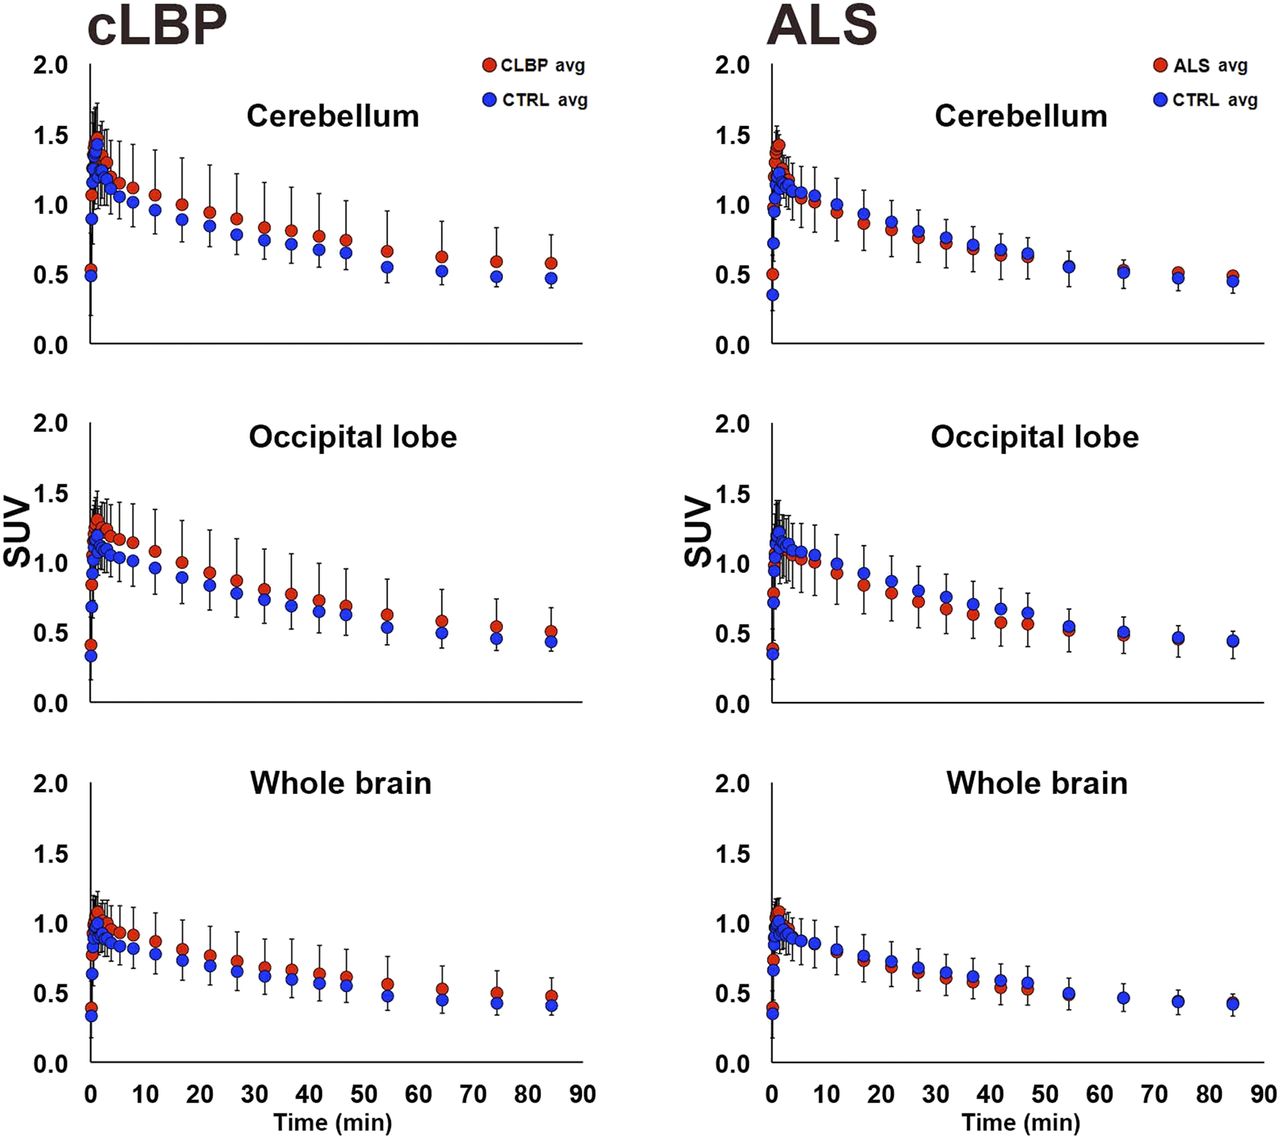
There were no significant group differences in SUV for any of the pseudoreference regions (Fig. 1, left). No significant group differences in VT were observed for occipital and cerebellar pseudoreference regions, for either study; however, there was a significant group difference for WB VT in the cLBP study, with the patients exhibiting higher values than controls (P < 0.05; Fig. 1, right). SUV time–activity curves from 0 to 90 min for each candidate pseudoreference region are presented in Figure 2.

Group comparison of SUV (left) and VT (right) from candidate pseudoreference regions evaluated in this work. Boxes represent 25%–75% interquartile range; horizontal line represents median. Diamonds represent subjects with the high-affinity TSPO genotype (Ala/Ala in the TSPO polymorphism); squares represent subjects with mixed-affinity genotype (Ala/Thr). CTRL = control.

Group comparison of 0- to 90-min time–activity curves for candidate pseudoreference regions. Each data point represents average within-group SUV for that time point ± SD. In cLBP plots (left), both patients matching same control subject are included. CTRL = control.
Target VT Group Differences
Group comparisons between target VT yielded a statistically significant difference in thalamus for cLBP patients (P < 0.05) and trended toward significance in the precentral gyrus for ALS patients (P = 0.051; Fig. 3).
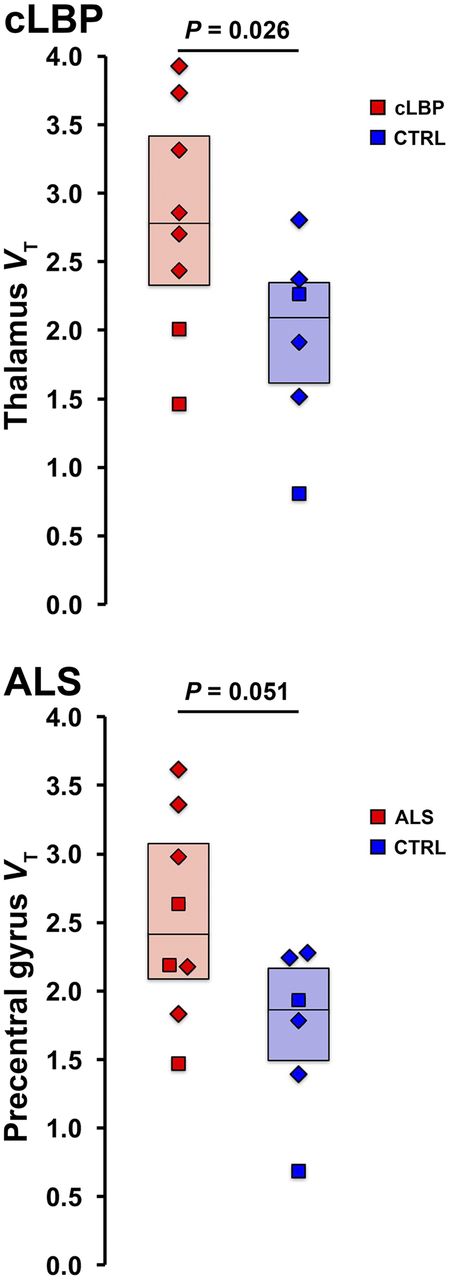
Group comparison of target VT estimates for cLBP (top) and ALS (bottom) groups. CTRL = control.
Target SUVR Group Differences
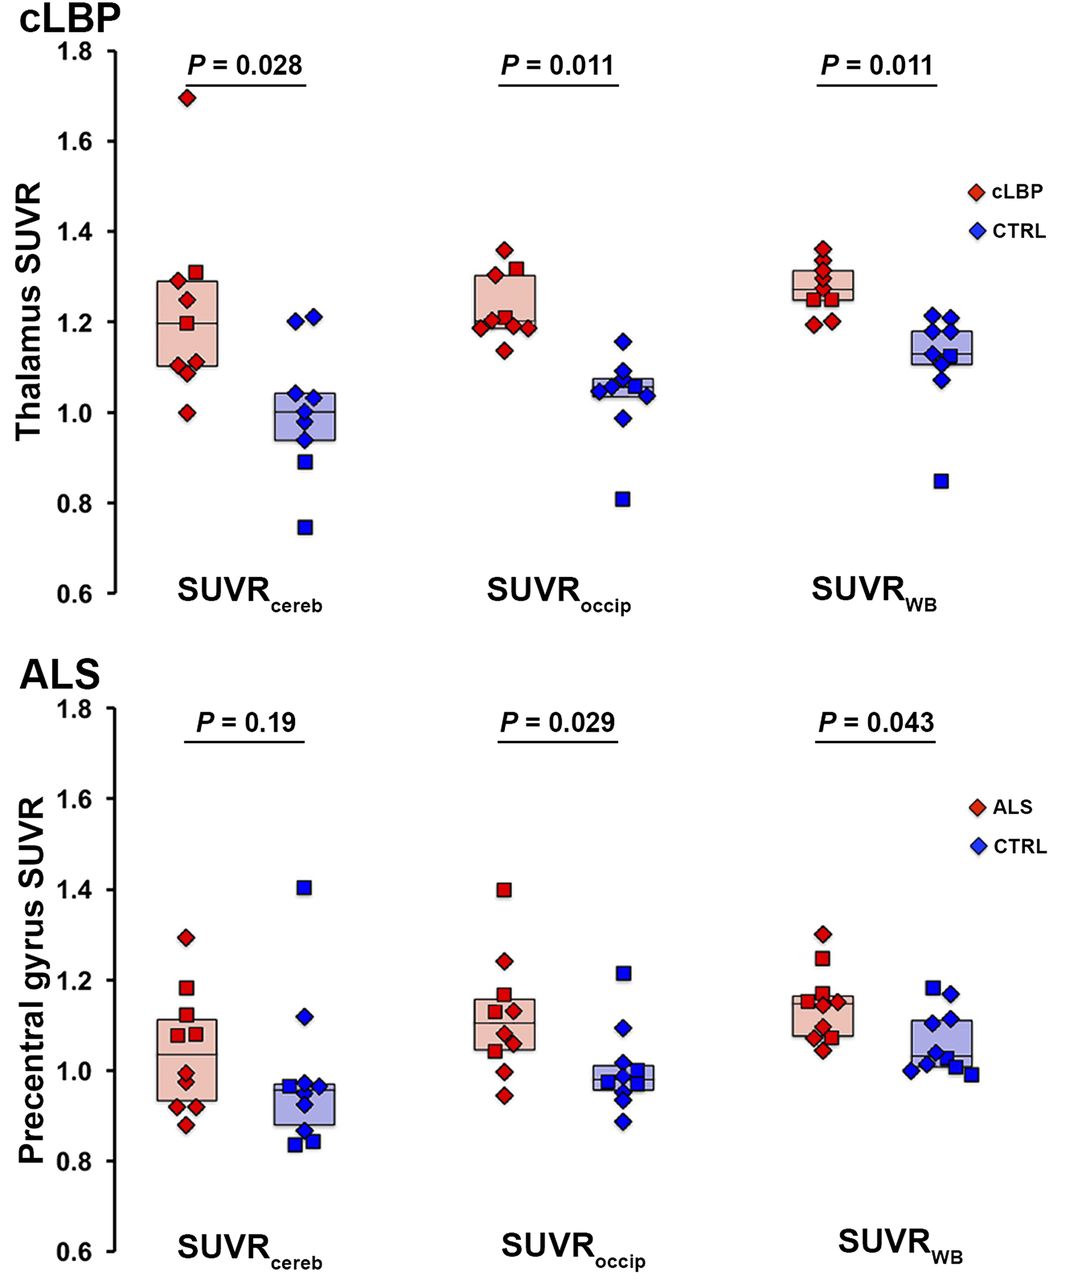
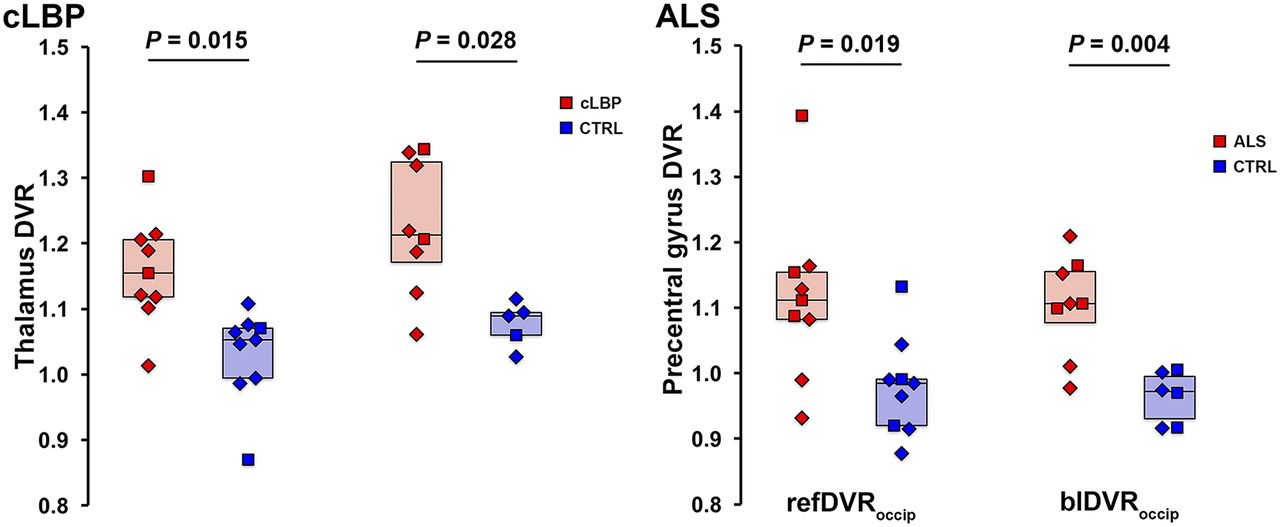
Results from both cohorts indicated that the most significant group differences in target SUVR were obtained using the occipital cortex and WB as normalizing regions, followed by cerebellum (Fig. 4). ROC curves confirmed that SUVRoccip and SUVRWB yielded better sensitivity to detect group differences than SUVRcereb (Fig. 5). SUVRoccip displayed the largest AUROC (cLBP: SUVRoccip, 0.988; SUVRWB, 0.951; SUVRcereb, 0.840; and ALS: SUVRoccip, 0.790; SUVRWB, 0.770; SUVRcereb, 0.680). For comparison, Figure 5 also shows the ROC curves obtained using target VT (AUROC, 0.792 and 0.771 for the cLBP and ALS studies, respectively).

Group differences in target SUVR for each pseudoreference region. Horizontal bars represent group median. In cLBP plots (top), both patients matching same control subject are included as data points, but median value reflects only best matching patient included. CTRL = control.

ROC curves of target SUVR (dashed lines) and VT (solid line) for each pseudoreference region. Line of identity (chance, no discriminatory power) is shown in black.
Voxelwise SUVR Group Differences
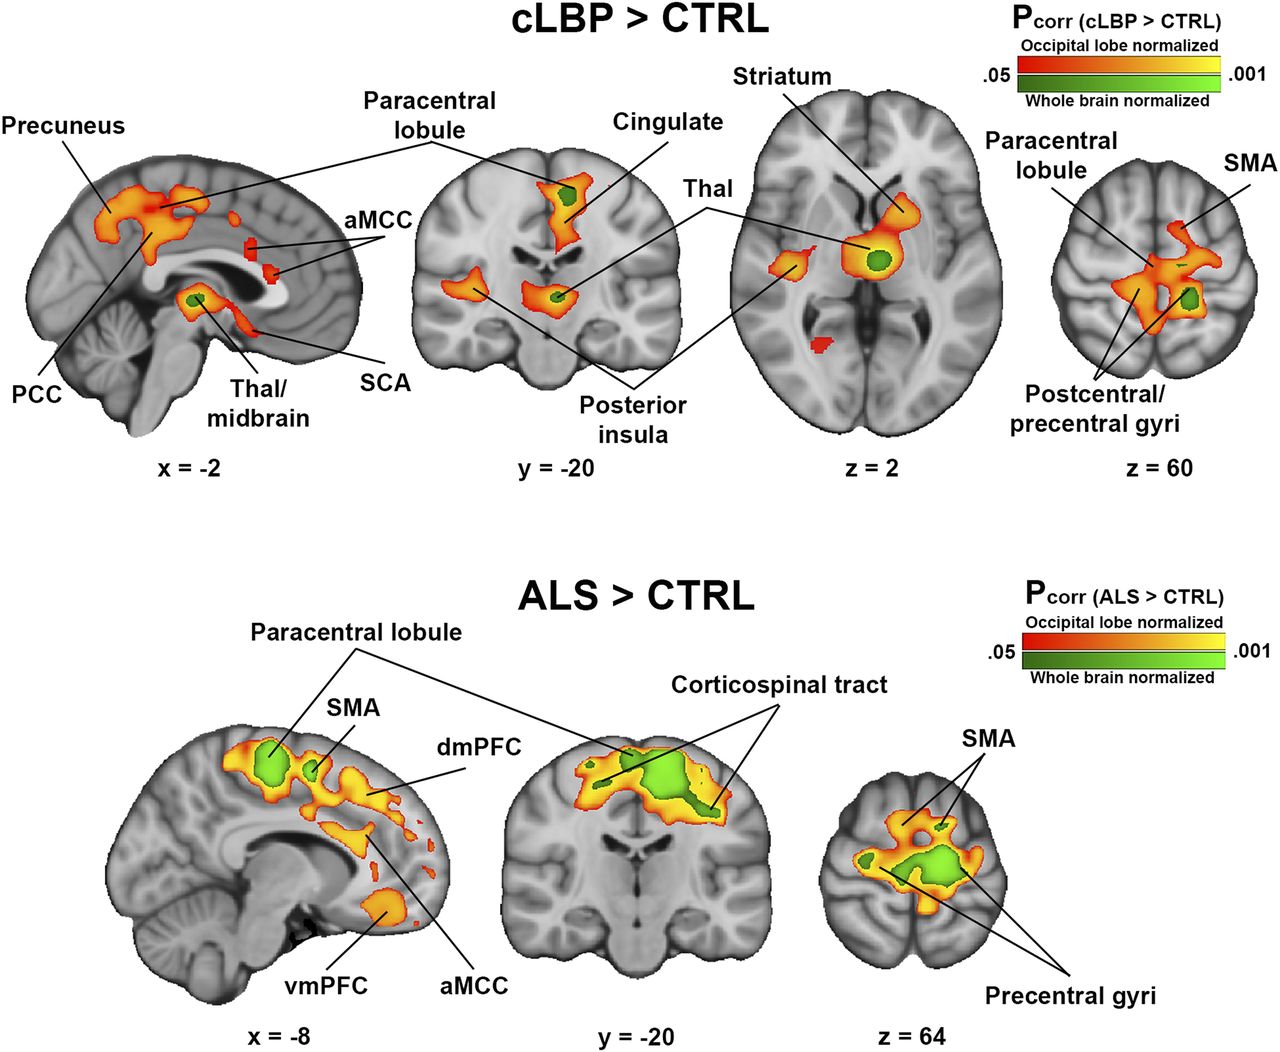
For both cLBP and ALS cohorts, voxelwise SUVRoccip analysis revealed several cortical and subcortical regions exhibiting greater signal in patients than controls (Fig. 6). Several of these regions were consistent with those from the original SUVRWB analyses (cLBP: thalamus, paracentral lobule, and precentral and postcentral gyri (14); ALS: supplementary motor area, corticospinal tract, paracentral lobule, and precentral gyrus (14)). However, when SUVRoccip was used, several additional regions with significant group differences emerged (cLBP: posterior insula, striatum, anterior midcingulate and posterior cingulate cortices, and others [Supplemental Table 2]; ALS: dorsomedial, dorsolateral, ventrolateral, and ventromedial prefrontal cortices; anterior midcingulate cortex; and others [Supplemental Table 3]). Importantly, group differences were present in these same regions for the SUVRWB analysis if the significance threshold was lowered to a significantly less stringent value (Supplemental Fig. 2). There were no regions in which SUVR was greater in controls than patients for any pseudoreference region. There were no significant group differences from the SUVRcereb analysis.

Regions of elevated 11C-PBR28 SUVR in patients compared with controls. Results from SUVRWB analyses (analyses from original studies) are shown in green colorscale; SUVRoccip results are shown in red-yellow colorscale. (Top) cLBP > controls. (Bottom) ALS > controls. No regions were significant in either cLBP < controls or ALS < controls contrasts. aMCC = anterior midcingulate cortex; CTRL = control; dmPFC = dorsomedial prefrontal cortex; PCC = posterior cingulate cortex; SCA = subcallosal area; SMA = supplementary motor area; Thal = thalamus; vmPFC = ventromedial prefrontal cortex.
DVR Group Differences
Because the occipital cortex emerged as the preferred pseudoreference region, based on the results presented, additional ratio metrics were computed using this brain area only. Group comparisons between target refDVRoccip and blDVRoccip yielded significant differences between patients and controls for both the cLBP and the ALS studies, similar to the VT and SUVR ROI analyses (Fig. 7).

Group comparison of refDVRoccip and blDVRoccip. Horizontal bars represent group median. CTRL = control.
Associations Across Metrics
Overall, all ratio metrics were highly cross-correlated (Supplemental Table 4) but generally did not correlate well with VT. Target SUVRoccip was strongly correlated with both refDVRoccip and blDVRoccip for both cLBP and ALS groups (Supplemental Fig. 3), even with plasma outliers included (Supplemental Fig. 4). In the cLBP group, thalamus VT was significantly correlated with SUVRoccip (P < 0.05) and SUVRWB (P < 0.001) and showed a trend-level correlation with blDVRoccip (P = 0.059). However, there were no other statistically significant correlations between target VT and SUVR, refDVRoccip, or blDVRoccip (P ≥ 0.21). Target regions were highly intercorrelated with all reference regions for both VT and SUV (P ≤ 1.3 × 10⁻⁴). Target and occipital cortex VT estimated with 2-tissue-compartmental modeling were highly correlated with VT estimated with Logan graphical analysis (Supplemental Fig. 5).
DISCUSSION
Our study suggests that quantitation of 11C-PBR28 PET signal via pseudoreference approaches, with or without AIF, can detect group differences with a sensitivity similar to analysis with traditional VT estimates, for the cLBP and ALS datasets presented here. In particular, the occipital cortex emerged as a preferred pseudoreference region, because it displayed no significant group differences, and relative metrics using occipital cortex as a pseudoreference region yielded the highest sensitivity to detect group differences in both target ROI and WB voxelwise analyses. Voxelwise differences in 11C-PBR28 SUVRoccip were present in the original SUVRWB analyses if the significance threshold was lowered to a much less stringent value (14,17). Thus, the use of a localized pseudoreference region led to increased power to detect group differences. This suggests that spatially diffuse group differences in TSPO signal might contribute to the normalizing signal when WB is used as a pseudoreference region. Indeed, we found that WB VT was higher in patients than controls, at least for cLBP. This highlights the benefit of using a more focal pseudoreference region devoid of signal from target regions, rather than the use of WB or whole gray matter signal, as has been done previously. Although additional validation in larger studies is warranted, our observations suggest that the occipital cortex may be a suitable pseudoreference region for studies involving 11C-PBR28 in these clinical populations, and perhaps in other patient groups in which the occipital cortex is thought to be relatively spared from pathology.
Blood-free methods for quantifying TSPO tracer binding, such as those used in the current study, are extremely attractive for clinical applications. Quantification with kinetic modeling and AIF does not translate well to clinical settings, because it is invasive and requires an experienced practitioner (e.g., an anesthesiologist) to place an arterial catheter. Furthermore, quantifying TSPO tracer binding with VT, with or without normalization by plasma-free fraction (fP), is associated with a large variability that may be attributable to challenges in obtaining accurate blood measurements in addition to physiologic variability (8,18).
Of note, our criteria for assessing the suitability of analyses using ratio metrics for TSPO imaging included their ability to replicate group differences observed using VT as well as their sensitivity to detect group differences in regions in which neuroinflammation is known or expected. Of course, for the latter criterion to be satisfied, the PET signal elevations should match known patterns of glial activation in the disorders under investigation, possibly based on postmortem or other direct investigations. In ALS, considerable evidence links glial activation to neuropathology (32), and postmortem data have demonstrated a direct association between increased glial activation in the motor cortex and more rapid disease progression (33). These in vitro data are supported by numerous in vivo imaging studies (17,34–36). As such, ALS presents an excellent opportunity to perform validation studies with the approaches used in this study. Regarding chronic pain, activation of microglia or astrocytes has been reported in the spinal cord in patients with HIV-associated neuropathy (37) and complex regional pain syndrome (38). Although postmortem data directly demonstrating the spatial pattern of pain-related immunoactivation in the brain is so far unavailable, several preclinical studies report its occurrence in numerous brain regions, including the thalamus, somatosensory cortex, ventral striatum, and ventral tegmental area (39–41).
Using occipital cortex normalization, we found that the elevated 11C-PBR28 signal originally reported with SUVRWB (e.g., thalamus, somatosensory and motor cortices in cLBP patients; motor/premotor cortices in ALS patients) became more bilateral and pronounced with SUVRoccip. Importantly, many of these are regions that have exhibited glial activation in preclinical models of chronic back pain (39,41) and in postmortem and preclinical studies of ALS (32,33). Furthermore, in both disease cohorts we observed additional regions of significantly increased PET signal previously observed only well below threshold, and within structures affected by the respective pathologies. In cLBP patients, we observed elevated PET signal in the middle/anterior cingulate cortex (Fig. 5; Supplemental Table 1), in which glial activation has been suggested to underlie the affective component of pain in neuropathic pain models (42,43). Additionally, group effects were also detected in the ventral tegmental area and the ventral striatum, reward-processing regions that exhibit microglial activation in animal neuropathic pain models (40,41). In ALS patients, voxelwise SUVRoccip analysis revealed additional clusters in several regions, including prefrontal regions and anterior cingulate cortex (Fig. 6; Supplemental Table 2), which is in line with recent postmortem data demonstrating increased inflammatory markers in the frontal cortex of ALS patients (44).
We also reported that analysis of both refDVR and blDVR yielded group differences comparable to the analysis with VT and SUVR, and these outcomes were strongly correlated with SUVR measures. However, correlations between target VT and relative measures were not as robust as those between relative metrics. Further studies are warranted to investigate the observed dissociation between VT and ratio metrics.
It is important to stress that because of the large heterogeneity of clinical populations and TSPO tracer kinetics, the results presented here do not necessarily translate to other disorders with a neuroinflammatory component or other TSPO tracers. A cerebellar pseudoreference region achieved successful group separation in Alzheimer disease patients (4), but SUVRcereb did not detect group differences similar to those detected with VT in the current study, or in a recent study of temporal lobe epilepsy (7). In the current sample, this is likely because of a higher variability in SUVRcereb than SUVRoccip. These discrepant results emphasize the need for separate assessment of each clinical population and tracer of interest.
Several caveats should be considered when interpreting the results of our study. First, we did not measure fP. However, many previously published studies reported VT values without correction for fP (13,29), some electing not to incorporate it despite having collected it because of the excessive variability introduced by this measurement (15,30). Thus, it is currently unclear whether measurement of fP is beneficial for 11C-PBR28 quantification. Second, studies using relative metrics need to be interpreted cautiously and require careful validation in large cohorts to ensure the appropriateness of the region selected for pseudoreference. For a region to be a suitable pseudoreference, it should not display significant group differences. Although there were no group differences in uptake in our pseudoreference regions (except for WB VT in the cLBP study), this does not exclude the possibility that small, nonsignificant differences could bias the outcome measure. There was also a high degree of correlation between target and reference SUV and VT, which means a large part of the signal is removed from the target region, some of which may be biologically relevant. Finally, recent evidence suggests that vascular TSPO binding may affect quantification (10). Given the known heterogeneity of cerebral vascularization (45), it is possible that regional differences in vascular physiology (e.g., density) could affect binding differentially, which could lead to bias with pseudoreference strategies. However, the contributions of differential vascularization to tracer quantification are not well characterized.
CONCLUSION
In the current study, we present evidence indicating that approaches using ratio metrics appear to be similarly sensitive to detect pathology-related group differences in 11C-PBR28 signal as classic kinetic modeling techniques, at least for the populations evaluated here. However, the reasons behind the largely nonsignificant associations between relative metrics and VT need to be further elucidated. The occipital cortex emerged as the preferred pseudoreference region, because its signal was not significantly different across groups, and all ratio metrics based on the signal from this region detected group differences similar to those detected by VT, In addition, in the voxelwise analysis, SUVRoccip identified regions of increased glial activation that included those detected from the initial analyses, as well as several additional regions that were relevant to the respective pathologies and have been shown to exhibit glial activation in preclinical models or postmortem data. It is important to stress that caveats should be kept in mind when using relative measures, and that the choice of an appropriate pseudoreference region needs to be pathology-dependent and may not be possible in some cases (e.g., in which neuroinflammation is expected to span the entire brain parenchyma). In general, these techniques will require additional validation before widespread use.
DISCLOSURE
We thank the following funding sources: 1R01NS094306-01A1 (Marco L. Loggia), 1R01NS094306-01A1 (Marco L. Loggia), 1R21NS087472-01A1 (Marco L. Loggia), IASP Early Career Award (Marco L. Loggia), DoD W81XWH-14-1-0543 (Marco L. Loggia), Harvard Catalyst Advanced Imaging Pilot Grant (Jacob M. Hooker), a sponsored research agreement with Eli Lilly (Jacob M. Hooker), 5T32EB13180 (T32 supporting Daniel S. Albrecht), K23NS083715 (Nazem Atassi), and an Anne Young Fellowship (Nazem Atassi). No other potential conflict of interest relevant to this article was reported.
Acknowledgments
We acknowledge Drs. Ciprian Catana and Dan Chonde for help with image processing, and Drs. Vitaly Napadow and Rob Edwards for helpful discussion.
Footnotes
Published online Aug. 17, 2017.
- © 2018 by the Society of Nuclear Medicine and Molecular Imaging.
REFERENCES
- Received for publication August 12, 2016.
- Accepted for publication July 17, 2017.


Jump to section
Related Articles
Cited By...
- Study protocol for a phase II, double-blind, randomised controlled trial of cannabidiol (CBD) compared with placebo for reduction of brain neuroinflammation in adults with chronic low back pain
- Multimodal Investigation of Neuroinflammation in Aviremic Patients With HIV on Antiretroviral Therapy and HIV Elite Controllers
- Moving Toward Multicenter Therapeutic Trials in Amyotrophic Lateral Sclerosis: Feasibility of Data Pooling Using Different Translocator Protein PET Radioligands
- Head-to-Head Comparison of 11C-PBR28 and 18F-GE180 for Quantification of the Translocator Protein in the Human Brain